Venkata B. Dodla 1, Sudha Yerramilli 2
1TLGVRC, Jackson State University, 1230, Raymond Road, Jackson, MS, 39204, USA
2National Center for Biodefense Communications, Jackson State University, 1230, Raymond Road Jackson, MS, 39204, USA
Correspondence to: Sudha Yerramilli , National Center for Biodefense Communications, Jackson State University, 1230, Raymond Road Jackson, MS, 39204, USA.
| Email: |  |
Copyright © 2014 Scientific & Academic Publishing. All Rights Reserved.
Abstract
Geographic Information System(GIS) tools have been applied to build a model for the prediction of hurricane tracks of the Gulf of Mexico region. This is an analog model based on the climatologically nature of the movement of the global tropical cyclone systems in general. The model uses information from the historical tropical cyclone track data as available from the archives. Selective GIS and structured query language tools are applied to pick up all the historical tropical cyclone systems that are present within a selective radius of the active hurricane location and use them to produce the predicted track. The GIS model requires inputs of the in situ location of the active hurricane and three optional parameters. A case study of Hurricane Katrina (2005) track prediction has shown that the GIS model could predict the track with errors comparable to those from dynamical models.
Keywords:
Hurricanes, Track prediction, Modelling, Geographical information system
Cite this paper: Venkata B. Dodla , Sudha Yerramilli , A Geographic Information System Model for Hurricane Track Prediction, American Journal of Geographic Information System, Vol. 3 No. 2, 2014, pp. 75-87. doi: 10.5923/j.ajgis.20140302.02.
1. Introduction
A hurricane is the most destructive of all natural disasters, unleashing energy comparable to that of an earthquake, a volcano, a tsunami, or a nuclear weapon. Like most of the geophysical events, their prediction is very difficult. Although their intensification could be estimated in terms of sea surface temperature and other environmental factors, their movement from genesis to landfall is quite irregular. “Tropical cyclone” is a generic name for low pressure systems over tropical oceans with cyclonic surface wind speeds exceeding 33 meters/sec (74 mph). They are referred to as “hurricanes” in the North Atlantic and Northeast Pacific Ocean (east of dateline) basins and “typhoons” in the Northwest Pacific Ocean. Their global annual frequency is about 85 and about 9 hurricanes in the Atlantic. Analyses of historical hurricane data clearly indicate a long-term trend of an increase of one-hurricane every 30-years. With regards to the available historical records of hurricanes available since 1840’s, there could be inconsistencies due to hurricane measurements and reporting. Hurricanes were recorded as observed at landfall or reported from surviving boats in 1900s, with added reports from airplanes since 1950s and all hurricanes are identified and reported since the satellite era of 1960s. Land sea et al. (2010) suggested that the increase of hurricanes in the 20th century was due to improved quantity and quality of observations. An account of U.S. hit hurricanes is that 158 hurricanes of which 64 were major hurricanes with categories 3-5 had landfall, and Florida had the most of 57, followed by Texas with 36 and Louisiana and North Carolina with 25. The hurricane landfall regions of the United States were divided up into four main regions for frequency considerations: (1) The Gulf Coast from Brownsville, Texas to the Florida Peninsula; (2) The west coast of Florida from the Florida Panhandle to the Florida Keys; (3) The east coast of Florida from the Florida Keys to the Florida/South Carolina border; and (4) the remaining East Coast from South Carolina to Maine. Devastation from hurricanes occurs mainly around the landfall time due to heavy rain and strong winds causing damage to buildings, trees and cars and storm surges leading to coastal inundation. The Atlantic hurricane season is from June 1 to November 30, with a peak during mid-August to late October.In the era of global warming, increase in frequency, intensity, and duration of cyclone systems has been reported suggesting more destruction from these disasters. This is of great concern as the coastal habitation is rapidly increasing, with a growth of 50% from 1980 to 2003 along the south-eastern U.S. This means that the current hurricanes at the landfall would now inflict a much greater loss of life and property than from a similar hurricane 30 years ago and if hurricane frequency and intensities were to increase the problem would be even worse. (Emanuel, 2005). All this factual information emphasizes the need for hurricane landfall prediction as precisely as possible and with as much lead time as possible as the same would be critical for disaster mitigation and management. In U.S., National Hurricane Center (NHC) is the official agency which provides the weather prediction on different scales, which include hurricane prediction. NHC hurricane predictions are based on dynamical models, which use mathematical equations for atmospheric motion and physical processes and numerical methods to solve them. This prediction method of solving differential equations is an initial value problem and dependent on the initial state of the atmosphere. At the initial time, all the model variables over the numerical model domain are to be derived from irregularly spaced observations and so vary from the real atmosphere leading to uncertainties and errors in prediction. Since the errors in the initial state tend to grow with time during the forecast, small initial errors can become very large within a few days of the forecast period. The predictions from these models are time consuming and take few hours to produce the desired forecasts, as the model integrations take a few hours on the fastest super computers of the present time. NHC is presently using both the global and regional models for hurricane prediction. At least 5 global models with variations in numerical solutions, domain resolution and representation of physical processes and three different regional models specially designed for hurricane prediction are being used. The NHC official forecast errors are noted to be 55, 102, 147, 189 and 278 miles at 12, 24, 36, 48 and 72 hours (NOAA, 2012). In addition ensemble and consensus forecasts are under evaluation. Consensus forecasts are obtained by combining the forecasts from a collection of models, whereas the ensemble consists of multiple runs of a single model or runs from different independent models. They range from simple statistical models to complex dynamical models. A brief description of only the track prediction models are presented here and more details are available at the NHC website (NOAA, 2009).http://www.nhc.noaa.gov/modelsummary.shtml. In addition to dynamical models, statistical and statistical- dynamical models are also used to have track guidance and bench marking. Statistical models are built up on use statistical relationships, such as Climatology and Persistence Model (CLIPER5) which is based on regression relationships between parameters of movement during the previous 12- and 24-hour periods, the direction of motion, its current latitude and longitude, date, and initial intensity of the current hurricane to historical track records. At present this is used as a bench mark to compare the dynamical forecasts. Statistical-dynamical models (NHC98 for Atlantic and NHC91 for east Pacific) use statistical relationships between storm behaviour and predictors of CLIPER5 and forecast predictors of steering flow obtained from dynamical model forecasts, such as the deep-layer-mean GFS geo potential heights fields (averaged from 1000 to 100-millibars).Geographic Information System (GIS) is a database system with software that can analyse and display data using digitized maps and tables for planning and decision-making (Matejicek, 2005). A GIS can assemble, store, manipulate, and display geographically referenced data, tying this data to points, lines and areas on a map or in a table. GIS can be used to support decisions that require knowledge about the geographic distribution of people, hospitals, schools, fire stations, roads, weather events, the impact of hazards/ disasters, etc (Yerramilli, Dodla, & Yerramilli, 2011) Any location with known latitude and longitude or other geographic grid system can be a part of a GIS. GIS is a very useful tool for many aspects of emergency management, including: emergency response, planning, exercises, mitigation, homeland security and national preparedness. In addition to its ability to manage and display data, GIS has robust modelling capabilities, allowing its users to adjust data and scenarios for prediction, planning and estimation (FEMA, 2013). The current trend in GIS is on web-based mapping. This capability can allow users to view an already created map or create maps, based on their own specifications, on their personal computers. Web-based mapping is expected to widely expand the use of GIS in the workplace, in schools, and in homes (Zarcadoolas, Boyer, Krishnaswami, & Rothenberg, 2007).GIS tools were identified to provide a standardized platform for meteorological data analysis, with advantages of bringing multiple and large geospatial data bases together for climate research and to explore spatial patterns in meteorological data leading towards development an atmospheric information system (Wilhelmi and Brunskill, 2003). At this time, GIS tools are being used by NOAA Environmental Visualization Program and National Hurricane Center to visualize hurricane related satellite data and model outputs, and GIS based hurricane response and management through Environmental Systems Research Institute (ESRI). However, attempts have not been made so far towards the use of GIS tools to develop a hurricane prediction system. As such, this is a first attempt to develop a hurricane track prediction model based on GIS tools. In this paper, we report the results on the development of a GIS based hurricane prediction model for application to Atlantic Ocean basin affecting the U.S. Gulf Coast. The basis of the methodology is to use analog techniques for identifying all the past hurricanes similar to the in situ hurricane considering the parameters of location and time of the year. Descriptions of the GIS model development, basic data and the results of model application to Hurricane Katrina landfall prediction are provided in Sections 2, 3 and 4 respectively. Our study is based on the premise that hurricanes have a natural trend as evident from the historical data and quick exploration of all the past hurricanes with similar characteristics may prove valuable to have track guidance almost on real time. The developed GIS model would generate the output on hurricane track within 2 minutes as compared to few hours with dynamical model prediction, thus providing valuable lead time for disaster planning and mitigation measures. Hurricane Katrina (2005) was taken for case study as it was noted to be one of the most devastating natural disasters in United States history, and one of the five deadliest hurricanes ever to strike the United States, inflicting catastrophic damage and enormous loss of life in Louisiana and with its effects extending into the Florida, Georgia, and Alabama. This is also the most recent hurricane, for which different dynamical models showed significant differences in the track prediction indicating the uncertainties in model prediction. At this time, it may be said that no single dynamical model could be identified as the most suitable for prediction considering their performance over the last 5 years.
2. Description of GIS Model
The geo processing framework of the GIS model development that predicts the active hurricane track from the historical data is presented in this section and the “process flow diagram” representing the design of the framework is shown in Figure 1. This model has been developed using model builder application in Arc GIS 10. The work flows connect together sequences of geo processing tools feeding the output of one tool into another tool as input. Once the logical connections of the geo processing tools are successfully established, the elements in the model attains a specific color implying the model is ready to run. The inputs to the model are represented in blue color, the tools in yellow color and the green color represents the derived data from the tool. All the outputs derived from the model are stored in a geo database.This hurricane track prediction model developed using model builder application facilitates the automation of the whole process by storing the associations, input parameters and other data features of the various work flows involved in the geo processing tasks.
2.1. Conceptual and Logical Process of the Model
The GIS model is built upon the concept of predicting an active hurricane track and its landfall point from an historical dataset presented by NOAA for the hurricanes in the past 100 years. The first step is to pick up the in situ or active hurricane location point (hereafter referred to as HLP), in terms of latitude and longitude, from the official source, National Hurricane Center. The GIS model gets initialized with the HLP input data. An active region around the HLP is defined in terms of a parameter α, chosen as the distance from the HLP. All the historical hurricane/storms within the specified radial distance of α around the HLP were identified using the buffer tool in which the ‘linear unit’ parameters are set as per the requirements of α. All the hurricane points falling in the radial distance of α around HLP are extracted from the historical hurricane point dataset by using clip tool. To create this new feature class, the clip tool uses the buffer distance area (α) created by the buffer tool and historical hurricane dataset as the input parameters. To avoid/remove duplications (two or more points from the same hurricane track) from the clipped feature class and at the same time, retain the closest point to the active hurricane point, the near and dissolve tools are used. Using dissolve tool, the hurricane point features with the same identities (ids) are aggregated by choosing the dissolve field as the hurricane ids and the closest point is retained by opting the statistical field to choose the point with a minimum distance from the active hurricane point (obtained from near tool). Once the duplications are removed, the complete track data for each hurricane point is retrieved from the historical dataset by building a SQL (Structured Query Language) query using Make Query Table. This query is structured to pull the complete track data/lifecycle of the each hurricane point in the new feature class, matching their ids with the hurricane ids in the base dataset.As we do not need the hurricane track information prior to the time points, the track points that are present in the preceding time periods from the buffer region are excluded by building a query to pick the hurricane ids with hurr_id value greater than the hurr_id value in the feature class.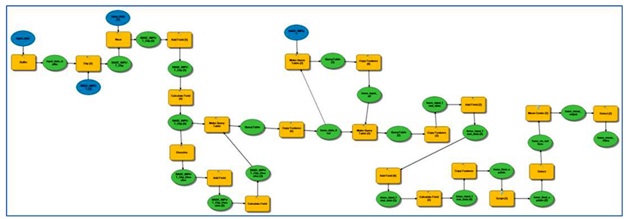 | Figure 1. Flow chart depicting various steps of the GIS model built up for hurricane track prediction |
With this execution, the hurricane points in the buffer region will have tracks starting from the buffer region till the end of their lifecycle. In order to assign a sequential number (time_id) to each time point in hurricane (from the starting point to the end of its life period), a custom tool is created in python script. This tool reads the hurricane ids in the database and based assigns a time_id number in a sequential/ascending order with respect to the time period. To explain further, hurricane track points having a number value of ‘1’ represent the first position of the track that start in the buffer area and the next points with number ‘2’ represents the recorded position of the track after 6 hours in each hurricane. This 6-hour time period is due to the specification of the hurricane tracks at 6-hour interval coinciding with 00, 06, 12 and 18 UTC. A new feature class is created with updated time_id fields. However, this data may have outlier points due to various reasons such as errors occurred in the data entry. Select tool is used to remove the outlier points, with the imposition of a condition that the track points that fall in the range of ± 20 degrees of distance from the active hurricane point’s with latitude and longitude are selected and the output is saved to a new feature class. With this new feature class, the model predicts the projected path for the active hurricane by calculating the mean of all the hurricane tracks by grouping the time_id fields. This has been achieved by using the Mean Center tool by setting the case field parameters as time _id. The output from the mean center tool generates a possible projected path for the active hurricane, with location points given at 6 hours interval. From this projected path, a 72 hour track path is selected by choosing the mean points with time_id field less than ≤ 13 and the final output is retrieved to a new feature class. Thus the GIS model provides a future projected hurricane track for the succeeding 72-hours, built up on the GIS tools and historical hurricane track data base as input. The GIS model has been built up using ESRI ArcGIS 10 and run on a desktop computing system with AMD Phenom Quad-core 9850 2.50GHz Processor, 4 GB RAM and 64-bit Windows 7 operating system. The model run for each experiment took 2-3 minutes of processing time. Thus the GIS model provides a future projected hurricane track for the succeeding 72-hours, built up on the GIS tools and historical hurricane track data base as input. The GIS model has been built up using ESRI ArcGIS 10 and run on a desktop computing system with AMD Phenom Quad-core 9850 2.50GHz Processor, 4 GB RAM and 64-bit Windows 7 operating system. The model run for each experiment took 2-3 minutes of processing time.
3. Description of Hurricane Track Historical Dataset
A new global dataset of tropical cyclone tracks, IBTrACS (International Best Track Archive for Climate Stewardship), has become available for scientific community from National Climate Data Center (NCDC) of National Oceanic and Atmospheric Administration/ National Environmental Satellite, Data, and Information Service (NOAA/NESDIS). The World Meteorological Organization Tropical Cyclone Programme has endorsed IBTrACS as an official archiving and distribution resource for tropical cyclone best track data. This dataset contains the most complete information of historical tropical cyclones available, compiled from numerous tropical cyclone datasets, provided in popular formats to facilitate analysis with quality control checks of storm inventories, positions, pressures, and wind speeds. A description of the dataset is given by Knapp et al. (2010) and the data is accessible from the official website of NOAA/NESDIS/NCDC (NOAA, 2013). The data is provided in different formats: “IBTrACS Dataset: IBTrACS storm files” which is the archived format of the IBTrACS data in which all parameters are available with one storm in each data file and all other formats are derived from this set of files; “netCDF” in which all IBTrACS files are combined into one file with all variables stored in the IBTrACS Dataset except the original reports from the source agencies (e.g., original latitude, longitude, pressure, wind); and “CSV - Comma Separated Variables” which contains most of the variables which had facility to be imported to a spreadsheet or database. In addition to these formats, tropical cyclone track data points are also given in the form shape files as suitable for using with GIS software. For the present study, we downloaded the following files: ibtracs_v02r01_pts.dbf; ibtracs_v02r01_pts.prj; ibtracs_v02r01_pts.sbn;ibtracs_v02r01_pts.sbx; ibtracs_v02r01_pts.shp;ibtracs_v02r01_pts.shp.xml and ibtracs_v02r01_pts.shx files from NOAA. This IBTrACS dataset contains complete information of the tropical cyclone tracks, and the built up of the GIS model for hurricane track prediction in this study required the use of only few parameters that are “STROMID”, “SEASON”, “STNUMBER”, “BASIN”, “STORMNAME”, “OBDATE”, “LATITUDE”, “LONGITUDE” and “MAINSID”.
3.1. Results
The built up GIS hurricane track model has been used to predict the track of Hurricane Katrina up to 72-hours prior to its landfall for validation. A brief description of the life cycle of Hurricane Katrina is provided in subsection 4.1. The GIS model has been applied first to study the sensitivity to certain parameters of buffer radius, seasonal time period and length of the historical data. This has been done through prediction of the track of Hurricane Katrina for 72-hours from “time of chosen point”, which is approximately 48 hours before the landfall. The best possible values were ascertained through statistical error analysis and comparison of the “Root Mean Square Error” and “Mean Absolute Error”. These results are described in subsection 4.2. Following this, the track of Hurricane Katrina was predicted at its different stages during the last 72 hours of its life cycle using the best values of the parameters. Here also we have computed the error statistics for each prediction experiment and presented mean errors. These errors were compared with official NHC model estimations and their error statistics. These results are described in subsection 4.3.
3.2. Hurricane Katrina
Hurricane Katrina was noted to be not only one of the five deadliest hurricanes ever to strike the United States but also as one of the most devastating natural disasters in United States history. The life cycle of this hurricane spans the period during 23–30 August 2005 with landfalls, as Category 1 hurricane on the southeastern coast of Florida at around 2230 UTC 25 August and with Category 3 intensity near the mouth of the Pearl River at the Louisiana/Mississippi border at 1110 UTC 29 August (Anne, 2005). Hurricane Katrina was first identified as a tropical wave on 19 August; as a tropical depression on 23 August was designated as the cyclone Katrina at 1200 UTC 24 August with its center located at about 65 nautical miles east–southeast of Nassau. Katrina attained hurricane intensity at around 2100 UTC 25 August, had its first landfall on the southeastern coast of Florida around 6:30 PM EDT (2230 UTC) 25 August with Category 1 intensity and moved west-southwestward over the southeastern Gulf of Mexico. Hurricane Katrina attained Category-5 stage during 0600 UTC to 1800 UTC 28 August with wind speeds reaching 150 knots; moved westward and weakened rapidly after 1800 UTC 28 August and had its second landfall near Buras, Louisiana at 5:10 AM CDT (1010 UTC) 29 August and made its third landfall near Pearlington, Mississippi and Slidell, Louisiana at 10:00 AM CDT (1500 UTC) 29 August as a Category 3 hurricane with an estimated wind speed of 105 knots (Figure 2). Later Katrina rapidly weakened over land to become a Category 1 hurricane by 1800 UTC 29 August, a tropical storm by 0000 UTC 30 August, a tropical depression at 1200 UTC 30 August and transformed into an extra-tropical low pressure system by 0000 UTC 31 August.
3.3. Sensitivity Experiments
For studying the sensitivity of model prediction to the three parameters of buffer radius, data period and season length, altogether 21 experiments were performed. All these Hurricane Katrina track predictions experiments were conducted for the prediction of Hurricane Katrina starting from 1800 UTC of 27 August 2005. In the first instance, 18 sensitivity experiments were made with three choices for buffer radius as 0.5, 1.0 and 2.0 degrees; two choices for the length of the season as 3 months of July-August-September and 6 months of June – July – August – September – October - November; and length of historical data as 1842-2004, 1950-2004 and 1970-2004. The hurricane season for U.S. is noted to be for 6 months start from 1June to 30November and the 3-month period is chosen to be the month of active hurricane under study and one month before and after. The length of historical data were chosen as considering all the data (1842-2004); data since modern observations were available (1950-2004) and 30 year data period (1970-2004) preceding 2005 as 30 year data is considered as reasonable sample size for climate studies. The values for buffer radius were chosen as 0.5, 1.0 and 2.0 degrees so as to have an assessment of the sample size on homogeneity of hurricane tracks with the active hurricane. The time point of 1800 UTC 25AUG was chosen so as to obtain 48 hour track prediction up to landfall time of 1100 UTC 25AUG.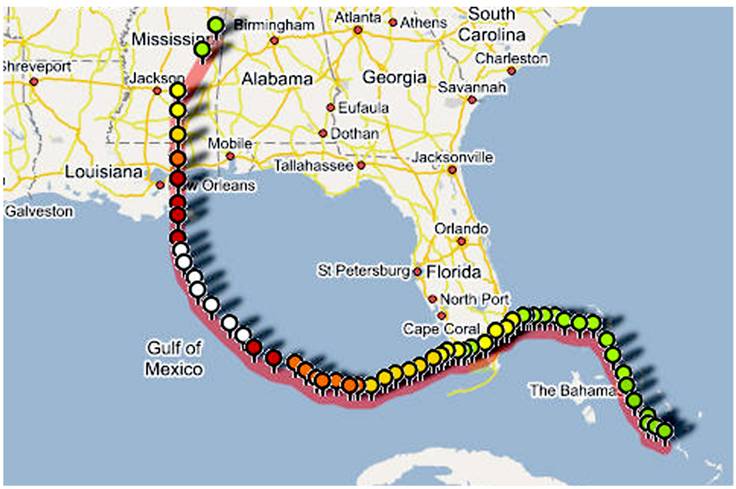 | Figure 2. Hurricane Katrina Track—Google Map |
Of the 18 sensitivity experiments that were conducted, the procedure was discussed for only one experiment and corresponding figures were shown. The procedural details are same for all experiments and only the results differ. Hence, the results of the experiment with buffer radius as 1.0 degree, 3-month season (July-August-September) and data period of 1950-2004 are shown. At the time of “1800 UTC 27AUGUST2005”, Hurricane Katrina was located at “24.5N, 85.3W” as per the historical data source (Figure 3). As the first step, all the cyclone points within a radial distance of 1.0 degree were picked using the GIS buffer and clip tools. It was noted that a total number of “28” were identified (Figure 4a). Using GIS “near” and “dissolve” tools, duplicate points (i.e.) points of the same cyclone storm were identified and only one point nearest to the active hurricane location was retained. After this application, “14”number of points was available (Figure 4b). 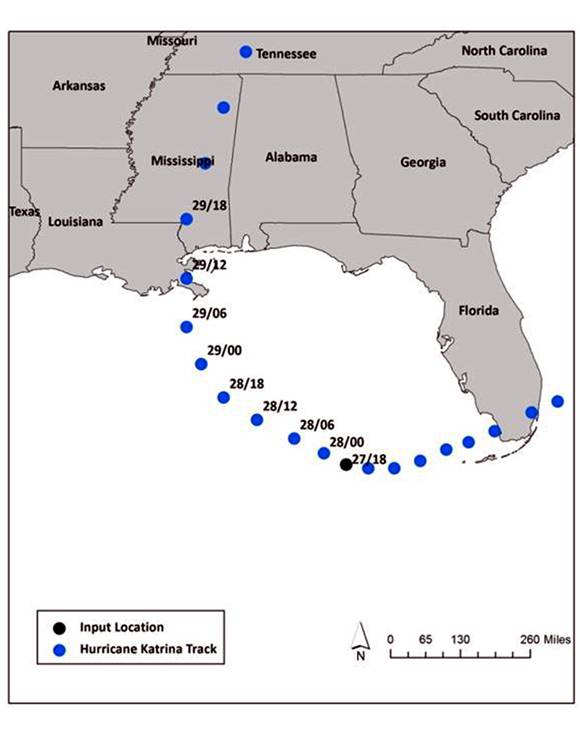 | Figure 3. Hurricane Katrina track positions at different times in intervals of 6-hours. Black color circle shows the chosen time point (1800 UTC of 27 August 2005) for sensitivity experiments |
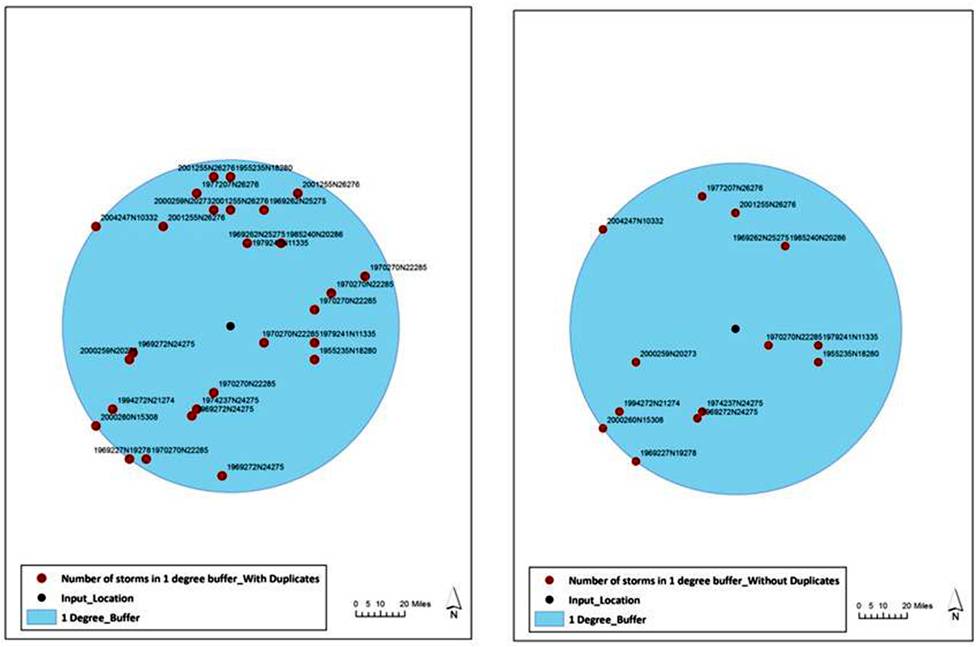 | Figure 4. All hurricane locations within 1 degree buffer radius of the active hurricane point, (a) showing all points (left) and (b) after deletion of duplicate points (right) |
The tracks of the cyclonic storms associated with each of these points were identified and all the subsequent time points alone were retained by discarding the prior points using SQL queries. All the individual hurricane tracks at 6-hour interval are then placed in a time sequence using a custom tool. The historical hurricane tracks as complete and subsequent to the active hurricane time point are shown in Figure 5. At this stage, all the points are checked for any outliers by imposing a check on their location to be within 20 degrees. The choice of 20 degrees is arbitrary and chosen keeping the possible distance any hurricane would travel within its life cycle from the prediction start time. “Mean Center Tool” issued to produce a geospatial mean track with location points at 6-hour interval. This is the predicted hurricane track analog (Figure 6) from the chosen time point of the Hurricane Katrina in this study. This procedure is repeated for all the 18 different combinations of experiments and the computed track distance errors are shown in Table 1. The predicted hurricane tracks from the 18 experiments are shown in Figure 7. The error statistics clearly indicate that the preceding described experiment is the best with least error of 102 and 65 miles at 24 and 48 hours respectively. This inference is based on the comparison of the errors with each class of the different sensitivity experiments. Firstly, considering the length of the hurricane season period, the errors were higher with the use of full season length of June-November as compared to selective three month period (in this case July-August-September). The errors with buffer radius of 0.5 degree with the three month period are also higher and of the same order of magnitude as with six months. The authors, through in-depth probe, identify that small sample size with 0.5 degree buffer radius is the reason for the large errors. Secondly, considering the use of the data set length, the errors were noted to be highest with the use of the full data set (i.e.) all the historical data of 1842-2004. Errors with the other two data lengths of 1950-2004 and 1970-2004 are of the nearly the same magnitude and use of the data period as 1950-2204 is noted to be better with lesser errors. Errors with respect to different buffer radii show that buffer radius of “1.0” and “2.0” degrees have errors to be in the same range whereas the errors are significantly higher with buffer radius “0.5 degrees”. These observations indicate that the nature of hurricane tracks to have changes since the start of the present industrial era. Though cannot be concluded, the change in the hurricane tracks may be due to global warming due to increase of CO2 associated with industrialization. The inferior performance with buffer radius “0.5 degrees” is due to smaller sample size.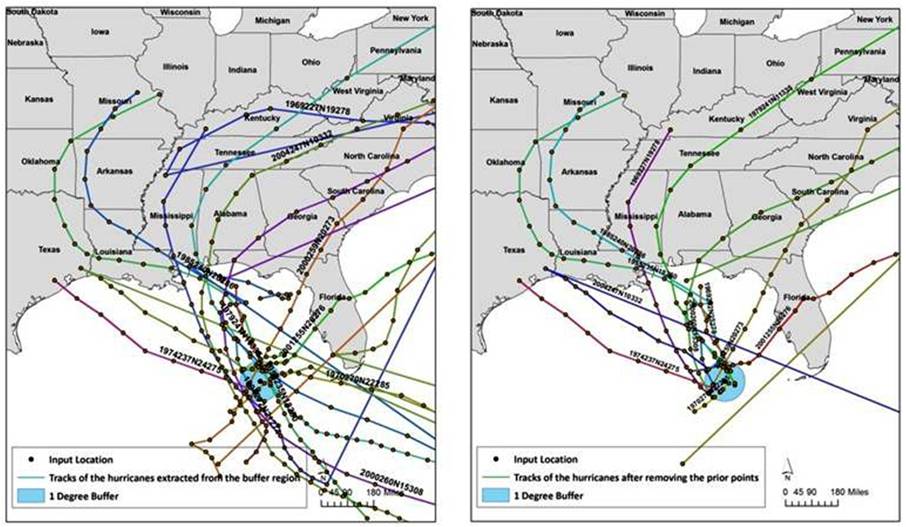 | Figure 5. Hurricane tracks for the extracted locations within the buffer region, (a) left panel shows complete tracks and (b) right picture shows tracks succeeding the buffer point |
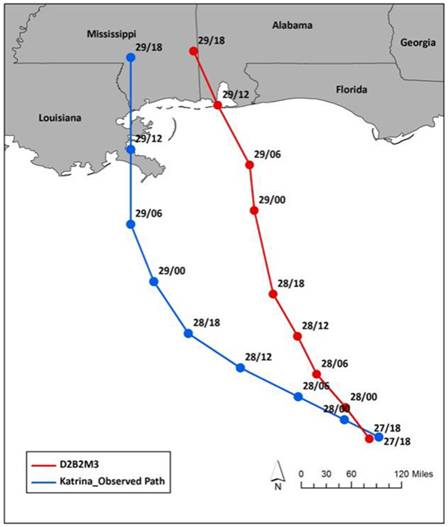 | Figure 6. Observed (blue line) and GIS model predicted (red line) Hurricane Katrina track starting from 1800 UTC 27 August 2005.Track points are shown at 6-hour interval |
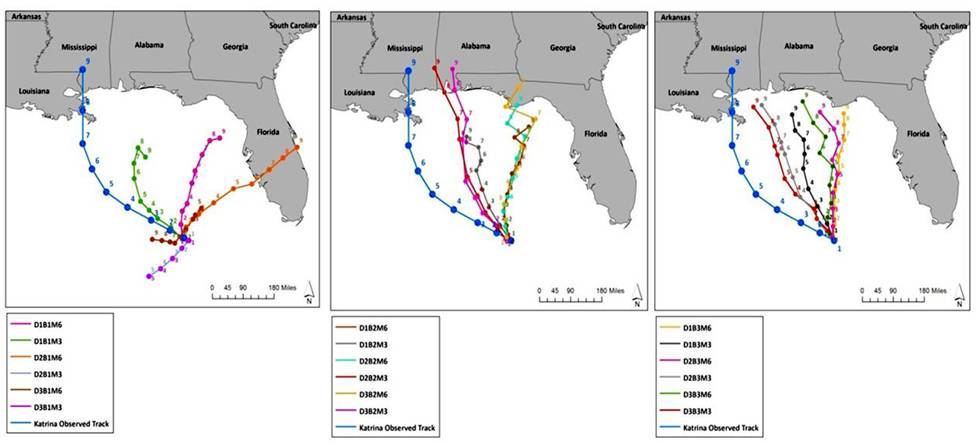 | Figure 7. Hurricane Katrina observed track (blue color) and predicted tracks starting from 24.5N, 85.3W at 1800 UTC 27AUGUST2005, with buffer radius as (a) left panel: 0.5 degrees; (b) middle panel: 1.0 degrees and (c) right panel:2.0 degrees; for different values of historical data as D1=1842-2004, D2=1950-2004 and D3=1970-2004; for seasonal length as M3=July-August-September and M6=June-July-August-September-October-November |
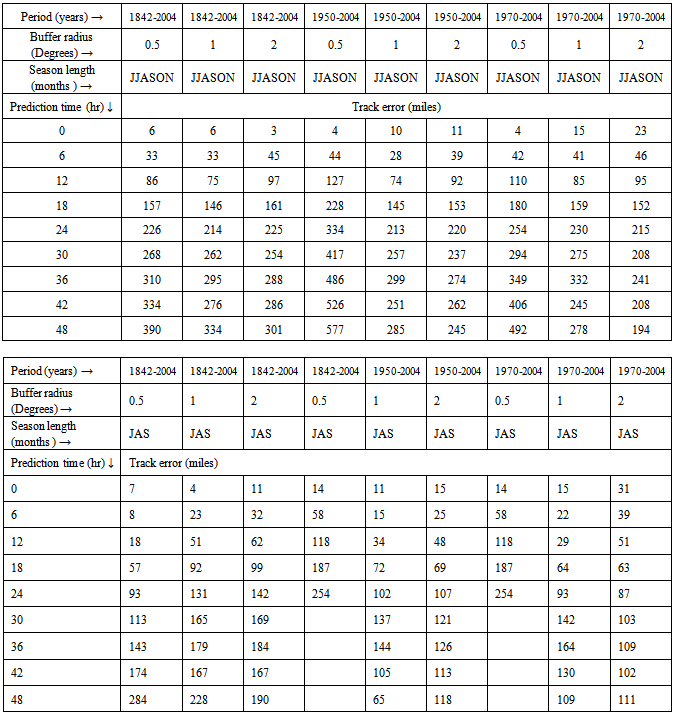
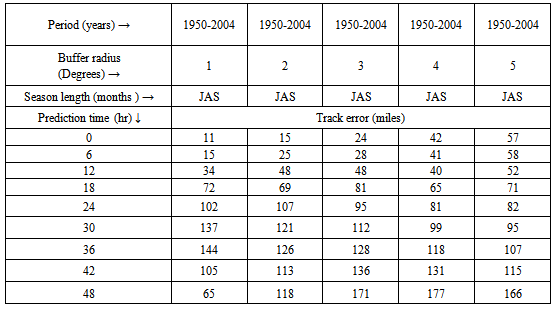
Table 1. Hurricane Katrina Track Prediction errors (miles) for the 18 experiments of sensitivity with respect to buffer radius, seasonal length and historical data period
 |
| |
|
Due to difficulty to judge relative merits of the experiments with buffer radius as “1.0” and “2.0” degrees, three more experiments were conducted with buffer radius as 3.0, 4.0, and 5.0 degrees to ascertain if buffer radius higher than 2.0 degrees would lead to better track prediction and if so to optimize the value for buffer radius. All of these three additional experiments were made keeping the historical data period as 1950-2004 and seasonal length as 3 months, since these have clearly identified to be the best of choice. The predicted tracks from the six experiments with these values for historical data set and seasonal length and with six different buffer radius values of 0.5, 1.0, 2.0, 3.0 4.0 and 5.0 degrees are shown together in Figure 8 and the corresponding grouped error values in Table 2. A comparison of the results from these six experiments clearly show that buffer radius as “1.0” and “2.0” degrees show better performance than all other experiments, indicating that higher buffer radius lead to larger sample size and thus effecting the homogeneity. Higher buffer radiuses tend to have larger errors during the early period of prediction, before 24 hours and lesser errors beyond. Although “1.0” or “2.0” degrees could be taken as the optimized values for “buffer radius”, keeping in view of the varying errors before and beyond 24 hours, prediction experiments of the Hurricane Katrina track starting from 9 different time points were conducted with five values for buffer radius (except 0.5 degrees), the results of which are presented in the next section.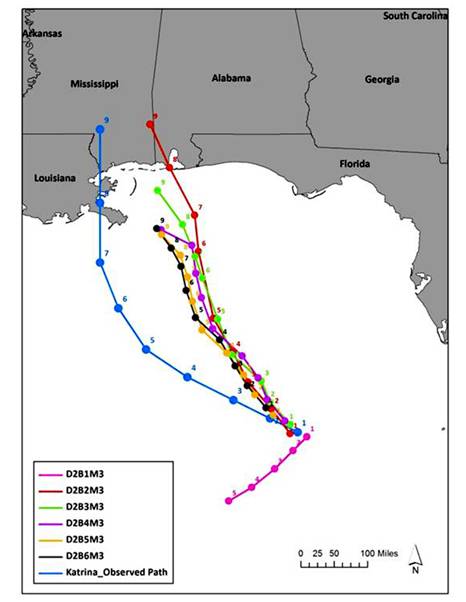 | Figure 8. Hurricane Katrina observed track and predicted tracks starting from 24.5N, 85.3W at 1800 UTC 27AUGUST2005, for the experiments with different buffer radius with fixed data period as D2=1950-2004; seasonal length as M3=July-August-September. Buffer radius values are taken as B1=0.5, B2=1.0, B3=2.0, B4=3.0, B5=4.0 and B6=5.0 degrees |
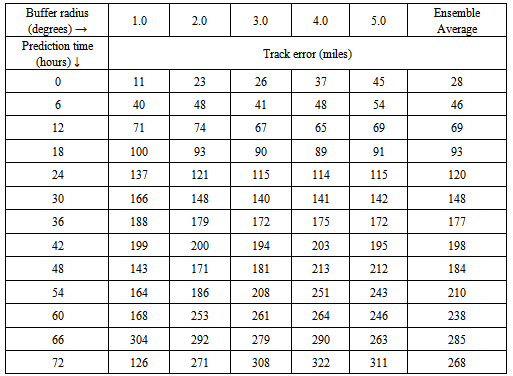
Table 2. Hurricane Katrina Track Prediction errors (miles) for the 5 experiments of sensitivity with different values for buffer radius
 |
| |
|
3.4. Hurricane Katrina Track Prediction
Hurricane Katrina had a long life cycle with its first identification as a tropical wave on 19 August over southeast Bahamas to its final landfall on 29 August near Pearl River at Louisiana/Mississippi border. For the present study, we have chosen nine time points starting from 1800UTC 26August up to 1800UTC 28August at 6-hour time interval, such that the last prediction starting from 1800UTC 28August would provide a 24-hour prediction before the landfall. With this set up, track prediction of Hurricane Katrina using the proposed GIS model and the predicted track points were considered up to 1800UTC 29 August only as the landfall occurred around 1100UTC 29August. As mentioned in the previous section, five sets of predictions were obtained with options for the historical data period as 1950-2004, seasonal length as July-August-September, and five values for buffer radius as 1.0, 2.0, 3.0, 4.0 and 5.0 degrees. Vector distance errors were computed as errors corresponding to different periods from 6-72 hours at 6-hour interval for each of the six experiments and presented in Table 3. It is noted that the least of the average errors are 72, 137, 188, 143 and 168 miles corresponding to 12, 18, 24, 26, 48 and 60 hours from the experiment with buffer radius as 1.0 degrees. Track errors for other experiments are noted to increase with increase of buffer radius. The predicted tracks from each of the nine time points for the best experiment only are shown in Figure 9. These values are considered reasonable in comparison with NHC (National Hurricane Center) average model hurricane track prediction errors of 46, 69, 104, 127 and 161 miles corresponding to 12, 18, 24, 26, 48 and 60 hours (NOAA, 2013). Another important fact is that dynamical model predictions from suite of models considered by NHC show a large spread with large differences in the track, as seen from model predicted tracks of Hurricane Katrina starting from 26 August (McCallum and Heming, 2006). It is also inferred, through a comparison of the GIS model produced tracks with different options with suite of dynamical model predictions, that GIS predicted tracks with different options fall well within the prediction spread of the dynamical models. Table 3. Hurricane Katrina Track Prediction errors (miles) for the 9 experiments with prediction starting at different time points
 |
| |
|
3.5. Prediction of Landfall Time and Location
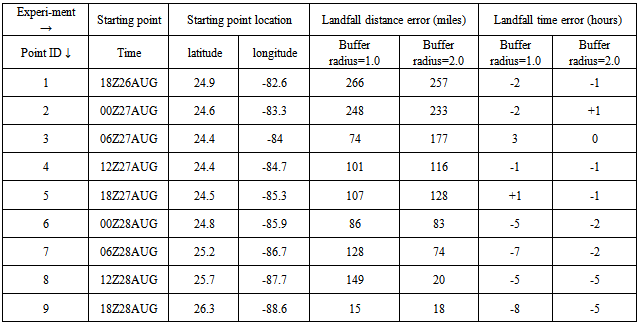
As mentioned in the introduction, prior information of the landfall time and location are important as they provide valuable inputs to the decision support system to initiate mitigation measures regarding the annual occurring natural disaster phenomena. In view of its importance, landfall time and location were computed for the nine prediction experiments made starting from different time points in the life cycle of Hurricane Katrina for each of the two experiments with buffer radius of “1.0” and “2.0” degrees. These nine predictions could be taken as nine lead times for interpretation and use of information. The time and distance errors are shown in Table 4. The landfall errors are noted to be consistently moderate with buffer radius of 2.0 degrees than 1.0 degree radius. It is seen that the GIS model predicted the landfall point with a lag of 3-6 hours (estimated to be later than the actual occurrence) with lead time of 66-36 hours. The errors with smaller lead times have increased owing to differences in the predicted speed of movement of Hurricane Katrina. Correspondingly, the distance errors were 233, 116, 83 and 20 miles at lead times of 60, 48, 36 and 24 hours respectively. The smaller time and distance errors with lead times of 36 and 48 hours indicate the usefulness of this model in emergency.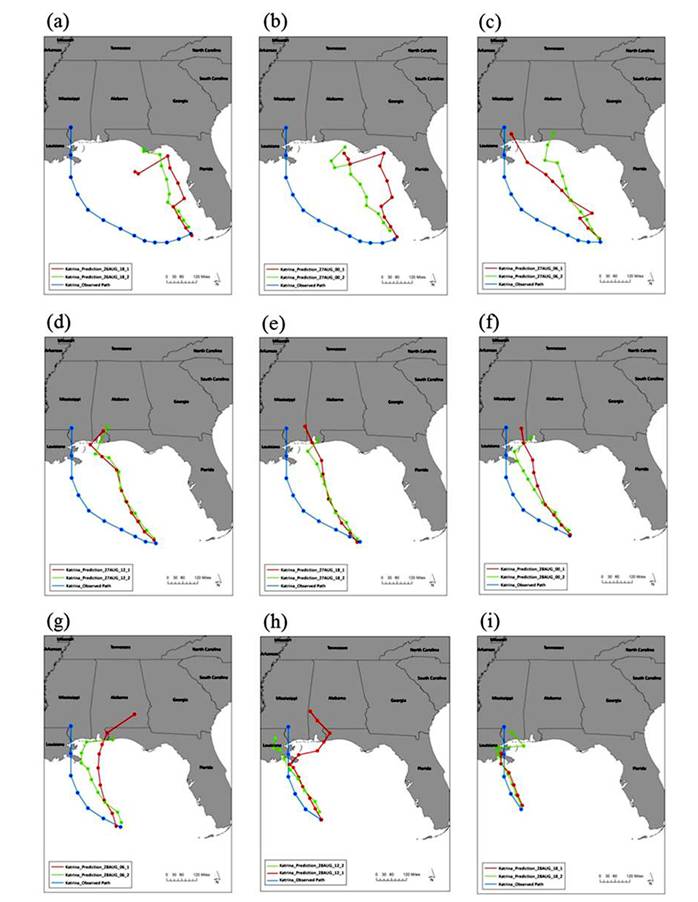 | Figure 9. Observed track (blue line) and predicted tracks of Hurricane Katrina from different time points of (a) 18Z,26AUG (b) 00Z,27AUG (c) 06Z,27AUG (d) 12Z,27AUG (e) 18Z,27AUG (f) 00Z,28AUG (g) 06Z,28AUG (h) 12Z,28AUG and (i) 18Z,28AUG. Red and green lines indicate predicted tracks with buffer radius of 1.0 and 2.0 degrees respectively |
Table 4. Hurricane Katrina Landfall Prediction errors (miles) for the 9 experiments starting at different time points
 |
| |
|
4. Summary
This paper reveals the possibilities of hurricane track prediction over Atlantic Ocean using GIS tools. The sequential steps of the development of GIS model with different tools and applications and using historical hurricane track data of 1842-2008 were described. The model output is dependent on three different parameters of “length of input data”, “length of hurricane season” and “buffer radius”. Sensitivity of hurricane track prediction to these three parameters was studied through a case study of Hurricane Katrina. Results indicated that the model prediction is better with use of historical hurricane track data as of 1950-2004, hurricane season length as three months (i.e.) month of active hurricane and preceding and succeeding months and buffer radius as 1.0/2.0 degrees. The GIS model could predict the Hurricane Katrina track with errors of 46-161 miles corresponding to 12-60 hours prediction. Landfall could be estimated with a time error of 1-hour and distance error of 100 miles with a lead time of 48 hours. Although the results of this paper pertain to only one case study and require extensive validation with more number of past hurricanes, use of GIS tools and applications is amply demonstrated in the geospatial analysis and computations. Some advantages of this GIS model over the current dynamical atmospheric models are the requirement of minimal computational resources such as a desk top computer loaded with ARCGIS software and computational time of 2-3 minutes for running the entire model. This provides an opportunity to run this model at repeated intervals to update the hurricane track prediction with desirable lead times to facilitate planning and mitigation. This is a maiden attempt to apply GIS tools and applications for hurricane track prediction and has scope for further improvement through imposition of more constraints to find better homogenous historical hurricane tracks.
References
| [1] | Emanuel, Kerry, 2005. Increasing Destructiveness of Tropical Cyclones over the past 30 years.Nature.436, 686-88. |
| [2] | Knapp, K. R., M. C. Kruk., D. H. Levinson., H. J. Diamond., and C. J. Neumann., 2010. The International Best Track Archive for Climate Stewardship (IBTrACS): Unifying tropical cyclone best track data. Bulletin of the American Meteor Society. 91, 363-376. doi:10.1175/2009BAMS2755.1 |
| [3] | Landsea, Christopher W., Gabriel A. Vecchi., Lennart, Bengtsson., Thomas R. Knutson., 2010. Impact of Duration Thresholds on Atlantic Tropical Cyclone Counts. J. Climate. 23, 2508–2519.doi: 10.1175/2009JCLI3034.1. |
| [4] | McCallum, E., J. Heming., 2006. Hurricane Katrina: an environmental perspective Phil. Trans. R. Soc. A, 364, 2099-2115. |
| [5] | Wilhelmi, Olga V., Jeffrey C. Brunskill., 2003. Geographic Information Systems in Weather, Climate, and Impacts. Bulletin of the American Meteor Society. 84, 1409–1414. |
| [6] | FEMA. (2013). Applications of GIS for Emergency Management. Retrieved 2013, from www.fema.gov: http://emilms.fema.gov/is922/GISsummary.htm |
| [7] | NOAA. (2012, Aug 2). Hurricane Preparedness - Watches & Warnings. Retrieved Oct 2013, from www.noaa.gov: http://www.nhc.noaa.gov/prepare/wwa.php |
| [8] | NOAA. (2013). IBTrACS. Retrieved 2013, from : http://www.ncdc.noaa.gov/ibtracs/index.php?name=ibtracs-data. |
| [9] | NOAA. (2009, July). NHC Track and Intensity Models. Retrieved Oct 2013, from : http://www.nhc.noaa.gov/modelsummary.shtml. |
| [10] | Waple, A. (2005). Hurricane Katrina. National Climatic Data Center. |
| [11] | Yerramilli, A., Dodla, V., & Yerramilli, S. (2011). Air Pollution, Modeling and GIS based Decision Support Systems for Air Quality Risk Assessment. In F. Nejadkoorki, Advanced Air Pollution (pp. 295-324). InTech. |
| [12] | Zarcadoolas, C., Boyer, J., Krishnaswami, A., & Rothenberg, A. (2007). GIS Maps to Communicate Emergency Preparedness: How Useable Are They for Inner City Residents? Journal of Homeland Security and Emergency Management, Vol 4 Issue 3. |
 Abstract
 Reference
 Full-Text PDF
 Full-text HTML