Akajiaku C. Chukwuocha1, Joel I. Igbokwe2
1Department of Surveying and Geoinformatics, Federal University of Technology, Owerri, Nigeria
2Department of Surveying and Geoinformatics, Nnamdi Azikiwe University Awka, Nigeria
Correspondence to: Akajiaku C. Chukwuocha, Department of Surveying and Geoinformatics, Federal University of Technology, Owerri, Nigeria.
| Email: |  |
Copyright © 2012 Scientific & Academic Publishing. All Rights Reserved.
Abstract
Catchment delineation and characterization are gaining increasing global attention as scientists seek better understanding of how runoff interacts with the landscape in the face of increasing flood devastations across the globe. All surface water flow systems occur in units of sub-catchments, the basic unit of landscape that drains its runoff through the same outlet to contribute to the main stream of the overall catchment. The delineation and characterization of sub-catchments would provide some basic data required for flood prediction, drainage design, water quality studies, erosion data, and sediment transport among others. In this study, Geographic Information Systems (GIS) were used to create a Digital Elevation Model (DEM) of Owerri, South East Nigeria. The DEM was validated using Global Navigational Satellite Systems (GNSS) surveys. The DEM was processed through a number of steps in GIS to determine drainage routes with a minimum accumulation threshold. All cells that contribute into each stream were dissolved into a single unit of sub-catchment polygon and delineated. Characteristics of the sub-catchments including the average slope, the longest flow distance, the area and the centroid coordinates required for input in the Storm Water Management Model of the Environmental Protection Agency of U.S.A. were determined.
Keywords:
Digital Elevation Model (DEM), Sub-catchments, Drainage routes, Delineation, Characterization
Cite this paper: Akajiaku C. Chukwuocha, Joel I. Igbokwe, Delineation and Characterization of Sub-catchments of Owerri, South East Nigeria, Using GIS, American Journal of Geographic Information System, Vol. 3 No. 1, 2014, pp. 1-9. doi: 10.5923/j.ajgis.20140301.01.
1. Introduction
Runoff prediction and control are gaining global attention due to increasing flooding resulting from more tempestuous climate events owing to global warming. As atmospheric temperatures nudge higher, the scientific world is responding with efforts at learning more of the way the morphology of sub-catchments reacts with rain storm runoffs.Abdoulaye D. (2010) reporting for the United Nations Office for the Coordination of Humanitarian Affairs, Regional Office for West and Central Africa (UNOCHA/ ROWCA) writes, "Since 2007, the flood situation in West Africa is becoming more and more recurrent and the impact on the population and infrastructures is becoming more severe.”Owerri, capital city of Imo State, South East Nigeria has also had many cases of flooding in the past quarter of a century, along with a good number of other Nigerian cities[2-3]. Vanguard Newspaper of Nigeria of Monday 27th June 2005 reported that, "about 3,500 families in Owerri municipality and its adjoining villages were at the weekend sacked by flood, which resulted from a heavy rainstorm that lasted for two days." The Newspaper put the cost of the material loss at N200 Million. Over the years the perennial flooding has not abated. Delineating and characterizing the sub-catchments of Owerri would be a very important step in understanding and managing flooding in the area. The reasons for delineating and characterizing the sub-catchments of an area include the following among others. One, delineating and characterizing sub-catchments provide the basis for predicting flooding, erosion and sediment movements. Two, the critical characteristics of contributing area and slope are important to the Engineers who design the drainage systems of the urban areas. Lastly, the knowledge of flow direction at DEM cellular level is of great importance in environmental pollution studies when it is considered that runoff flow direction and velocity are critical in understanding location of water borne diseases and pollution distribution. The aim of this research was to delineate the sub-catchments of Owerri urban area and to document the important flow characteristics of each sub-catchment in a GIS environment. In order to achieve this, the drainage routes were marked out in the GIS environment, and the DEM cells that contribute to each drainage route delineated in the same polygon as a sub-catchment. The hydrological characteristics of the sub-catchments such as the average slope, the longest flow distance, the area of each sub-catchment, and the centroid coordinates required as input data in the Storm Water Management Model (SWMM 5.0) of the Environmental Protection Agency of U.S.A., were either automatically extracted or computed from the GIS into the attribute tables of the sub-catchments.
1.1. Study Area
The study area is the urban area of Owerri, Imo State, South East Nigeria and its environs. Owerri is the capital city of Imo State, South East Nigeria. Owerri with a population of about 150,000 situates between 50 20'N, 60 55'E in the south-western corner and 50 34'N, 70 08'E in the north-eastern corner. The old city of Owerri is bordered on its south by Otamiri River and on its west by Nworie stream. However with the development of the New Owerri City over side Nwaorie stream, on the western side, the two water bodies now transverse the town.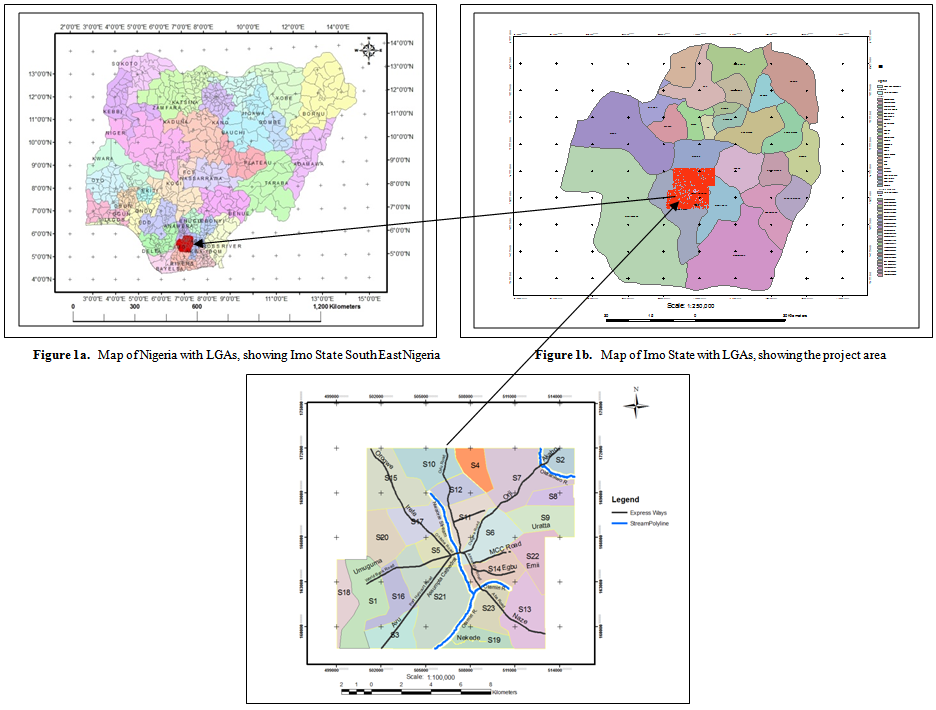 | Figure 1c. Location Map of the Project Area in Owerri, South East Nigeria |
1.2. Sub-Catchment Delineation and Characterization Using GIS
Geographic Information Systems (GIS) are increasingly being recognized for their use in storing and analyzing the large volumes of data necessary for managing the environment. Paracchini, M. L., et al (undated) notes the need of GIS in handling the large datasets involved in monitoring the state of environment and adds that the use of GIS for handling environmental data in the European Union has assumed a formal role as Member States are explicitly asked to provide data in GIS compatible format.Bertolo F. (2000) writes, "The last years saw a general recognition of the catchment or the drainage basin as the most significant surface unit in environmental studies. Traditionally catchment boundaries have been manually derived from topographic maps, a labour-intensive activity. This limitation has changed after the introduction of Digital Elevation Models (DEMs).” Maidment, D. (2002) writes that "traditionally, drainage areas have been delineated from topographic maps, where drainage divides are located by analyzing the contour lines. Arrows representing water flow direction can be drawn perpendicular to each contour, in the direction of the steepest descent... Drainage areas can also be delineated automatically using digital elevation models of the land-surface terrain. A digital elevation model (DEM) is a grid of square cells, where each cell value represents the elevation of the land surface. By determining how water flows from cell to cell, the set of cells whose drainage flows through the cell at the outlet point location can be identified, and thus the drainage area determined."Bertolo F. (2000) writes, "Even though methods for delineating catchment boundaries and flow paths from contour lines[7] and triangulated irregular networks[8-9] provide reliable results, they require extensive data storage and computation time. Grid cell elevation models have advantages for their computational efficiency and the availability of topographic databases[10]. Therefore, they have seen widespread application for analyzing hydrological problems."A GIS such as ARGIS and its extensions have the capacity to delineate and describe drainage routes when a Digital Elevation Model (DEM) is developed. Bertolo F. (2000) notes that "The catchment delineation is a two-step procedure: drainage patterns have to be recognized before the boundaries between different catchments can be inferred.”Lo, C. P. and Yeung, A.K.W. (2002) writes, "The delineation of linear topographic features (e.g. river channels and ridges) is a much researched topic area in digital terrain modeling... At present, the most commonly used method appears to be the so-called "hydrological approach" proposed by Mark, D.M. (1984). In this method, the "drainage area" of each DEM elevation cells (i.e., the number of elevation cells that drain into the cell) is first determined by climbing recursively through the DEM. This process results in a matrix, called the "drainage area transform”, which contains the drainage areas for all the grids in the DEM. The information in the drainage area transform is then used to trace the "channel pixels," as identified by those cells with large drainage areas. Channels are recursively followed upstream until there is no more point that exceeds a minimum threshold. Once the drainage network has been delineated, ridges may be delineated either by gray-scale thinning of all non-channel pixels or by tracing the boundaries of the catchment area.
1.3. Sub-Catchment Characterization Parameters
A sub-catchment is characterized when vital parameters of its morphology are determined and recorded. Sub-catchment characterization has become a very important study in the efforts to understand and gain capacity to manage runoff flow and other important watershed features. Catchment characterization is an ongoing project of the European Union. Bertolo F. (2000) writes, "The “Catchment Characterization and Modelling (CCM) activity of the EuroLandscape project is aiming at a European-wide mapping of catchments and drainage networks. The derived catchments shall then be characterized and classified according to surface characteristics, land cover dynamics and run-off conditions. Subsequently, runoff, soil erosion, and sediment dynamics will be modeled for selected (representative) catchments in order to assess the risk of land degradation and needs for environmental protection.”Factors that would characterize a sub-catchment are many. Purpose of characterizing sub-catchments would determine which factors are included. Generally the area of the sub-catchment and average slope tend to always make the list. The Storm Water Management Model (SWMM) 5.0 of the Environmental Protection Agency of the U.S.A. lists a number of factors that would characterize sub-catchments as required for storm water management. Some of the hydrologic features of the SWMM scheme given by Gironas et al (2009) are presented hereunder. i) Area: This is the land size bounded by the sub-catchment boundary. ii) Remotest Overland Flow Distance, L (m): This is the longest route that runoff will travel before charging the channel. By the time runoff from that remotest point travels to the node of the channel, the channel will be charged by the fullest quantity possible under the prevailing runoff condition.iii) Width: The width can be defined as the sub-catchment’s area divided by the length of the longest overland flow path that water can travel. iv) Slope: This is the slope of the land surface over which runoff flows or the overland flow path or its area-weighted averagev) Imperviousness: This is the percentage of the sub-catchment area that is covered by impervious surfaces. vi) Roughness Coefficient: The roughness coefficient reflects the amount of resistance that overland flow encounters as it runs off the sub-catchment surface. Since SWMM 5.0 uses the Manning equation to compute the overland flow rate, this coefficient is the same as Manning’s roughness coefficient n.
2. Materials and Methods
Digital Elevation Model (DEM) of the project area was created using data from topographical maps of the project area on a GIS platform. The drainage routes and their corresponding sub-catchments were delineated by GIS processing.
2.1. Data Acquisition
The research essentially involved analysis of topographic data of the about 186.024 Sq. Km (18602.38 Ha) project area. For such a wide area of coverage ground survey methods are not feasible for collating all the required field data. Thankfully topographic maps of Owerri Nucleus area were made available by the Imo State Surveyor General and the Head of the Survey Department, Owerri Capital Development Authority. The topographic map series titled the Owerri Nucleus Sheet series was compiled and produced from Aerial Photographs of Owerri Nucleus dated 23 - 27 January, 1977 by Geodetic Surveys Ltd. for the Imo State Government. This was the only credible source for homogeneous topographic data covering the wide area. The need for homogeneity of topographic data is critical in topographic studies. A mixture of data sources would require extra care in handling: a positional shift as a result of non-homogeneous data would easily create artificial cliffs, depressions or risings in the project.
2.2. Data Processing, DEM Creation and Analysis
ArcGIS 9.2 and ArcHydro software were used to process the topographic data derived from the topographic maps of the Owerri Nucleus Sheet to locate the drainage routes of the project area and to delineate the sub-catchments that drain into these routes.
2.2.1. Scanning and Georeferencing
The topographic maps were scanned using the Colortrac SmartLF Gx 42 Scanner. 62 number 1/2,500 topo sheets were scanned in the Tagged Image File Format (TIFF) and stored in compact disks. The scanned images of the topo sheets were added as data into ArcMAP. The reference system of the topo maps is the Nigerian Transverse Mercator system, Minna B.datum. The topo sheet images were georeferenced in ArGIS using the transformation parameters of Minna B relative to the World Geodetic System 1984 (WGS 84) datum. The full transformation details from WGS 84 System to Minna B System used is the set determined for Owerri by Chevron Nigeria Limited in 1999 presented in Oil Mining License (OML 53) GPS campaign Technical Report. The determined parameters are as follow: dx = -93.179m, dy = -87.124m, dz = 114.338m Ωx = 0.00000", Ωy = 0.00000" Ωz = 0.00000", s = 0.00000ppm.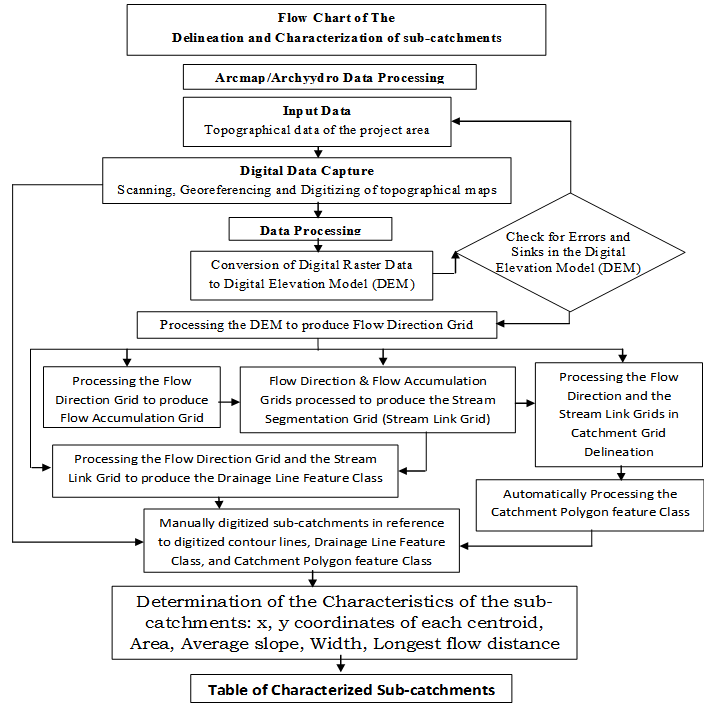 | Figure 2. Flow Chart of the Project Methodology |
2.2.2. Digitizing Scanned Map Data and Creating the Digital Elevation Model (DEM)
After the georeferencing and checking for proper alignment the maps were fully digitized as each map feature was digitized by tracing them one feature class at a time using the sketch tool of ArcMAP. It took 2 months of full night and day work to complete digitizing of the maps. After digitizing, Digital Elevation Model (DEM) of the project area was created in a number of processes using 3-D Analyst tool of ArcMAP. It was ensured that the DEM created was free of sinks before further use. Sinks are erroneous depressions that occur as some cells in the DEM assume values that are lower than the neighbouring cells. This is caused by the erroneous interaction between the algorithms that create the DEM and the topo data itself.The linear interpolation method was used in creating the DEM. The longer side of the project area measures about 14,000m. The sampling distance chosen was 2500. This resulted into cells of 2501 columns and 2120 rows with cell sizes of 5.598m x 6.368m. Fig. 3 shows the resulting DEM with its values coded in grey shed. The DEM values stretch in discrete values from 42 to 129; the lowest and highest contour values of the project area. 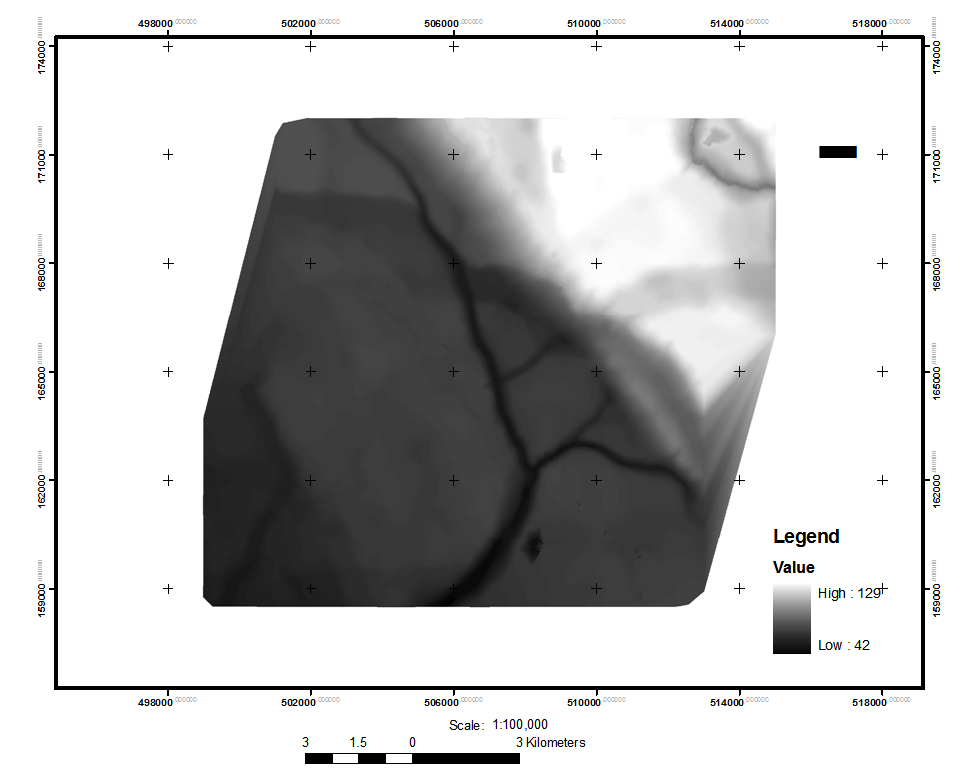 | Figure 3. Map of the Digital Elevation Model DEM of the project |
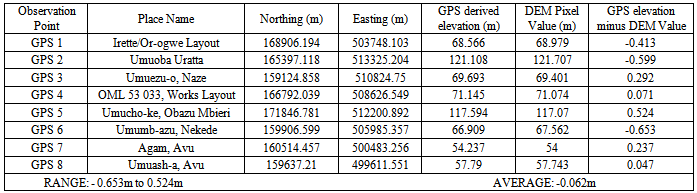
Table 1. Comparison of GPS derived orthometric heights with the corresponding DEM values
 |
| |
|
The DEM values were validated by Global Positioning System (GPS) measurements. Eight points spread out fairly at the corners and the central regions of the project area were coordinated using Trimble 4800 Dual Frequency GPS Receivers. The details are presented in Table 1. The orthometric heights derived from the GPS observations differed from those of their corresponding points extracted from the Digital Elevation Model (DEM) of the project within a range of -0.653m to 0.524m and the average being -0.062m. The result was compared to the reliability of other sources of topographic data such as the Shuttle Radar Topographic Mission (SRTM) DEM and The Advanced Spaceborne Thermal Emission and Reflection Radiometer (ASTER) DEM. "A standard deviation of the heights based on SPOT for flat terrain of 2.97m for open and 3.66m for forest areas, for SRTM X-band 3.97m for open and 4.49m for forest areas, for SRTM C-band. 4.25m for open and 6.14m for forest areas and for ASTER 7.29m for open and 8.08m for forest areas has been achieved" (Sefercik, U., et al, 2007). The DEM created for this project was accepted as good enough for the research.
2.2.3. Processing the DEM to Drainage Line Feature Class
The delineation of sub-catchments began with the delineation of natural drainage or stream routes. A Flow Direction Grid was created from the DEM using ArcHydro extension. The Flow Direction function computed the corresponding flow direction grid from the DEM of the project area. These values held in the cells of this grid indicate the direction of the steepest descent from that cell as is illustrated in Figure 4.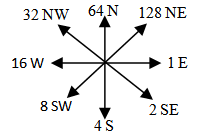 | Figure 4. The Flow Direction Grid Numbering Scheme |
From the Flow Direction Grid the Flow Accumulation grid was derived by calculating how many cells of the Flow direction grid would empty their runoff content into the cell of interest. The number of cells upstream that drain their runoff into a cell of interest is the value of that cell in the flow accumulation grid.The processing of the flow accumulation grid is illustrated in Figure 5. The resulting Flow Accumulation Grid, was coded from 0 to 28894 the lowest and highest cell unit accumulation of flow in the scheme.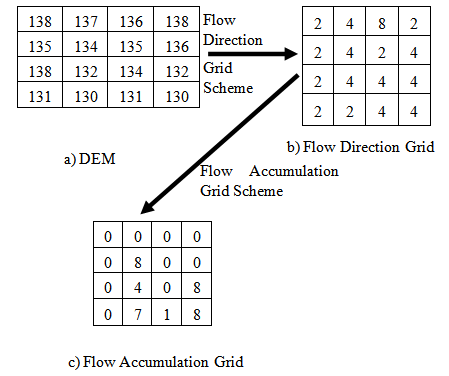 | Figure 5. Flow Accumulation Grid Scheme |
When the Flow Accumulation Grid was derived, the Stream Definition Grid was computed from it. A threshold of what volume of flow (number of accumulating cells) defines a stream in the project was set. The idea here is that the grid cells that accumulate runoff from a set minimum number of cells are considered to be the stream (drainage route) cells. Setting the threshold requires some fair knowledge of the project area so that the operator will be able to ascertain when a chosen threshold defines true streams. All cells in the Flow Accumulation Grid that have values up to or more than the stream definition threshold were marked with the value of “1” in the resulting Stream Definition Grid. The rest of the cells in the Stream Definition Grid contain no data. Figure 6b illustrates the resulting Stream Definition Grid from the Flow Accumulation Grid (Figure 6a) where the definition threshold is set at 3. The stream definition threshold for this project was set to 140, approximately 0.5% of the total number of cells (28894) of the project area.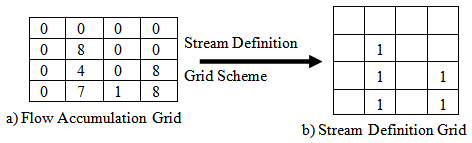 | Figure 6. Stream Definition Grid Scheme illustrated using 3 cell accumulation threshold |
2.2.4. Stream Segmentation and Drainage Line Processing
Stream Segmentation produced the stream link grid of stream segments that have a unique identification from the stream definition grid. A stream segment may either be a head segment, or it may be a segment between two segment junctions of other stream segments. The Drainage Line Processing converted the Stream Link grid into a Drainage Line feature class. The attribute table of this feature class identifies each line in the feature class with its location identifier.
2.2.5. Catchment Grid and Sub-Catchment Delineation
The catchment grid delineation was processed to create a grid in which each cell carried a value called grid code tied to the stream that they flow into. All cells of the same catchment had the same identifier. The Flow Direction Grid and the Stream Link Grid served as the input grids and the delineation produces the Catchment Grid. The catchment polygon was delineated by converting the catchment grid into a catchment polygon feature class. In this process all cells in the grid that had the same grid code were dissolved into a single area, after which the process vectorized the boundary. For more practical purposes such as drainage and flood management uses, some of the catchment polygons so produced may need further collapsing into a polygon since their drainage lines make up a single flow route. This need arises because the automatic method comes from the fact that the catchment polygons so produced were based only on the cells that are in each stream link only. The morphology of the area that accounts for a continuous drainage (stream) flow is the necessary definition of the sub-catchment. The sub-catchments so automatically created were generalized further in order to delineate sub-catchments more accurately defined. The refined sub-catchments were achieved using the Edit mode of the ArcMap. The drainage line map was overlaid with the automatically generated sub-catchment polygons and the digitized contours of the project area. The contour ridges that surround a given route and the polygons draining into the route were marked out. Normally the ridges are on the two sides and on the upstream side of the drainage line. Figure 7 shows the manually generated sub-catchments with the drainage lines highlighted, showing each sub-catchment that drain into each given route, and the drainage lines.
2.2.6. Characterizing of the Sub-Catchments
A good number of the factors that characterize the sub-catchments were automatically derived from the attribute table of the newly created sub-catchment polygons. Such factors include the area of the sub-catchments, and the coordinate of the centroids of each sub-catchment. The area of each sub-catchment was determined automatically by using the calculate geometry feature of the ArcMap. The x and y coordinates of the centroid of the sub-catchments, required in the Storm Water Management Model (SWMM) computations were also determined using the Calculate Geometry feature of the ArcMap. The remotest overland flow distance, L in most drainage design literature, but W in SWMM, was measured using the distance tool of ArcMap. The average slope of each sub-catchment was determined using the contour values in ArcMap to determine the elevation differences and the distance already measured to calculate. The average slope value was given in percentage. All these values were recorded as the characteristics of each of the sub-catchments. The other characteristics required by SWMM to characterize the sub-catchments may be entered during the operations in a descriptive form. Rossman (2009) details the following characteristics for SWMM simulation:"The SWMM user has many options for defining land uses and assigning them to sub-catchment areas. One approach is to assign a mix of land uses for each sub-catchment, which results in all land uses within the sub-catchment having the same pervious and impervious characteristics. Another approach is to create sub-catchments that have a single land use classification along with a distinct set of pervious and impervious characteristics that reflects the classification."
3. Results and Discussion
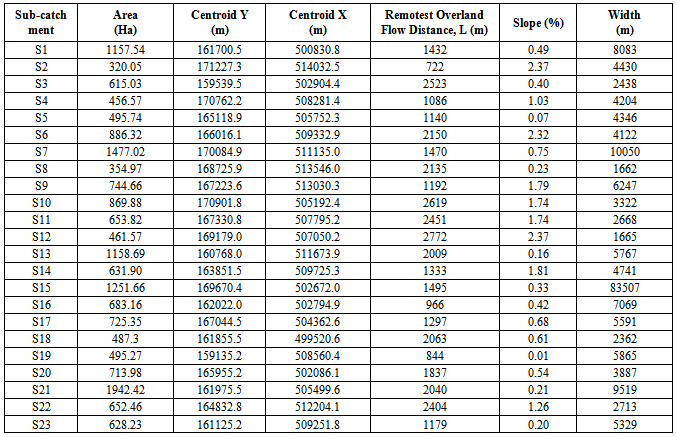
The results of the research are the delineation and characterization of the determined 23 sub-catchments of Owerri. The result of the characterizing is presented in Table II. These are very important tools in flood mitigation, erosion control, urban area planning, urban development monitoring and management, engineering design of drainage facilities, the studies of distribution of water borne diseases, sediment transportation and agriculture. The drainage lines indicate the natural routes through which runoff flow. The sub-catchments are the areas that contribute runoff to the corresponding drainage routes. The sub-catchments here display their serial numbers S1 to S23 and their sizes in hectares. Figure 7 shows the sub-catchments and the drainage route each sub-catchment drains into. The location of the drainage routes were validated by extracting their coordinates and locating the routes on the ground using handheld GPS receivers after heavy rain storms. Two such drainage routes were photographed and presented in Figure 8. 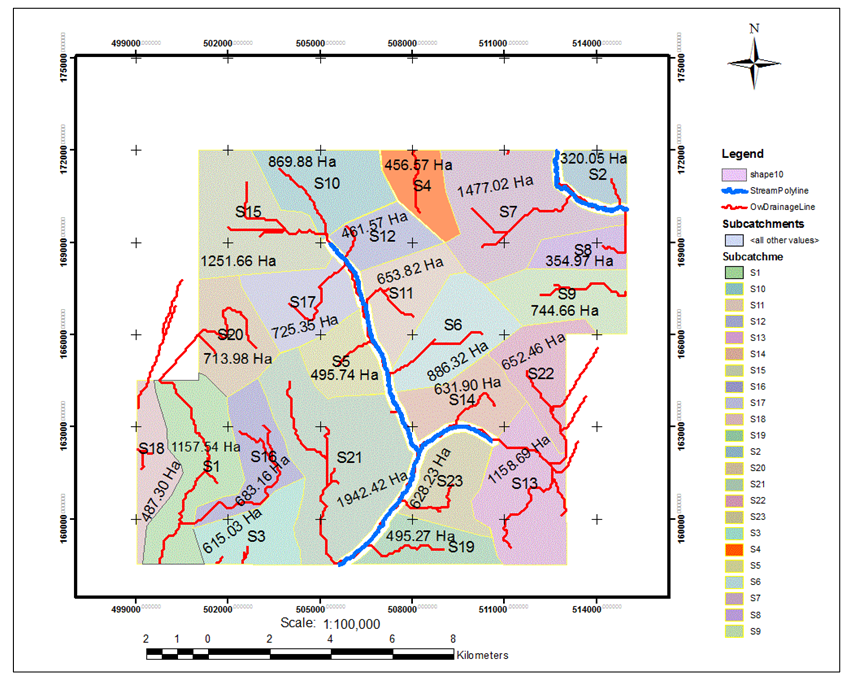 | Figure 7. Map of the manually refined Sub-catchments with the drainage lines |
Table 2. Characterized Sub-catchments of the Project Area
 |
| |
|
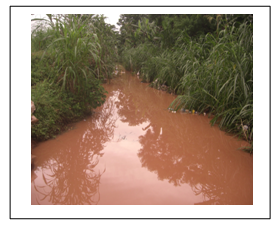 | Figure 8a. Drainage route at Federal Housing Estate Area, off Egbu Road Owerri photographed on 20th July 2012 |
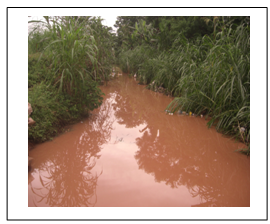 | Figure 8b. Drainage route at Works Layout Area, Owerri photographed on 6th October 2011 |
4. Conclusions
The research reported in this paper has demonstrated today the possibility of delineating and characterizing sub-catchments on a GIS Platform which is of great importance today given the continuing menace of flooding across the globe. The delineating and characterizing of sub-catchments relied completely on the use of topographical data from topographical maps of the city. The maps used here are products of Aerial Photogrammetry campaigns of Owerri. The contours of those maps were digitized and converted to Raster data in the form of a Digital Elevation Model (DEM) in ArcMap, The delineation of the drainage lines and the sub-catchments that drain into them were processed using ArcHydro which runs on ArcMap. The characteristics required as input data in the Storm Water Management Model (SWMM 5.0) of the Environmental Protection Agency of the United States of America for the sub-catchments were automatically extracted or further computed to characterize the sub-catchments of Owerri.The significance of this study is obvious in making flood mitigation decisions of Owerri by the government and policy makers. The determined sub-catchment characteristics are useful in designing primary drainage routes so that plans for runoff capture for all the intended urban area are reliable. The results of this research recommend itself also in the area of studying and curbing water borne diseases as the overland water flow of each cell of the project area is fully determined in space and time.
References
| [1] | Abdoulaye Dieye, “Overview of the flood Situation in West Africa in 2010: the role of Spatial Information Management” The UN-SPIDER SpaceAid Framework, 2010, Online Available: http://www.un-spider.org/book/export/html/5088 |
| [2] | Maria Luisa Paracchini., Jürgen Vogt, Pierre Soille, Alfred de Jager, Roberto Colombo, “Development of a pan-European database of rivers and catchments: a GIS application in support to European water monitoring activities” Joint Research Centre European Commission. 2013. Online Available:http://www.proland.iung.pulawy.pl/materials/wp1/paracchini.pdf |
| [3] | Bertolo, Fransesca., “Catchment delineation and characterization” EC-JRC, (EUR 19563 EN). Space Applications Institute, Joint Research Center, European Commission, Ispra (VA), Italy, 2000. Online Available: http://agrienv.jrc.it/publications/pdfs/CatchRev.pdf |
| [4] | David. R Maidment, Ed., Arc Hydro GIS for Water Resources, ESRI Press, California, U.S.A. 2002. |
| [5] | Geodetic Surveys Ltd., Owerri Nucleus Sheet Map series. Government of Imo State, Nigeria, 1977. |
| [6] | Ian D. Moore, Rodger B. Grayson, “Terrain-based catchment partitioning and runoff prediction using vector elevation data.” Water Resources Research, vol. 27, no. 6, pp. 1177-1191, 1991. |
| [7] | Norman L. Jones, Stephen G. Wright, David R., “Watershed delineation with triangle-based terrain models”, Journal of Hydraulic engineering, Vol. 116, pp.1232-1251. 1990. |
| [8] | Palacios-Velez, O.L., Cuevaz-Renaud, B., “Automated River Course, Ridge and Basin Delineation from Digital Elevation Data”. Journal of Hydrology, vol. 28, pp. 299-314, 1981. |
| [9] | Sabbagh, G. J., Storm, D.R., Haan, C.T., , “Digital terrain model to estimate watershed characteristics for hydrology and water quality modeling” Proc of American Soceity of Agricultural Engineers Summer Meeting,, Kansas City, Missouri U.S.A. 1994, pp. Paper No. 94-2034. |
| [10] | Lo, C. P., Yeung, A.K.W., Concepts and Techniques of Geographic Information Systems, Prentice Hall, Inc., New Jersey, 2002. |
| [11] | David M. Mark, “Automated detection of drainage networks from digital elevation models”. Cartographica: The International Journal for Geographic Information and Geovisualization, vol. 21, no. 2&3 pp. 168–178, 1984. |
| [12] | Jorge Gironás, Larry A. Roesner, Jennifer Davis, Storm Water Management Applications Manual.EPA/600/R-09/077. U.S. Environmental Protection Agency. U.S.A., 2009. |
| [13] | Sefercik, U., Jacobsen, K., Oruc, M., Marangoz, A., , “Comparison of SPOT, SRTM, and ASTER DEMs” Proc. International Society of Photogrammetry and Remote Sensing XXXVI-1/W51. 2007, Online Available: http://www.isprs.org/proceedings/XXXVI/1-W51/paper/Sefercik_jac_oruc_maramgoz.pdf. |
| [14] | Lewis A. Rossman, Storm Water Management Model User’s Manual. EPA/600/R-05/040. United States Environmental Protection Agency. Cincinnati, Ohio. U.S.A., 2009. |
 Abstract
 Reference
 Full-Text PDF
 Full-text HTML