American Journal of Geographic Information System

p-ISSN: 2163-1131    e-ISSN: 2163-114X

2013;  2(3): 27-36

doi:10.5923/j.ajgis.20130203.01

Applications of Remote Sensing Techniques and GIS for Urban Land Change Studies in Mongolia

D. Amarsaikhan1, Ts. Bat-Erdene2, J. Janzen3, Ch. Narantsetseg4, M. Ganzorig1, B. Nergui1

1Institute of Informatics, Mongolian Academy of Sciences, av.Enkhtaivan-54B, Ulaanbaatar-51, Mongolia

2Department of Geography and Tourism, Mongolian State University of Education, Ulaanbaatar-46, Mongolia

3Institute for Geographische Wissenschaften, Freie Universität Berlin, Malteser Strasse 74-100, D-12249 Berlin, Germany

4School of Geography and Geology, National University of Mongolia, Ikh Surguuliin gudamj-6, Ulaanbaatar-46, Mongolia

Correspondence to: Ts. Bat-Erdene, Department of Geography and Tourism, Mongolian State University of Education, Ulaanbaatar-46, Mongolia.

Email:

Copyright © 2012 Scientific & Academic Publishing. All Rights Reserved.

Abstract

The aim of this study is to compare the changes that occurred in the main urban land cover classes of Ulaanbaatar, the capital city of Mongolia during centralized economy (i.e. 1969-1990) with the changes occurred during market-based economy (i.e. 1990-2011) and describe the socio-economic reasons for the changes. For the analysis, multitemporal high resolution optical and microwave remote sensing (RS) images as well as geographical information system (GIS) and census data sets are used. To extract the reliable urban land cover information from the available RS data sets, a refined maximum likelihood classification (MLC) algorithm that uses spatial thresholds defined from the contextual knowledge is constructed. Before applying the classification decision rule, some ordinary and advanced image fusion techniques are applied to the selected RS data sets, in order to define the most efficient fusion method that can create the best color image to be used for training sample selection as well as for defining the contextual knowledge. Overall, the analysis indicates that during the periods of both centralized and market-based economies the most significant change occurs in the ger area of Ulaanbaatar city and the main reason for this is the growing population and shortage of modern accommodation.

Keywords: Urban Land Cover, Change Analysis, RS, GIS, Classification

Cite this paper: D. Amarsaikhan, Ts. Bat-Erdene, J. Janzen, Ch. Narantsetseg, M. Ganzorig, B. Nergui, Applications of Remote Sensing Techniques and GIS for Urban Land Change Studies in Mongolia, American Journal of Geographic Information System, Vol. 2 No. 3, 2013, pp. 27-36. doi: 10.5923/j.ajgis.20130203.01.

1. Introduction

At present, because of the rapid increase in world population and the irreversible flow of people from rural to urban areas, the urbanization and urban sprawl have become the common problem of governments and decision-makers in both developed and developing countries[1]. As it is known, the developed countries have a higher percentage of urban inhabitants than the developing countries. However, rapid urbanization process is mainly occurring in less developed countries, and it is expected that in future most urban expansions will occur in the developing world. Mongolia, as many other developing countries, has problems with the urban expansion and the growth of population in the main cities. For example, within the last two decades, Ulaanbaatar, the capital city of Mongolia has been significantly expanded due to mainly enormous migration of people from rural areas as well as some development activities[2].
To prevent from the rapid urban expansion, especially from the unplanned urbanization process, urban planners and decision-makers need to regularly evaluate the current development procedures using updated urban planning maps. However, many city planners in developing countries have a lack of the updated maps and often they posses old data which is not relevant for current decision-making[3,4]. One of the possible solutions could be the use of space images, because present satellite RS has the huge potential of providing accurate spatial information over a large area in a short time sequence. Also, it has been broadly recognized as a powerful tool for detecting the land use and cover changes [5-9]. Over the last years, the costs for the primary satellite data sets have considerably decreased. Meanwhile, massive archive of high resolution RS images with acceptable resolution has been available free of charge in different Internet sites. It means that it is possible to extract from RS images, different thematic information in a cost effective way and use it for different urban related studies.
As it is known from a city planning record of Mongolia, much of its urban growth has taken place since the middle of 1970s, because, at that time, the government encouraged migration to urban areas, specifically to Ulaanbaatar. Although, this encouragement was based on the belief to increase the industrialization and productivity, the government made a strict control over migration, and only those who found jobs could move to Ulaanbaatar city. To accommodate the growing population in the capital city, the government mainly constructed high-rise apartment blocks. However, the number of apartments fell well short of satisfying the demands of the growing population. Therefore, when rural people migrated to Ulaanbaatar, set up gers (Mongolian national dwellings) for their accommodation. The rapid political changes of 1990 marked the beginning of Mongolia's efforts to develop market economy. It started to change the lives in the society very rapidly and the government stopped controlling of many things[10]. For the isolated rural people, it had become very difficult to reach the central market. Meanwhile, many things started to centralize in the capital city and Ulaanbaatar had become a dream location for many rural people. Therefore, many rural families moved officially and unofficially to Ulaanbaatar. As a result, the population of Ulaanbaatar increased significantly and the city area expanded drastically.
Generally, it should be interesting to study the urban growth in Ulaanbaatar city comparing the growth thatoccurred during the main industrialization period (1969–1990) when Mongolia had a centralized (i.e., socialist) economy to the changes that occurred during the market economy. The previous study, conducted by Amarsaikhan et al.[4] compared the changes occurred in the main land cover classes of selected part of the capital city during centralized economy with the changes occurred during a certain period of market economy (i.e., in between 1990 and 2001) using multitemporal optical images. In the present study, the changes that occurred in Ulaanbaatar between 1969 and 1990 have been compared with the changes that occurred between 1990 and 2011 using historical GIS data as well as multisource RS images, and the socio-economic reasons for the changes were described. Such comparisons could be helpful for the planners to consider directions of the urbanization process in the city.
To extract the reliable urban land cover information from the selected RS data sets, a refined MLC algorithm that uses spatial thresholds defined from the contextual knowledge was used. Before applying the classification decision rule, some some ordinary and advanced image fusion techniques such as multiplicative method, intensity–hue–saturation(IHS) transformation, Brovey transform, principal component analysis (PCA), wavelet-based fusion and Ehlers fusion were applied to the selected RS data sets, in order to define the most efficient fusion method that creates the best color image used for training sample selection as well as for defining the contextual knowledge.

2. Test Site and Data Sources

As a test site, Ulaanbaatar, the capital city of Mongolia has been selected. Ulaanbaatar is situated in the central part of Mongolia, in the Tuul River valley, at an average height of 1350m above sea level. By 2011 statistics, population of the city was counted at about 1,250,000 inhabitants[11]. Today’s Ulaanbaatar is the main political, economic, business, scientific and cultural center of the country. In addition, the city is home to the central government and its bureaucratic structure, and the most prominent public and private institutions of higher learning and best medical services.
The study area chosen for the present study covers an area of 28kmx20km. It covers the majority of the area belonging to the capital city, although there are some areas extending outside of the selected image frame. For the selected area, it is possible to define such classes as built-up area, ger area (Mongolian traditional dwelling), forest, grass, soil and water. The built-up area includes buildings of different sizes, while ger area includes mainly gers surrounded by fences.
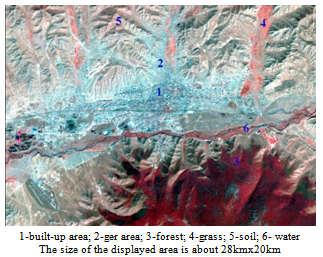
Figure 1. 2011 Landsat TM image of the selected part of Ulaanbaatar city
As the data sources, Landsat TM data of 10 September 1990 with a spatial resolution of 30m, SPOT PAN data of 28 May 1990 with a spatial resolution of 10m, Landsat TM data of 20 September 2011 with a spatial resolution of 30m, and Envisat C-band HH polarization synthetic aperture radar (SAR) image of 17 May 2011 with a spatial resolution of 25m were used. In addition, topographic maps of 1969 and 1984, scale 1:50 000, and a general urban planning map were available. Figure 1 shows recent outlook of the test area in the Landsat TM image and some examples of its land cover.

3. Radiometric Correction and Georeferencing of the RS Images

At the beginning, all the available images were thoroughly analyzed in terms of radiometric quality and geometric distortion. For the SPOT PAN data of 1990 some line dropouts occurred and for the correction, averaging of the upper and lower lines of the lines that had to be corrected was applied. In case of the multispectral images, band 1 (i.e., blue band) of both Landsat TM data had noise from the atmosphere and it was difficult to correlate their radiometric values with other bands. Therefore, they were excluded from the analysis. Moreover, as band 6 of TM and bands 61 and 62 of ETM are thermal bands, they were excluded from the further analysis, too.
In case of the SAR images, as they have a speckled appearance, radiometric correction should be based on the speckle reduction techniques. In this study, four different speckle suppression techniques such as local region, lee-sigma, frost and gammamap filters[12] of 3x3 and 5x5 sizes were compared in terms of delineation of urban features and texture information. After visual inspection of each image, it was found that the 3x3 gammamap filter created the best images in terms of delineation of different features as well as preserving content of texture information. In the output image, the speckle noise was reduced with very low degradation of the textural information.
In order to merge data sets with different spatial resolutions, a high geometric accuracy and good geometric correlation between the data sets are needed. Initially, the SPOT PAN image and Landsat TM data of 1990 were georeferenced to a UTM map projection using a topographic map of 1984, scale 1:50 000. The ground control points(GCP) have been selected on well defined cross sections of roads, streets and other clearly defined sites. In total, 16 more regularly distributed points were selected. For the transformation, a second order transformation and nearest neighbour resampling approach have been applied. The root mean square (RMS) errors were 0.98 pixel and 0.83 pixel for the SPOT and Landsat images, accordingly. Then, the Landsat TM data and Envisat image of 2011 were georeferenced to a UTM map projection using the same topographic map of 1984. The transformations were conducted by the use of a second order transformation and nearest neighbour resampling approach and 18 more regularly distributed GCPs were selected. The RMS errors were 0.71 pixel and 1.09 pixel for the Landsat and Envisat images, respectively. In all cases, an image was resampled to a pixel resolution of 18m.

4. Image Fusion

In the present study, the selected test site represents complex urban environment. In the area, the three main classes such as building area, ger area and soil have similar or mixed spectral characteristics. Therefore, in order to enhance the spectral and spatial variations of these statistically overlapping classes as well as to merge the images with different spatial resolutions, different image fusion techniques have been compared. Within the framework of the study, it was decided that the fused image should be used for determining the sites for the training sample selection and also for defining the contextual knowledge about the classes of objects.
The image fusion is a process, which integrates different images from diverse sources to obtain more information, considering a minimum loss or distortion of the original data. In the case of the present study, for the urban areas, the optical images provide the information about the spectral variations of different urban features, while the radar image provides structural information about buildings and street alignment due to the double bounce effect. Over the years, different data fusion techniques have been developed and applied, individually and in combination, providing users and decision-makers with various levels of information. Generally, image fusion can be performed at pixel, feature and decision levels[4,13].
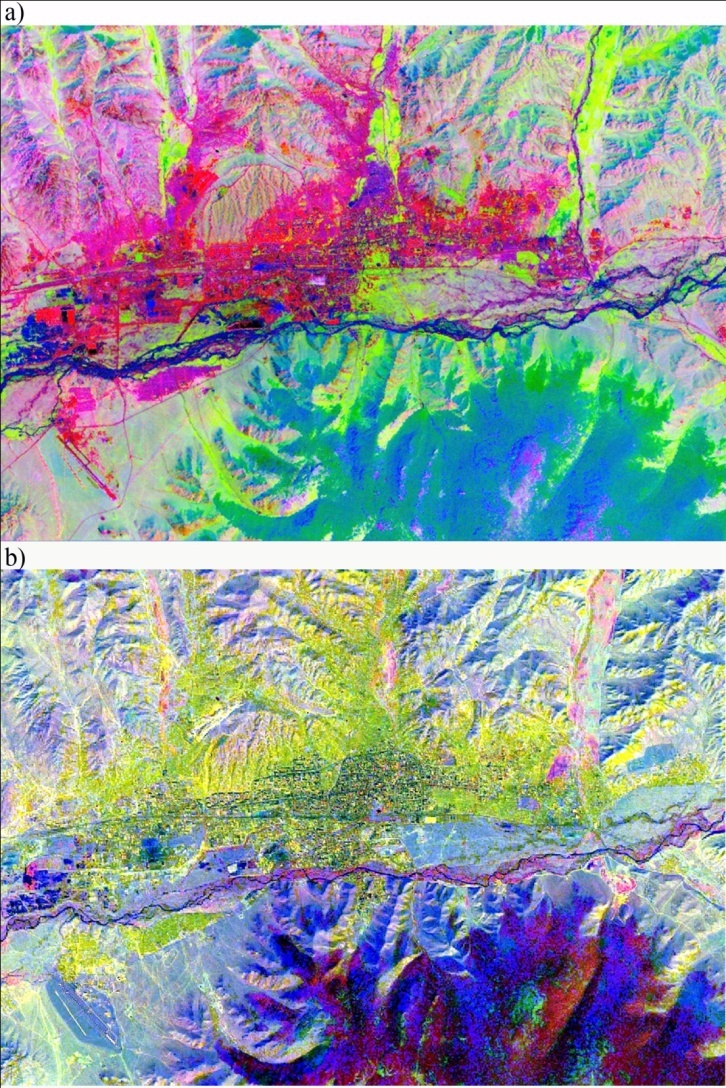
Figure 2. Comparison of the images obtained by the PCA applied to 1990 data sets (a) and wavelet-based fusion applied to 2011 data sets (b)
In this study, data fusion has been performed at a pixel level and such techniques as multiplicative method, IHS transformation, Brovey transform, PCA, wavelet-based fusion and Ehlers fusion, were compared. Detailed descriptions of these methods are given in Vrabel[14], Pajares and Cruz[15], Seetha et al.[16], Ehlers et al.[17], Mather and Koh[18]. As there are optical and microwave data sets, a fusion approach requires certain strategy, because some of these techniques are appropriate to apply to multisource images. Therefore, the first 4 methods were applied to the data sets of 1990, while the last 4 methods were applied to the data sets of 2011.
In order to obtain a reliable color image that can illustrate the spectral and spatial variations of the available urban classes, different band combinations have been used. In case of the 1990 data sets, the Brovey transformed image illustrated good color separation among the selected classes, while on the images created by the multiplicative and IHS methods, it was very difficult to distinguish between some ger areas and soil class. The PC image demonstrated a better result than any other methods, because it illustrated good color as well as spatial separations among the available urban classes. Therefore, this result was selected for determining the sites for the training sample selection as well as for defining the contextual knowledge about the classes of objects in the 1990 data sets.
In case of the 2011 data sets, the worst result was obtained by the use of the Ehlers fusion, because the fused image could not distinguish among statistically overlapping classes at all. The Brovey transformed image was better than the image obtained by the Ehlers fusion, but on the image it was not easy to differentiate between builtup area and ger area. The PCA gave a better result than the results of the Brovey transform and multiplicative method. The PC image could distinguish between builtup area and ger area as well as between ger area and soil. However, unlike the result of the wavelet-based fusion, it was very difficult to observe the spread of the ger districts in urban fringes. Compared to all other results, the wavelet-based fusion gave the best result. On this image, it was possible to distinguish among all statistically overlapping classes and also observe the spread of the ger districts. Therefore, this image was selected for further analysis. Figure 2 shows the comparison of the results obtained by the PCA applied to 1990 data sets and wavelet-based fusion applied to 2011 images.

5. Classification of the Images

For several decades, single-source multispectral RS data sets have been successfully used for land cover mapping and for the generation of thematic information, diverse supervised and unsupervised classification methods have been applied. Unlike single-source images, data sets from multiple sources have proved to offer better potential for discriminating between different land cover types. Many authors have assessed the potential of multisource images for the classification of different land cover classes[19-21]. At present, the most commonly used RS data classification techniques are parametric and non-parametric methods, Dempster–Shafer theory of evidence, neural networks, decision tree classifier, and knowledge-based methods [22-24].
In recent years, rapid and timely mapping of urban areas, specifically at regional and global scales has become an important task for many urban planners. This is associated with the rapid urbanization process, because the planners and decision-makers need to evaluation the relatedenvironmental and social problems[25]. However, in most cases urban areas are complex and diverse in nature and many features have similar spectral characteristics and it is not easy to separate them by the use of common feature combinations or by applying ordinary techniques[26]. For the successful extraction of the urban land cover classes, reliable features and an efficient classification technique should be used. In the present study, for the classification of urban land cover types, a refined statistical MLC algorithm has been constructed. The method can be successfully used for separation of classes in both single-source and multisource images.

5.1. The Selected Features and Evaluation of the Training Signatures

Generally, in the classification process, it is desirable to include only the features in which the signatures of the selected classes are highly separable from each other in a multidimensional feature space. In case of the present study, as the features, the first three PCs defined from RS data sets of 1990 and the first four PCs defined from data sets of 2011 have been selected because, they contained more than 98% of the total variance.
In the current study, to define the sites for the training signature selection, a similar approach applied in Amarsaikhan et al.[4] has been used. Initially, from the multitemporal PC images, several areas of interest (AOI) have been selected for each available class (i.e., building area, ger area, forest, grass land, soil and water) using the contextual knowledge. The contextual knowledge was defined on the basis of the spectral variations of the land surface features as well as the texture information delineated on the fused images. The separability of the selected training signatures was firstly checked in feature space and then evaluated using Jeffries–Matusita distance[12] and it revealed that high statistical overlaps exist between the classes: building area and ger area. It is obvious, because ger families usually have houses beside their gers. Therefore, these two classes have very similar spectral characteristics. Then, the samples which demonstrated the best possible separability were chosen to form the final signatures. The final signatures included about 126-498 pixels.

5.2. The Refined MLC Method

The MLC is the most widely used classification technique, because a pixel classified by this method has the maximum probability of correct assignment[27]. The decision rule assuming Bayes' rule can be written as follows:
(1)
where P(Ci|x)-posterior probability, P(x|Ci)-conditional probability, P(Ci)-prior probability, P(x)-probability of finding a pixel from any class. The actual classification is performed according to P(Ci|x) > P(Cj|x) for all j#i.
Within the framework of this study, for all classes equal prior probabilities have been assigned. To conduct a classification decision rule, for each class label a conditional probability that is approximated by a multivariate probability density function, should be evaluated. For this purpose, the sample mean vectors, determinants and variance-covariance matrices for each class are estimated from the selected training signatures. Then, every pixel in the digital image is evaluated using the maximum likelihood and the class label is assigned to the pixel that has the maximum probability.
At the beginning, in order to check the performance of the standard method, the selected PC bands (i.e. PC1, PC2 and PC3 for 1990 data sets, PC1, PC2, PC3 and PC4 for 2011 data sets) were classified using the statistical MLC. As could be seen from the results, on the classified images there were different mixed classes between the classes: building area and ger area. This should be apparent, because the previous signature analysis indicated that the signature distributions of these classes had significant overlaps in the multidimensional feature space. To separate the statistically mixed classes, the class specific features as well as spatial thresholds can be applied. The class specific features can be determined through a feature extraction process, however, the application of this approach would become difficult if there is a fewer number of bands. The spatial thresholds can be determined on the basis of historical thematic spatial data sets or from knowledge about the site. In the case of digital image analysis, it can be defined from polygon boundaries stored in a GIS layer.
In order to improve the traditional MLC, the constructed classification algorithm uses spatial thresholds defined from the contextual knowledge. The contextual knowledge is based on the spectral and textural variations of the selected classes in different parts of the selected fused images and the thresholds are applied to separate the statistically overlapping classes. It is obvious that a spectral classifier will be ineffective if applied to the statistically overlapping urban classes, because they have very similar spectral characteristics. For such spectrally mixed classes, classification accuracies should be improved if spatial properties of the classes of objects could be incorporated into the classification criteria. To determine the initial spatial thresholds, firstly the appropriate polygon boundaries related to the selected classes were defined from the historical GIS data sets. As these polygon boundaries represented old information, it was necessary to update them. For this purpose, new polygon boundaries were defined from the fused images (i.e. PC and wavelet-based) on the basis of the contextual knowledge (i.e., defining class boundaries in relation to its neighbourhood) and added to the initial spatial thresholds.
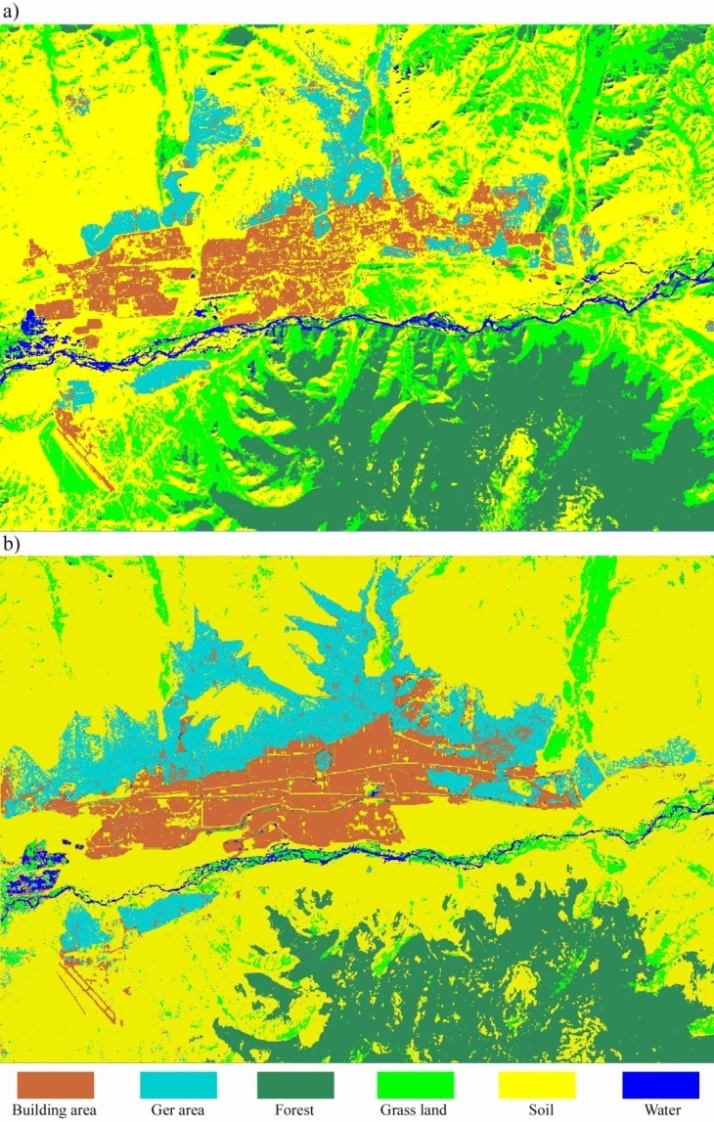
When thresholds apply only the pixels falling within the threshold boundary are used for the classification. In that case, the likelihood of the pixels to be correctly classified will significantly increase, because the pixels belonging to the class that overlaps with the class to be classified using the threshold boundary are temporarily excluded from the decision making process. In such a way, the image can be classified several times using different threshold boundaries and the results can be merged[26]. The results of the classifications using the defined spatial thresholds are shown in figure 3a,b.
For the accuracy assessment of the classification results, the overall performance has been used. This approach creates a confusion matrix in which the selected reference pixels are compared with the classes in the classified image and as a result, an accuracy report is generated indicating the percentages of the correspondence[12]. In this study, as ground truth information, different AOIs containing the purest pixels (i.e., 8275 pixels for 1990 image and 8298 pixels for 2011 image) have been selected. The confusion matrices produced for the refined MLC classification method indicated overall accuracy of 91.98% for the 1990 data sets, while for the 2011 data sets it was 93.12%.
Figure 3. Comparison of the classification results for the selected classes. (a) Classified image using 1990 data sets, (b) Classified image using 2011 data sets
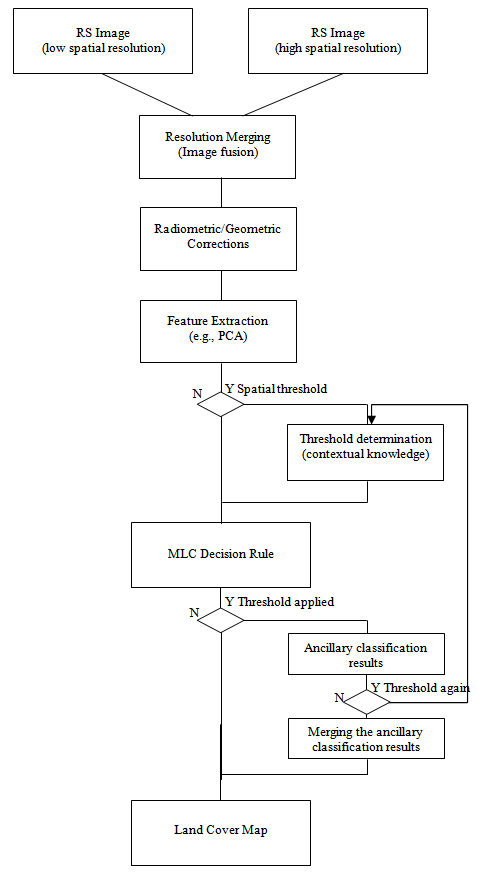
As the classification accuracies exceed 90%, these results can be firmly used for further analysis or update of a land cover layer within a GIS. A flowchart for the constructed refined MLC method is shown is figure 4.
Figure 4. A general diagram for the refined parametric classification

6. Urban Land Cover Change Analysis

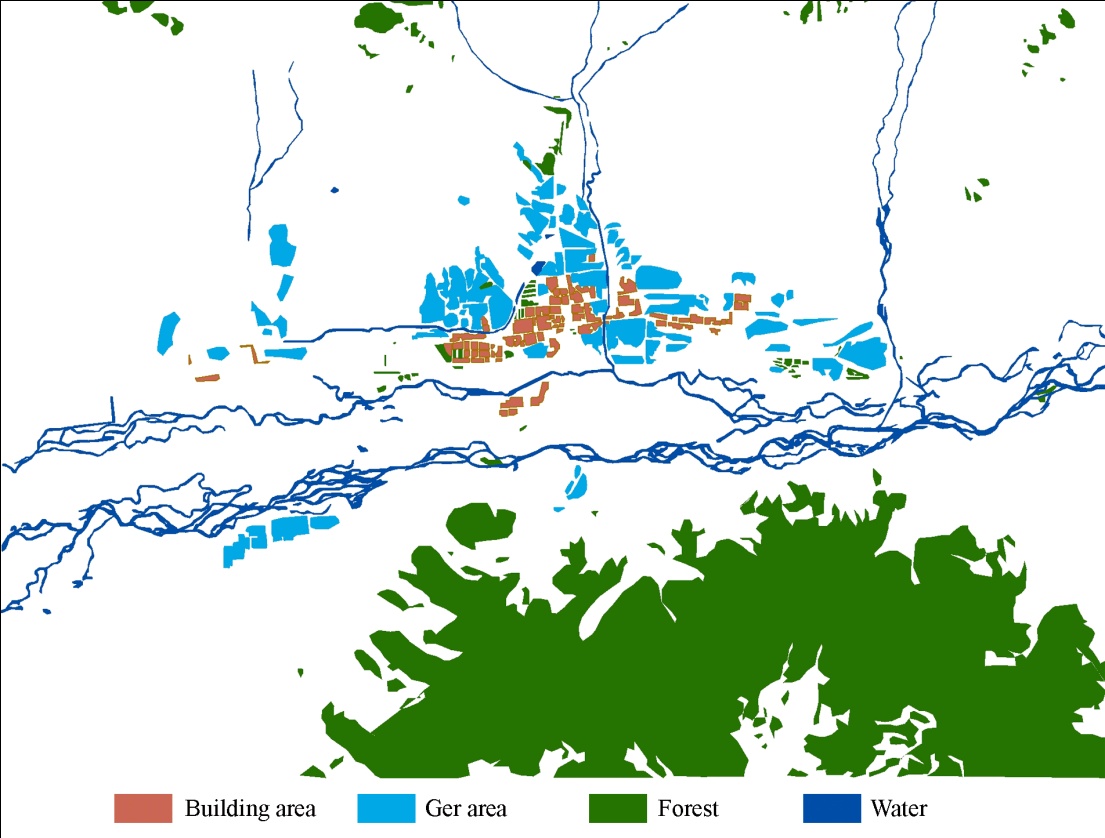
Figure 5. Digitized topographic map of Ulaanbaatar area of 1969, scale 1:50 000
The present study aimed to compare the general changes occurred in the main land cover classes (i.e., building area, ger area, forest, grass land, soil and water) of Ulaanbaatar area during the centralized economy (i.e., in between 1969 and 1990) with the changes occurred during a market economy (i.e., in between 1990 and 2011) using multitemporal RS and GIS data sets, and explain the socio-economic reasons for the changes.
Initially, to create the primary historical GIS data, the classes: building area, ger area, forest and water were digitized in a UTM map projection from a topographic map of 1969, scale 1:50 000 using ArcGIS (figure 5). On this topographic map, the areas related to the grassland were not delineated. Therefore, it was not possible to distinguish between the areas covered by grass and soil classes. The apartments, residential houses, industrial buildings and all other building areas were included in the building area class, because on the selected satellite images it was not possible to distinguish among these classes, due to their very similar spectral characteristics. However, using ground truth data and knowledge about some local areas one can observe that the main industrial areas are mainly distributed in the southern part of the city and some are located in the western part.
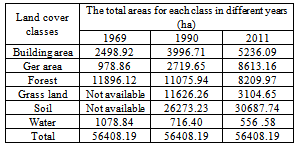
To define the total area of each class expressed in hectares (ha) from the classified PC images, the number of pixels falling into each of the classes has been calculated. Then, the defined number of pixels was multiplied by the area that each pixel covered. To conduct the same calculation on the digitized vector map, the areas of the classes have been automatically calculated using ArcGIS. The total areas related to each class defined from the classified multitemporal RS images as well as digitized map are shown in table 1. Although, we have census data of Ulaanbaatar city, it is not possible to directly relate it to the current analysis, because our study area does not cover all the areas from where the final census data is collected. However, as the test area covers the majority of the area belonging to the capital city, it is possible to use the census data for a comparison of the general population increase with the actual urban expansion process.
Table 1. The total areas for each class in different years, evaluated from multitemporal GIS and RS data sets
     
As seen from table 1, in 1969 in Ulaanbaatar city, the building area and ger area covered 2498.92ha and 978.86ha, respectively, whereas in 1990 these two urban classes covered 3996.71ha and 2719.65ha, respectively. Moreover, it is seen that the forest and water resources had been reduced. The available census data indicated that in 1969 the population of the capital city was 267 400, while in 1990 it had become 574 900. As seen, within the 21 year period of the centralized economy, the building areas were increased by only 59.94%, whereas the ger areas were increased by more than two-fold. Meanwhile, the population increased by more than 2 times[4]. These changes are related with the following:
1) As a result of the industrialization process, many people came from different parts of the country, specifically from rural sites seeking better lives and jobs. This resulted in a mechanic increase of urban population as well as city areas.
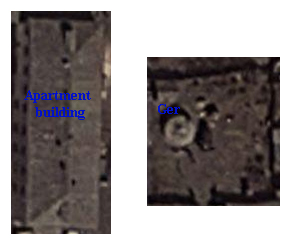
2) When the industrialization process was in its high, the government constructed mostly high-rise apartment blocks with many stories to accommodate the growing population. These residential blocks, although they could house the families of many ger districts, occupied much smaller space than the ger parcels. For example, one apartment block with five stories which could accommodate 60 families occupied just about 1000m2, while one family living in a ger district occupied usually 600m2-800m2, because the gers in urban areas are surrounded by fences. The comparison of a single high-rise apartment building and a ger family can be clearly seen on a modern day very high resolution RS image and it is illustrated on a Quickbird image of 2011 (Figure 6).
Figure 6. Comparison of the areas covered by a single high-rise apartment building and a ger family (Quickbird image of 2011)
3) During the centralized economy, many people came from rural sites with their gers to the city and used them as dwelling houses. Moreover, the graduates from higher and other educational institutions located in Ulaanbaatar city who could not get apartments usually setup the gers for their living. Although, the government constructed high-rise apartment blocks, they could not satisfy the growing demands of the increasing population. Therefore, the ger districts underwent this significant expansion.
Furthermore, as seen from table 1, within the 21 year period since the country entered the market economy, the building areas were increased by 31%, while the ger areas were increased by more than three fold. Meanwhile, forest, grass land and water resources had been reduced, expanding the areas of bare soil. The previous study, conducted by Amarsaikhan et al.[4] had found that within an 11 year period of a market economy, in the Ulaanbaatar city the building area and ger area had been increased by 20.41% and 58.26%, respectively. However, the current study has revealed that over recent years, the ger areas in the capital city have been significantly expanded, specifically in the urban fringes. The reasons for these changes are:
1) Since the country entered the market economy, rural people started to face the diminished and worsened social, cultural and health services. Therefore, they started to move to the capital city which had more improved services in all aspects.
2) At present, in Mongolia there are far more than 100 higher educational institutions having total of about 170,000 students. Most of these educational institutions are concentrated in Ulaanbaatar and many students from rural areas come to study here. However, many rural families having one or few children come to the capital city when their child becomes a student and they do not go back.
3) During the market economy many people preferred to move to the areas with good communication and infrastructures, thus increasing the population. For example, census data indicated that in 2011, the population of the capital city had reached 1,250,000.
4) Since the country entered the market economy, the government has not constructed new residential apartments. The apartment prices of the existing construction companies are very high, so, most people cannot afford them. Therefore, most people moving to Ulaanbaatar built up their gers surrounded by fences, thus significantly expanding ger districts.
5) During the market economy, many people constructed western cottage style houses or buildings with few stories for their living, although some construction companies also built up some high-rise apartment blocks. Therefore, both types of buildings also contributed to the expansion of the city areas.
6) The new land law issued in 2002[28] gave distinct rights to land owners and they can use their land for receiving bank loans and for other economic and development related purposes. Therefore, the interests of people to own land parcels have greatly increased, meanwhile drastically increasing the land prices.

7. Conclusions

The overall purpose of the research was to compare the changes that occurred in the main urban land cover classes of the Mongolian capital city during a centralized economy with the changes occurred during a market economy and describe the socio-economic reasons for the changes. For this aim, multitemporal high resolution optical and microwave RS images as well as GIS and census data were used.
To extract the reliable urban land cover information from the selected multisource RS data sets, a refined maximum likelihood classifier that uses spatial thresholds defined from the contextual knowledge was constructed. Before applying the classification decision rule, some ordinary and advanced image fusion techniques were explored in order to define the most efficient fusion method that could create the best color image used for training sample selection as well as for defining the contextual knowledge. It was seen from the classification results that the spatial thresholds defined from the contextual knowledge could considerably improve the performance of the classification and for the accurate classification, proper spatial thresholds should be applied.
As could be seen from the urban land cover change analysis, during the periods of both centralized and market-based economies significant changes occurred in the ger area of the city and ger districts mainly extended in northern and eastern parts of the Ulaanbaatar city. Moreover, as seen from the analysis, during all this time, the natural resources such as forest and water had been reduced. Furthermore, it was seen that a spatial resolution of the used RS data sets allowed to conduct the analysis at a regional scale and the results could be useful for the planners and decision-makers to consider directions of the urbanization process in the capital city.

References

[1]  Amarsaikhan, D., Ganzorig, M., Ache, P. and Blotevogel, H., 2007, The integrated use of optical and InSAR data for urban land cover mapping, International Journal of Remote Sensing, Vol.28, No.6, pp.1161-1171.
[2]  Amarsaikhan, D., Chinbat, B., Ganzorig, M., Battsengel, V., Bulgan, G., Nergui, B., Egshiglen, E. and Gantuya, R., 2011, Applications of RS and GIS for urban land use change study in Ulaanbaatar city, Mongolia, Journal of Geography and Regional Planning, Vol.4(8), pp.471-481.
[3]  Amarsaikhan, D. Ganzorig, M. and Saandar, M., 2001, Urban Change Study Using RS and GIS, Asian Journal of Geoinformatics, No2, Vol2. pp.73-79.
[4]  Amarsaikhan, D., Blotevogel, H.H., Ganzorig, M. and Moon, T.H, 2009, Applications of remote sensing and geographic information systems for urban land-cover changes studies in Mongolia, Geocarto-International, A Multi-Disciplinary Journal of Remote Sensing and GIS, Vol. 24, No. 4, August 2009, pp.257–271.
[5]  Welch, R., Remillard, M. and Slack, R.B., 1998, Remote sensing and geographic information system techniques for aquatic resource evaluation. Photogrammetric Engineering and Remote Sensing, 54, pp.177–185.
[6]  Yeh, A.G.O. and Li, X., 2001, Measurement and monitoring of urban sprawl in a rapidly growing region using entropy. Photogrammetric Engineering and Remote Sensing, 67, pp.83.
[7]  Haack, B.N. and Rafter, A., 2006, Urban growth analysis and modelling in the Kathmandu valley, Nepal. Habitat International, 30, pp.1056–1065.
[8]  Banzhaf, E., Grescho, V. and Kindler, A., 2009, Monitoring urban to peri-urban development with integrated remote sensing and GIS information: a Leipzig, Germany case study. International Journal of Remote Sensing, Vol. 30, No.7, pp.1675–1696.
[9]  Stal, C., Tack, F., Maeyer, F.D., Wulf, A.D. and Goossens, R., 2013, Airborne photogrammetry and lidar for DSM extraction and 3D change detection over an urban area – a comparative study. International Journal of Remote Sensing. Vol. 34, No. 4, pp.1087–1110.
[10]  Chinbat, B., Bayantur, M. and Amarsaikhan, D., 2006, Investigation of the internal structure changes of Ulaanbaatar city using RS and GIS, Proceedings of the ISPRS Mid-term Symposium, ITC, Enschede, The Netherlands, pp.wg04_1-6.
[11]  Mongolian Statistical Year Book, 2011, National Statistical Office of Mongolia, Ulaanbaatar, Mongolia.
[12]  ERDAS, 1999, Field guide, Fifth Edition, ERDAS, Inc. Atlanta, Georgia.
[13]  Pohl, C., and Van Genderen, J.L., 1998, Multisensor image fusion in remote sensing: concepts, methods and applications. International Journal of Remote Sensing, 19, pp.823-854.
[14]  Vrabel, J., 1996, Multispectral imagery band sharpening study. Photogrammetric Engineering and Remote Sensing, 62, 1075-1083.
[15]  Pajares, G. and Cruz, J.M., 2004, A wavelet-based image fusion, Pattern Recognition, pp.1855-1872.
[16]  Seetha, M., Malleswari, B.L., Muralikrishna, I.V. and Deekshatulu, B.L., 2007, Image fusion - a performance assessment, Journal of Geomatics, 1, pp.33-39.
[17]  Ehlers, M., Klonus, S. and Åstrand, P.J., 2008, Quality Assessment for multi-sensor multi-date image fusion, CD-ROM Proceedings of ISPRS Congresses, Beijing, China, July 3- 11, 2008.
[18]  Mather, P.M. and Koh, M., 2011, Computer Processing of Remotely-Sensed Images: an Introduction. Fourth edition (Wiley-Blackwell).
[19]  Amarsaikhan, D. and Douglas, T., 2004, Data fusion and multisource data classification, International Journal of Remote Sensing, 17, pp.3529-3539.
[20]  Wu, Z., Yi, L. and Zhang, 2009, Uncertainty analysis of object location in multisource remote sensing imagery, International Journal of Remote Sensing, Vol.30, No.20, pp.5473-5487.
[21]  Laurin, G.V., Liesenberg, V., Chen, Q., Guerriero, L., Frate, F.D., Bartolini, A., Coomes, D., Wilebore, B., Lindsell, J. and Valentini, R., 2013, Optical and SAR sensor synergies for forest and land cover mapping in a tropical site in West Africa, International Journal of Applied Earth Observation and Geoinformation, 21, pp.7-16.
[22]  Solberg, A.H.S., Taxt, T. and Jain, A.K., 1996, A Markov random field model for classification of multisource satellite imagery, IEEE Transactions on Geoscience and Remote Sensing, 34, pp.100–112.
[23]  Franklin. S.E., Peddle, D. R., Dechka, J. A. and Stenhouse, G. B., 2002, Evidential reasoning with Landsat TM, DEM and GIS data for landcoverclassification in support of grizzly bear habitat mapping, International Journal of Remote Sensing, Vol.23, No.21, pp.4633-4652
[24]  Hu, S. and Wang, L., 2013, Automated urban land-use classification with remote sensing, International Journal of Remote Sensing, Vol.34, pp.790–803.
[25]  Cao, X., Chen, J., Imura, H. and Higashi, O., 2009, A SVM-based method to extract urban areas from DMSP-OLS and SPOT VGT data, Remote Sensing of Environment, 10, pp.2205-2209.
[26]  Amarsaikhan, D., Ganzorig, M., Saandar, M., Blotevogel, H.H., Egshiglen, E., Gantuya, R., Nergui, B. and Enkhjargal, D., 2012, Comparison of multisource image fusion methods and land cover classification, International Journal of Remote Sensing, Vol.33(8), pp.2532-2550.
[27]  Erbek, F.S., Zkan, C.O. and Taberner, M., 2004, Comparison of maximum likelihood classification method with supervised artificial neural network algorithms for land use activities, International Journal of Remote Sensing, 25, pp.1733–1748.
[28]  New Land Law of Mongolia, 2002, New Land Law of Mongolia, Ulaanbaatar, Mongolia.