-
Paper Information
- Paper Submission
-
Journal Information
- About This Journal
- Editorial Board
- Current Issue
- Archive
- Author Guidelines
- Contact Us
American Journal of Geographic Information System
p-ISSN: 2163-1131 e-ISSN: 2163-114X
2013; 2(2): 19-26
doi:10.5923/j.ajgis.20130202.01
Quality Assessment of Volunteered Geographic Information
 Abstract
 Reference
 Full-Text PDF
 Full-text HTML
Roya Esmaili1, Farzin Naseri2, Ali Esmaili3
1GIS Engineering, Graduate University of Advanced Technology, Kerman, Iran
2Dep. of GIS Engineering, Graduate University of Advanced Technology, Kerman, Iran
3Dep. of RS Engineering, Graduate University of Advanced Technology, Kerman, Iran
Correspondence to: Roya Esmaili, GIS Engineering, Graduate University of Advanced Technology, Kerman, Iran.
| Email: |  |
Copyright © 2012 Scientific & Academic Publishing. All Rights Reserved.
Recent advances in spatial data collection technologies and online services dramatically increase the contribution of ordinary people to produce, share and use geographic information. Collecting spatial data and disseminating them on the internet by citizens has led to a huge source of spatial data termed as Volunteered Geographic Information (VGI) by Mike Goodchild. Despite the advantages of VGI, there are a lot of doubts about its quality. This article examines the early literature on this phenomenon and illustrating the current methods for quality assessment and assurance of VGI. Almost all the existing researches are based on comparing the VGI data with the accurate official data. However in many cases there is no access to correct data, so looking for an alternative way to determine the quality of VGI data is essential. In this article a method for positional accuracy assessment of VGI is suggested based on comparing the existing data of the same place with each other according to the metadata that their creators have obtained. The proposed method was implemented for the different maps that were produced by various methods from our case study.
Keywords: Crowd-sourcing, Volunteered Geographic Information (VGI), Quality Assessment
Cite this paper: Roya Esmaili, Farzin Naseri, Ali Esmaili, Quality Assessment of Volunteered Geographic Information, American Journal of Geographic Information System, Vol. 2 No. 2, 2013, pp. 19-26. doi: 10.5923/j.ajgis.20130202.01.
Article Outline
1. Introduction
- Historically, professional surveyors, cartographers, geographers and governmental agencies endeavoured to provide geographic data from the Earth in an authoritative manner[1] through several methods including surveying, photogrammetry and remote sensing[2], which could be later ordered by the users in paper or digital format. However,during the last decade, Internet was increasingly deployed for providing the users with geographic information, resulted in “Geographic World Wide Web”[3]. In this period consumers could just download maps free or by paying to use them and they couldn’t make changes, edit or add something to maps on the Internet.Improvement of web-based mapping, invention of cell phones and devices that are equipped with Global Positioning System (GPS), PDAs and digital cameras have made it possible for ordinary people to collect spatial data, which are then shared and disseminated on the internet using web map services and specially Web 2.0[3]. Producing maps and geographic Information by non-expert people without academic studies and with local knowledge about their environment and generally the world, is preparing a phenomena that is named by different terms in researches such as Neogeographic[4], Public Participation GIS[5], Ubiquitous cartography[6] and Goodchild named this phenomena Volunteered Geographic information (VGI)[7]. Web sites such as OpenStreetMap (OSM) and Wikimapia, aiming to produce a free and editable map of the world, are examples of VGI[8].VGI possess many advantages such as free access, quick acquisition and provides types of data of places as well. However, accuracy and quality assessment of these data still are challenge for researchers.In this paper we reviewed the existing methods for quality assessment of VGI data and suggest a method for determining the quality of data to the users that the majority of them are the ordinary people and have no academic knowledge. Section 2 provides the background of crowdsourced data and specially describes the VGI. Section 3 explains the quality of crowdsourced data and presents the existing methods for quality assessment of the user generated content, particularly in spatial domain. In Section 4 our method for spatial quality assessment of VGI data is explained. Section 5 presents the results of applying the proposed method for a case study. Finally, section 6 contains some concluding remarks and ideas for future work.
2. User Generated Content
- There are different definitionsfor user-generated content, however Goodchild expressed that user-generated content refers to “the ability of users to create content that is then integrated and made available through Web sites”[9]. The Organization for Economic Cooperation and Development (OECD) defined UGC as a creative content that is created by public without any professional practices and is disseminated on the internet[10].UGC is not limited to the internet and people can generate content everywhere for example when they tell someone somethingthey’re generating content[10].However internetmade the creation and distribution of the content easier and quicker. Web 2.0 converted internet from one-directional, that users could just see the content of web sites, to a bi-directional one that users in addition to using and seeing the contents of the internet could create and generate data by themselves and share it on the Internet[11]. Social networks such as Facebook, Tweeter and creation of weblogs and wikis and the photo and video sharing websites such as Flickr and YouTube are all using the Web 2.0 technology and made it possible for ordinary people to create data and disseminate it on the Internet. The most famous example of crowd sourcing websites is Wikipedia that people can create articles and edit them.The ability of individuals to create their own digital geographic information and acquiring spatial data such as place names, topographic features and transport networks by ordinary people through up to five functioning senses and by means of tools that are equipped with GPS brought out this idea that people can be imagined as mobile sensors[11]. They can collect data about everywhere and mostly free and share it with others. Goodchild named the user generated content in spatial domain “Volunteered Geographic Information” or in brief VGI[7]. VGI has changed the way of producing and sharing and the characteristics of digital spatial data[12].By traditional spatial data, collected by official organization of map provider, we cannot answer to the questions in detail such as the name of a local restaurant in a specific street, maybe because these data are not important to be collected or change rapidlyand cannot be updated quickly[13].While one of the advantages of VGI data is that we can be aware of local spatial events by citizens that would be time consuming to be collected officially[14].Ostlaender named some of VGI applications such as: finding new bike road, monitoring forest fires, or analyzing tweeter messages to create landing map of planes[15]. The almost famous examples of VGI are websites such as OpenStreetMap and Wikimapia that provided tools for users to add geographic data on the map by uploading their GPS tracks or digitizing the background satellite image or simply naming the streets or places all around the world.
3. Quality Assessment of Crowd-Sourced Data
- Using improper data for an application can cause many socio-economic problems. Crowd sourced data are not the exception and their quality should be determined before usage.In spite of doubts about the user generated contentswhich are collected by non-experts and without any quality standards, the quality gap is balanced by volume, as user generated content is much larger than editorial content[16].As the volume of such collaborative information increases, the problem of assessing its quality, preventing vandalism and spam grows simultaneously[17].Several studies have evaluated the accuracy of crowdsourced data such as quality of Flickr tags[18] or quality of Wikipedia articles[19]. The majority of researches were about quality assessment by reputation systems.Reputation systems are in two categories; user-driven and content-driven. User-driven which means giving reputation to the article or product by users according to their own factors such as websites likeeBaywhere the users themselves will assess the process of selling and buying of each other; on the other handcontent-driven reputation is giving reputation without theinterference of users and according to the content of an article or giving reputation to contributors according to the lifespan of their edits on articles[19] the more the article has words, the more reputation is gained.
3.1. Quality Assessment of VGI
- Awareness of the quality of spatial data as Tveite said is important because of two reasons; economic and legal importance of spatial data in decision making processes and the possibility of combining multiple spatial data set for different purposes[20]. For example OSM maps are used in different commercial projects as background maps so awareness of their quality is essential[21].Data quality can be defined as fitness for purpose, or how suitable some data is in satisfying particular needs or fulfilling certain requirements to solve a problem[22]. When considering the quality of spatial data, most naive users consider only the positional accuracy of data. However, the spatial quality is more than that and has different aspects: positional accuracy, attribute accuracy, currency, completeness, logical consistency, lineage, accuracy and resolution[10].VGI data are sometimes called “asserted” because there is no standard for checking their quality and there is no reference or citation for them, in divers the official data are called “authoritative” because their quality is checked with standards[14]. Although the quality of VGI data might not be clear but in emergency situation such as forest fireswhere we have no official data, using volunteered data with quality vagueness is better than waiting for better data to arrive[23]. The most significant advantage of VGI is that they can be up to date in less time than traditional data so for the projects that we have time limitations such as updating the streets of a city in few weeks the local citizens are the best source to collect data and update the information about the streets[9]. Cooper mentioned some of the challenges that VGI has for quality assessment, one of them is that the user cannot assess the quality of data in isolation because the quality depends on some parameters such as the data user, purpose and the content in which it is used the users are not forced to create metadata for the data and also all aspects of quality cannot be assessed quantitatively and they depend on the language (e.g. about the completeness degree of a data set)[10].As Goodchild mentioned[24] quality assurance in traditional data is done in two parts; one of them is assuring and checking the quality of data during the contribution and creating them and the second one is checking the quality of data after making them by comparing them with reference data and save the results in form of metadata. He discussed three approaches to quality assurance of VGI data follows the first procedures of quality assurance; Crowd-sourcing, social and geographic approaches. Here they will be explained briefly.● Crowd-sourcing approach: It expresses the number of people even without qualification can solve the problem that is caused by individual and also the answer of a group is converge to the truth in compare to the answer of an individual.● Social approach:In this approach there will be a gate-keeper that will check the entrance of data to the data set to avoid vandalism, like the Data Working Group (DWG) of OpenStreetMap who will decide the solution in critical situations such as arguing between users about a certain place or any vandalism and violation that may be happened.● Geographic approach: This approach suggests checking the geographic data according to some rules such as language structures. For example the data that are near each other should be consistence and obey some rules.Goodchild also mentioned that the first approach may not be so useful for geographic domain because there will be many spatial error despite of many volunteers in an area. But the last approach can be more useful because it can be automated and it’s specifically for geographic data.As mentioned above there are two processes for quality assurance that Goodchild defined three approaches for the first one. Here the existing methods for quality assessment that followed the second part are explained.
3.1.1. Metadata
- One method to determine the quality of data set is using metadata. Despite the importance of metadata no metadata exists for projects such as OpenStreetMap or Google Earth[25], for example even there is no information about the date that the image has been obtained in Google Earth[14]but the user that contributes in volunteered projects may be volunteer to give more data about the data[9].Goodchild argued for a binary user-centric metadata that in addition to the single quality of the data can describe the ability of two dataset to work together because in geospatial web relative quality of data sets that are being integrated is so important. He called it metadata 2.0[9].The quality of spatial data collected by a contributor can be determined by factors such as the experience of the contributor in GIS projects and specially crowdsourced projects or how they apply metadata to their contributed data[26].The vagueness of crowdsourced data can be determined by two types of metadata one of them is “user-encoded vagueness metadata” for example the number that the user himself give to the data that has been created and the other type is “system-created vagueness metadata” in which the system itself save to define the quality of data such as saving the scale in which the data has been added automatically[27].
3.1.2. Comparison
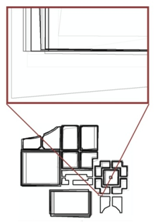
- As mentioned in the previous section one of the spatial quality parameters is positional accuracy. To measure this parameter, the data should be compared with an accurate exiting data. The main problem for measuring positional accuracy is choosing proper dataset that prepared data be compared with proper dataset[28]. However on of the problem with this method specially about volunteered geographic data is that in many cases we do not have access to a suitable ground-truth datasets for comparison[26]. Generally evaluating positional accuracy is based on a buffer technique that was developed by Goodchild and Hunter in 1997; illustrated by Figure 1. Ather in 2009 compared OSM data with OS data in England[22] and Kounadi compared OSM data with HMGS data in Athens, Greece using the mentioned buffer method[20].In the absence of availability of a ground truth dataset a simple alternative solution is to analyze the density of data points within the grid squares (Figure 2)[26].
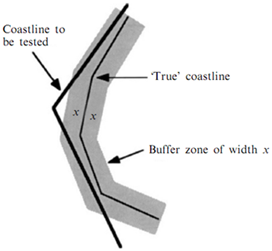 | Figure 1. Width x is created around the reference object and the proportion of the tested source that lines within the buffer is then calculated. Depending on the size of the buffer chosen, the level of accuracy of the tested source can then be determined[29] |
 | Figure 2. Density of points in OSM Lithuania using 5KM grid squares[26] |
3.1.3. Reputation System
- Some VGI websites for controlling their contributors and avoiding vandalism have ranked their contributors according to different parameters. Wikimapia has ranked its users according to the level of experience, number of edits, and the number of objects or pictures and etc. that has added. For example a new comer will ranked in lower level(level zero) that means he can only add objects and cannot delete any objects on the map but after a period of time and gaining experience of mapping he will go to level 1 that can delete objects and will have more authority. And the highest level belongs to the administrators that have the most authority for instance they can block the user that make vandalism.
4. Our Proposed Method
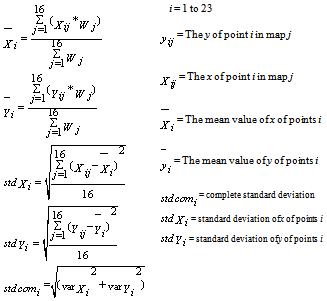
- The most existing methods for quality assessment of volunteered data as mentioned are based on comparing with correct data. However, in many cases there is no access to the correct data. Therefore,we would be forced to look for an alternative method. Among different parameters of spatial quality we suggest a method for positional accuracy.To determine the positional accuracy of data sets that belong to the same area we can follow the below procedure:1. Ask the user to get information about the way that he or she has collected the data and the precision of the tools that were used. Determine whether he used GPS or digitizing satellite image or etc. and if he used GPS determine the precision of the device. And also information about his age, being citizen of the place that he collects the data from or not and etc.2. Set an initial positionalaccuracy for each data set according to the information that its creator has given to us.3. Determine in common points between maps and label them one by one (the same points in different maps will have the same label). Then, points of the same label will be grouped. 4. The weighted mean and standard deviation will be calculated for each group.5. In each group the distance of each point is calculated with the mean value of the group. Thereafter the calculated distanceis compared with the triple of standard deviation and if it was lower the point will be keptand otherwise it will beomitted.6. The process 4 and 5 will be repeated for the group that a point has been left out from. It will be repeated until no point is omitted.7. The mean value of each group is determined, and then the distance of each point (except the ones that have been omitted) with the mean value of its group is calculated. This distance is the error for each point.8. The final error of each data set is determined by calculating the mean value of the errors of the points in each data set that was calculated in the previous level.9. The positional accuracy of each dataset is the inverse of the error of it.
5. Implementation
5.1. Study area
- Kerman Graduate University of Technology was chosen to implement the proposed approach (figure 3).
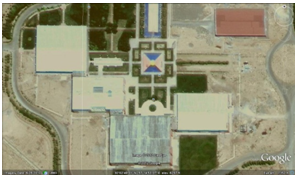 | Figure 3. The Google Earth image of study area (Kerman Graduate University of Technology) |
|
|
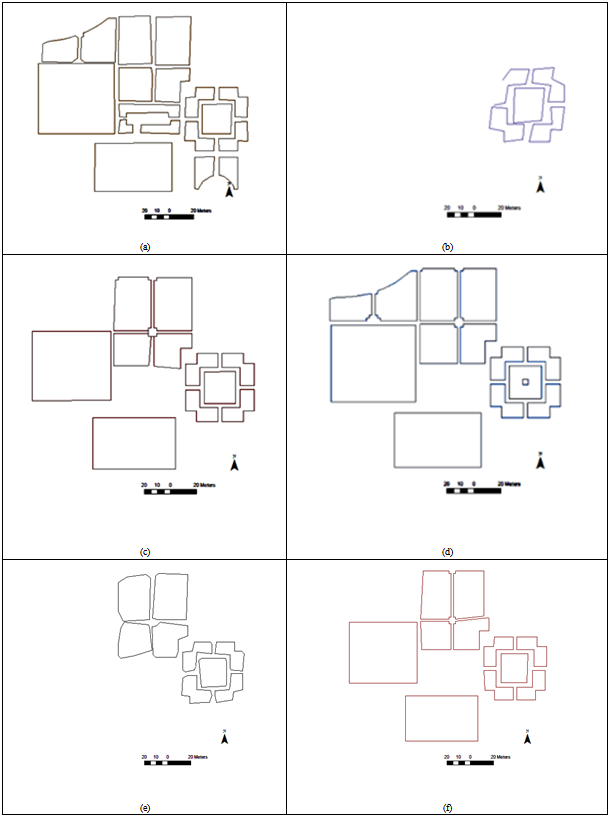
 | Figure 4. Overlay of 16 Maps. We can see the difference between maps |
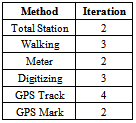
5.2. Positional Accuracy
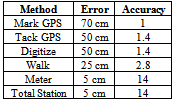
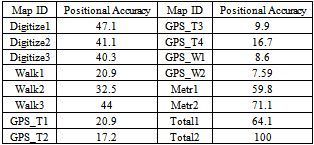
- To determine the positional accuracy of each map the following processes should be passed:1. Gathering information about map from its creator such as the method that the data was produced by.2. The error was set for each map according to its method,and then the initial accuracy based on the error was calculated. The accuracy is the inverse of the error (table 3).
|
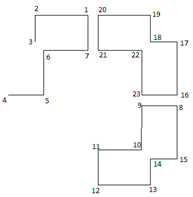 | Figure 5. In common points between 16 maps |
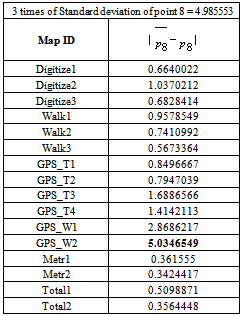
 5. In each group the distance of each point is calculated with the mean value of the group (error of each point). Thereafter the calculated distance is compared with the 3*standard deviation and if it was lower the point will be kept and otherwise it will be omitted.Point number 12 from GPS-T2, points 8, 10 and 15 from GPS_W2 and point 13 from GPS_T1 were omitted and again the levels 2 and 3 were repeated for and the points 8, 10, 12, 13, 15 (The distance for point 8 in each map and its mean is shown in table 4 as example).
|
|
6. Conclusions
- Crowdsourced data in general and volunteered geographic information in particular, are becoming the huge source of data. VGI has enormous advantages such as: it’s free, has the ability to produce large amount of data in short period of time and collect local data that are in some cases impossible to obtain them by traditional methods of mapping. Despite its benefits, volunteered geographic information cannot be used in many applications because its quality is not determined and there is vagueness about it. Therefore many researches have done to determine the quality of VGI.In this article the existing methods for quality assessment of crowdsourced data and VGI is explained. The majority of the methods are based on comparing the VGI data with an accurate official data but in most cases there is no access to accurate data. We looking for an alternative way and we suggested a method for assessing positional accuracy based on comparing the existing data of the same place with each other according to the metadata that their creators have given. The proposed method was implemented for the different maps that were produced by various methods from our case study.In this paper just a method for positional accuracy assessment was suggested. Determining the other spatial quality parameters and also display the quality to the users of volunteered geographic information with the methods that can be easily interpreted by ordinary people can be the aim of future researches.