-
Paper Information
- Next Paper
- Paper Submission
-
Journal Information
- About This Journal
- Editorial Board
- Current Issue
- Archive
- Author Guidelines
- Contact Us
American Journal of Geographic Information System
p-ISSN: 2163-1131 e-ISSN: 2163-114X
2013; 2(1): 1-5
doi:10.5923/j.ajgis.20130201.01
Application of Remote Sensing and GIS for Flood Hazard Management: A Case Study from Sindh Province, Pakistan
 Abstract
 Reference
 Full-Text PDF
 Full-text HTML
Kabir Uddin, Deo Raj Gurung, Amarnath Giriraj, Basanta Shrestha
Mountain Environment and Natural Resources Information System, International Centre for Integrated Mountain Development, GPO Box 3226, Kathmandu, Nepal
Correspondence to: Kabir Uddin, Mountain Environment and Natural Resources Information System, International Centre for Integrated Mountain Development, GPO Box 3226, Kathmandu, Nepal.
| Email: |  |
Copyright © 2012 Scientific & Academic Publishing. All Rights Reserved.
Floods are one of the most common hazards in the world, affecting people’s lives and livelihoods. Flood hazard mapping and flood shelters suitability analysis are vital elements in appropriate land use planning for flood-prone areas. This paper describes application of Remote Sensing (RS) and Geographical Information Systems (GIS) in identifying flood hazard zones and flood shelters and are therefore important tools for planners and decision makers. The purpose of this article is to describe a simple and efficient methodology to accurately delineate flood inundated areas, flood-hazard areas, and suitable areas for flood shelter to minimize flood impacts. Possible extent of flooding and suitable location flood shelter sites were modeled and mapped for Sindh Province in Pakistan, using the software ArcGIS model builder. The output was validated using inundation maps based on flood events that took place in 2010 in Pakistan. These were mapped using object-based image analysis (OBIA) implemented in eCognition software. The catastrophic flood of 2010 inundated a total area of 7579 km2, while the modeled result indicated the hazard area to be 6216 km2 out of 46138 km2. Discrepancies in modeled and mapped results are insignificant and acceptable considering the manual flood management interventions which are beyond the capability of models to represent. Thus, this method is robust enough to develop flood hazard zoning maps and map shelter sites for flood management.
Keywords: Remote Sensing, GIS, OBIA, Flood, Hazard, Sindh River, Pakistan
Cite this paper: Kabir Uddin, Deo Raj Gurung, Amarnath Giriraj, Basanta Shrestha, Application of Remote Sensing and GIS for Flood Hazard Management: A Case Study from Sindh Province, Pakistan, American Journal of Geographic Information System, Vol. 2 No. 1, 2013, pp. 1-5. doi: 10.5923/j.ajgis.20130201.01.
Article Outline
1. Introduction
- More than half the world's population lives in Asia, which is approximately one-fifth of the earth's land area. As natural disasters increase in both intensity and severity around the world, the Asian region continues to suffer a disproportionate number of hazard events and related losses in lives, infrastructure, stability, and economic progress. In the period 1994–2004 alone, Asia accounted for one third of 1,562 flood disasters worldwide and nearly 60,000people were killed in floods[1]. A flood is an overflow of an expanse of water that submerges the land. Flood hazards are the most common and destructive of all natural disasters and are a constant threat to life and property. Each year, flood disasters result in tremendous losses and social disruption worldwide. Over the past 30 years, floods have been the most catastrophic natural disaster affecting, on average, about 80 million people per year or half of the total population affected by any natural disaster, causing economic damage worth over US$11 million annually around the world[2]. As increasing human activity downstream of rivers results in greater flood damage; floods themselves are also increasing in size and frequency due to human activities in the upstream section of the river system[3]In recent years, risk-based approaches have received increasing attention as a viable means to manage flood hazards. Hazard risk and vulnerability assessment (HRVA) examines the hazards that may affect a community in order to determine the risk that each hazard event poses to both the community as a whole and to vulnerable elements in the community.In Pakistan, floods have been recognized as a major natural calamity. The country has a long history of flooding from the Indus River and its tributaries and the floods of 1928, 1929, 1955, 1957, 1959, 1973, 1976, 1988, 1992, 1995, 1996 and 1997 attest to its destructive nature and its adverse impact on lives and property in Pakistan. More than three million homes were destroyed and 160 persons lost their lives in the great flood of 1973. Three years later in 1976, floods demolished over 10 million houses while 425 lives were lost with other losses amounting to a Rs. 6 billion. Towards the end of September 1988, an unprecedented flood occurred, inflicting damage nationwide in Pakistan worth about Rs. 17 billion. The catastrophic flood of 1992 surpassed all previous records with damages estimated at Rs. 50 billion.Sindh is the south eastern province of Pakistan. The province is associated with the longest river of Pakistan which stretches to about 1976 miles (3180 km) long. Originating in the Tibetan Plateau in the vicinity of Lake Mansarovar in the Tibet Autonomous Region, the river runs a course through the Ladakh district of Jammu and Kashmir, then enters the Northern Areas (Gilgit-Baltistan) flowing through the North in a southerly direction along the entire length of the country to merge into the Arabian Sea near the port city of Karachi in Sindh. It is the major source of irrigation for Pakistan’s fertile agricultural lands. The river’s estimated annual flow stands at around 207 cubic kilometers (cu km), making it the 21st largest river in the world in terms of annual flow. Climate is not uniform over the Indus Basin. It varies from subtropical arid and semi-arid to temperate sub-humid in the plains of the Sindh and Punjab provinces, and alpine in the mountainous highlands to the north. Annual precipitation ranges between 100 mm and 500 mm in the lowlands to a maximum of 2000 mm (water equivalent) on mountain slopes. Snowfall at higher altitudes (above 2500 m) accounts for most of the river runoff. Alluvial land in Pakistan is known to be a flood-prone area.Earth observation techniques can contribute to finding out more accurately what causes floods. Together with flood hazard mapping, earth observation techniques can be used to assessing damage to property, infrastructure, and agricultural crops. The uses of remotely sensed data in identifying the trends of river channel migration and as source of input data for determining river behaviour has been gaining popularity in recent years. One of the main characteristics of remote sensing is its capability to generate a large amount of information frequently and spatially, becoming a powerful tool for monitoring changing aquatic environments. Remote sensing data has been used to document water quality estimate water depths and monitor river channel changes and aquatic habitat[4-6]. Object-based analysis of multispectral imagery was introduced early on in remote sensing literature[7]; however, the object-based approach has largely been ignored in favour of pixel-based methods which have been easier to implement[8]. One of the advantages of object-based image analysis is the multitude of additional information that can be derived from image objects compared to the amount of information available from individual pixels[9].This study aims to determine flood hazard, flood extended areas, and proposed flood shelters using remote sensing and geographic information systems tools. An effort was made to prepare a flood hazard zone map and a proposed flood shelter map using GIS and remote sensing techniques and incorporating a satellite image, topographic map. This study also attempts to exploit the capabilities of remote sensing and GIS techniques to suggest an appropriate methodology for flood hazard mapping.
2. Methodology
2.1. Study Area
- The study area is located in the south-eastern part of Nepal and seven districts of Sindh province (Figure 1). Sindh lies in a tropical to subtropical region; it is hot in the summer and mild to warm in winter. Temperatures frequently rise above 46°C between May and August, and drops to a minimum average of 2°C during December and January in the northern and elevated regions. Annual rainfall averages about seven inches, falling mainly during July and August. The province is mostly arid, with scant vegetation except for the irrigated Indus Valley.
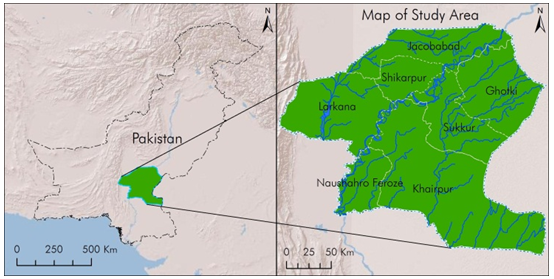 | Figure 1. Location Map of Study Area |
2.2. Data Used
- For this study moderate resolution imaging spectroradiometer (MODIS) imagery was used to generate a flood inundation map. A topographic map and Shuttle Radar Topography Mission (SRTM) DEM data from various sources were used to analyse flood hazard area and flood shelter areas.
2.3. Image analysis
- Flood hazard depends on many factors such as flood inundation and topography of the area and etc. Enumerate the flood extended area mapping were followed few steps. The acquired MODIS reprojected UTM, Zone 47. After that eCognition Developer software was used for object-based image analysis (OBIA). Figure 2 presents the flow diagram of object-based image analysis for flood extended mapping.Compared with pixel-based methods, this approach shows better classification results with higher accuracy as it uses both spectral and spatial information[4,10,11]. The basic step in eCognition image analysis is to segmentation a scene where information of single pixels is aggregated into homogeneous image objects. Multiresolution segmentation, which was used in this study for object-based image analysis, groups areas of similar pixel values into objects; homogeneous areas result in larger objects, heterogeneous areas in smaller ones. Therefore several segmentations were tested with different parameters until the result was satisfying.. For each object information on average spectral values, average Normalized Difference Vegetation Index (NDVI), and land and water mask were derived. In the pre-processing stage, an NDVI image was created using the customised feature in the form: NDVI = (RED – IR) / (RED + IR ), NDVI indices values range from -1.0 to 1.0, non-vegetation area negative and vegetation area will have positive value. Land and Water Mask created by = IR) / (Green) * 100. Land and water mask index values can range from 0 to 255, but water values typically range 0 to 50. This information was used to develop suitable classification algorithms for flood inundation mapping.
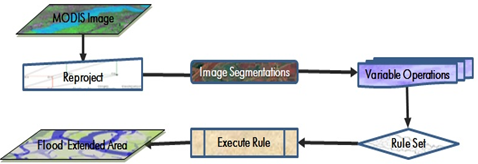 | Figure 2. Flow diagram of flood extended mapping |
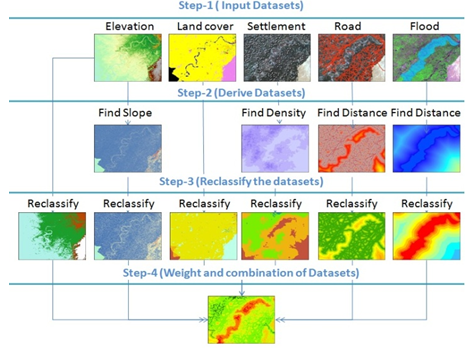 | Figure 3. Flow diagram of flood shelter analysis |
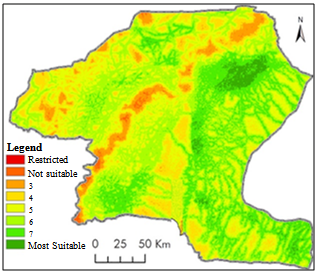
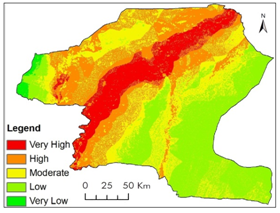 | Figure 4. Flood hazard zoning map |
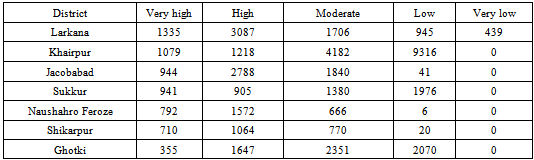
3. Results
 | Figure 5. Flood shelter suitability map |
|
4. Conclusions
- Based on the results of this case study for Sindh province, it can be concluded that geospatial technology provides the best potential to analyze and provide results required for prompt and effective decision-making on floods. This comprehensive flood hazard and flood shelters model developed in ArcGIS ModelBuilder can be easily handled by novice GIS users. The object-based remote sensing technique and geographical information systems were used to classify the extent of floods. Object-based classification systems allow different rules for different classes that can be used further for similar types of flood mapping. The studies support the conclusion that information derived from different imagery can be very valuable to operational users for planning flood-related emergency response. Natural flood disaster is common and cannot be stop. Remote sensing is an efficient tool for flood mapping and suitability analysis and can be useful for emergency response and disaster preparedness.
ACKNOWLEDGEMENTS
- We acknowledged the SERVIR-Himalaya initiative with the support from USAID and NASA. Our gratitude goes especially to Mr. Birendra Bajracharya Sr. GIS Specialist, MENRIS for the encouragement and support extended to bring this paper.