-
Paper Information
- Next Paper
- Previous Paper
- Paper Submission
-
Journal Information
- About This Journal
- Editorial Board
- Current Issue
- Archive
- Author Guidelines
- Contact Us
American Journal of Geographic Information System
p-ISSN: 2163-1131 e-ISSN: 2163-114X
2012; 1(3): 66-71
doi: 10.5923/j.ajgis.20120103.04
Understanding Gully Erosion Vulnerability in Old Imo State Using Geographic Information System and Geostatistics
 Abstract
 Reference
 Full-Text PDF
 Full-Text HTML
Josh U. Ogbonna
Department of Geography and Planning,Abia State University, Uturu. NIGERIA
Correspondence to: Josh U. Ogbonna , Department of Geography and Planning,Abia State University, Uturu. NIGERIA.
| Email: |  |
Copyright © 2012 Scientific & Academic Publishing. All Rights Reserved.
Geostatistical model (GM) and the Geographic Information System (GIS) are used as the Decision Support System (DSS) for the examination of the vulnerability rate of gully erosion in Old Imo State. The gully erosion sites were identified using a combination of Landsat TM satellite imagery, interpretation of aerial photographs and field surveys using the Global Positioning Systems (GPS). Databases on the geological formations, and gully erosion were determined through fieldwork, and digitization. Factors which influence gully occurrence, such as slope, distance from drainage and terrain mapping unit were calculated from the topographic database, and the relationship between these factors determined.
Keywords: Geostatistic Model, Logistic Regression, Gully Erosion, GIS, GPS, Fuzzy, DSS, Buffering
Cite this paper: Josh U. Ogbonna , "Understanding Gully Erosion Vulnerability in Old Imo State Using Geographic Information System and Geostatistics", American Journal of Geographic Information System, Vol. 1 No. 3, 2012, pp. 66-71. doi: 10.5923/j.ajgis.20120103.04.
Article Outline
1. Introduction
- Gully erosion is a great environmental issue in the recent decades, resulting in land degradation and lowering agricultural productivity and promotes serious land degradation. In the Old Imo State, the impact of gully erosion has been unimaginable, displacing communities and causing destruction of farm lands. However, human activities like land- clearing, and deforestation, overgrazing, as well as the creations of firewood tracks accelerate the natural rates of these processes. The immediate site effect is the loss of soil while the off-site effects include the yield of sediment on the river network, which results in declining water quality and damage to the hydraulic structures[1]. It is therefore necessary to assess and to manage areas that are vulnerable to gully erosion in order to mitigate any damage associated with it. Among the many causes, gullies triggered by man’s activities and rainfall are the most common in the Old Imo State. The resultant need to predict gully occurrences has led to the development of numerous stochastic and process-based models, with increasing emphasis on the use of the Geographic Information Systems (GIS), Satellite Remote Sensing (SRS) and Geostatistical models.[2],[3], [4],[5],[6],[7],[8],[9],[1], and[10]. In developing a sustainable remediation procedure, an assessment of gully erosion through a spatial mapping of the areas vulnerable to gully formation is necessary. These assessments are carried out by applying the frequency ratio and logistic regression models, with verification of the results. Hence, the objective of this study is to apply and verify the models for gully erosion in Old Imo State using the GIS and geostatistics. The map below (Fig. 1) shows Old Imo State (The Study Area) with spatial distribution of gully. The study area is bounded by latitudes 4°45’ and 6°15’ North and longitudes 6°30’ and 8°09’ East.In order to assess soil vulnerability to gully erosion, it is necessary to identify and analyse the factors leading to the development of gully erosion. The parameters used were slope, aspect, proximity to drainage, lithology, and proximity to major structures, land cover, and geomorphologic units.Using GIS as the basic analysis tool for gully erosion mapping, it presents an effective platform for spatial and database management and manipulation. Of the statistical methods available, the logistic regression method was applied to mapping impacts of gully erosion [11]. The adaptation of GIS and data mining techniques such as fuzzy logic, and artificial neural network constitutes a new horizon to impact evaluation which is applied in this work and constitutes a new vista to knowledge.
2. Conceptual Framework
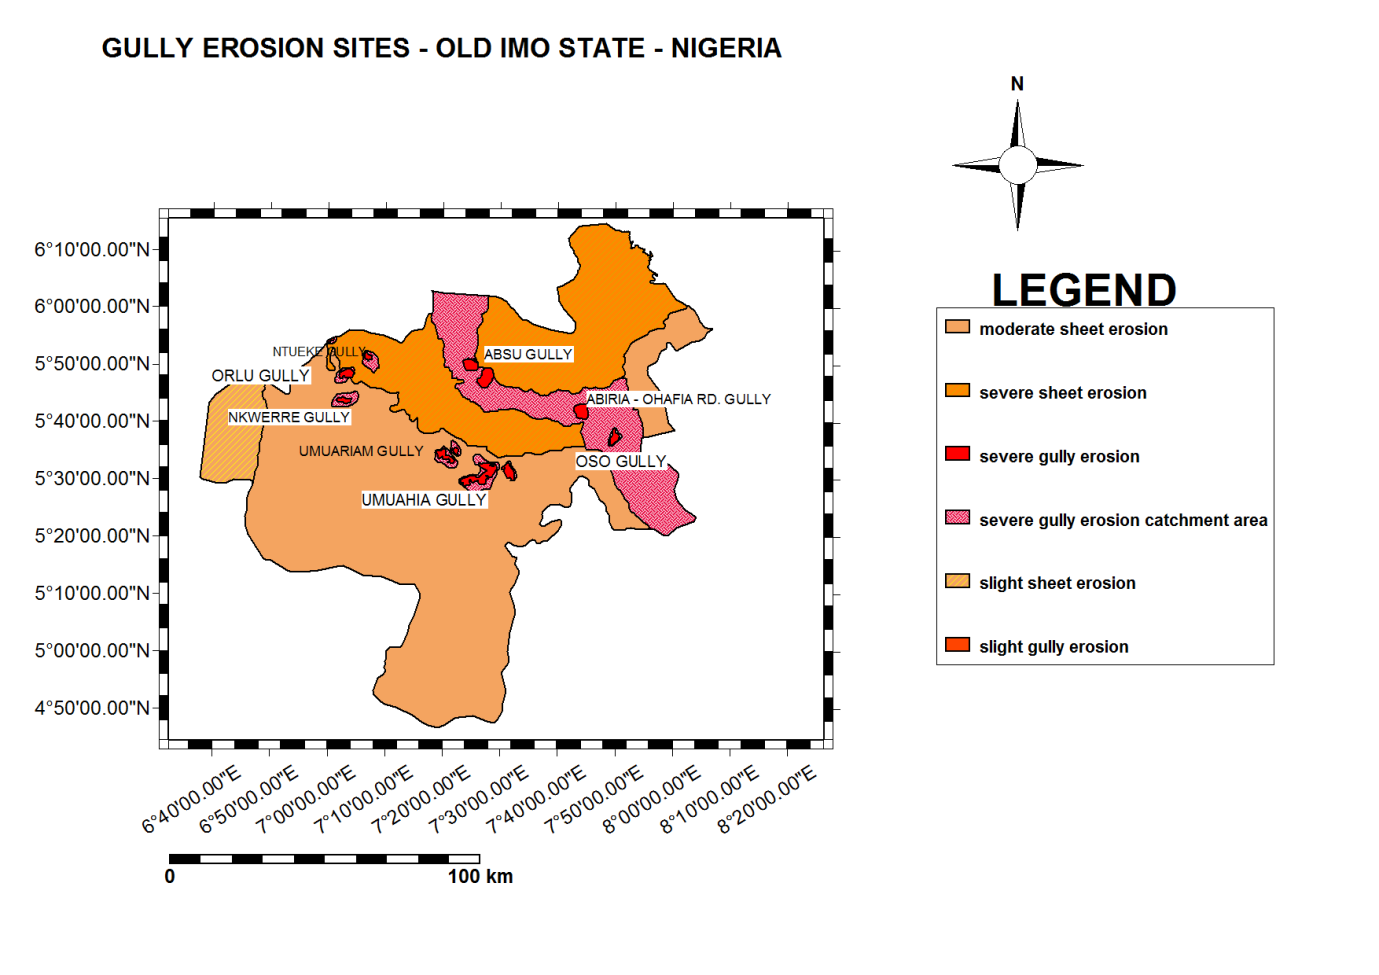 | Figure 1. Some Gully Erosion Sites in Old Imo State |
- Logistic regression is a multivariate analytic model useful for predicting the presence or absence of a characteristic or outcome based on values of a set of predictor variables [12]. The advantage of logistic regression is that, through the addition of an appropriate link function to the usual linear regression model, the variables may be either continuous or discrete, or a combination of both types, and they do not necessarily have normal distributions. In the present situation, the dependent variable is a binary variable representing the presence or absence of gully (0,1). Quantitatively, the relationship between the occurrence and its dependency on several variables can be expressed as:
 | (1) |
 | (2) |
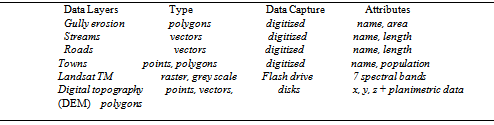
3. Data Capture and Methodology
- Data preparation involved the digitization of GIS database using ILWIS 3.6 through an on-screen digitizing mode. This led to an interactive topographical, geomorphologic, and geological maps and land use/land cover data. A digitized map of the gully erosion sites captured from satellite imagery and ground truthed through field surveys was produced, and these digital data were input to a GIS platform. A vector-to-raster conversion was undertaken to provide raster data of gully erosion areas with 10 m by 10 m pixels. Factor maps related to gully formation were constructed in a vector-type spatial database. These included topographic maps and geological maps. A land cover map was extracted from Landsat TM satellite imagery with 30 m resolution. The factors such as slope, aspect, proximity to drainage, lithology, and proximity to major structures, land cover and geomorphologic units were also used.
|
|
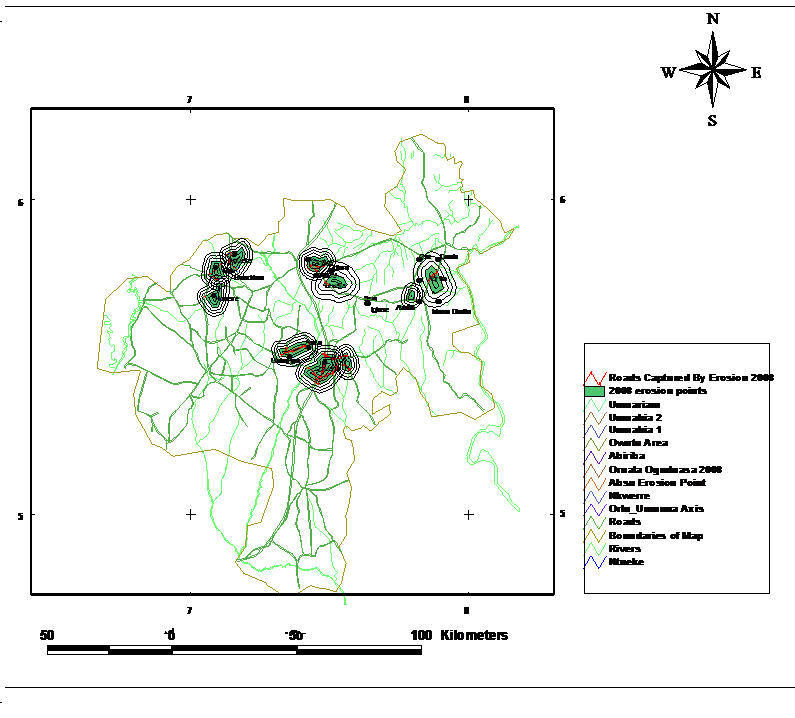 | Figure 2. Buffered Gully Erosion sites to Estimate future Impact |
4. Spatial Relationship between Gully Erosion and the Causative Factors
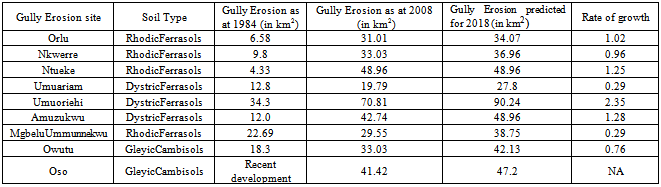
- The relationship between areas where gully erosion has occurred and the causative factors were examined. To represent this distinction, the frequency ratio was used. The factors chosen, such as the slope, distance from drainage, lithology, land use, and vegetation cover were evaluated using the frequency ratio method to determine the level of correlation between the location of the gully erosion site in the study area and these factors. Probabilistic approaches were based on the observed relationships between each factor and the distribution of gullies. In the case of the relationship between gully occurrence and slope, below a slope of 12°, the ratio was <1, which indicates a low probability of gully formation as observed within Umuahia – Obowo axis. For slopes above 12°, the ratio was >1, which indicates a high probability of gully occurrence especially within Uturu – Isuikwuato axis. This means that the gully probability increases according to slope angle. As the slope angle increases, then the shear stress in the soil or other unconsolidated material generally increases. Gentle slopes are expected to have a low frequency of gully because of the generally lower shear stresses associated with low gradients. In the relationship between gully occurrence and soil, gully erosion was most abundant on 3 major soil types; these were rhodicferrasols, dystricferrasols and gleyicferrasols. The frequency of gully infestation was lowest on gleyicferrasols and highest on rhodicferrasols. In the case of the relationship between gully occurrence and curvature, it was observed that Aba – Ukwa axis which is flat areas had a low curvature value of 0.71 shows that it has a low probability of gully occurrence. In the case of the relationship between gully formation and lithology, the frequency ratio was higher in BendeAmekeGroup formations which consist principally of lignites conglomerates with interbedded sandstones, and shales, and was lower in Niger Delta Formation which consist mainly of sands, gravels, clays mainly arenaceous with polymictic conglomerates interbedded sandstones, siltstones, and shale.For the relationship between gully formation and land cover, gully-infestation values were higher in agricultural lands, bushes and grass areas, and lower in broadleaf area. The reason for this is that gully erosion occurred mainly in none of the forested areas.
5. Applying the Geostatic Models: Frequency Ratio and Logistic Regression
- The Frequency Ratio (GR) method is used for calculating gully erosion risk. This method measures the ratio of a landscape having a characteristic, where erosion has been mapped, as compared to where they have not. It can be described as:GR = (area of gully with characteristic / total gully area) /Total area with characteristic / total area. Hence, ifGR> 1 implies proportionally greater area mapped with gully relative to the landscape as a whole with this characteristic.If GR = 1 implies that proportions of the landscape with characteristic are equivalent or equal in areas with gullies and areas without.But ifGR< 1implies that area mapped with gulliesis greater than the whole landscapes with this characteristic.While the logistic regression models the gully risk defining the relationship between predictor variables such as slope, rainfall, aspects /geology and gullies.Hence, the frequency ratio, area ratio for gully occurrence and non-occurrence was calculated for each factor’s class to the total area. The frequency ratios were calculated by dividing the gully occurrence ratio by the area ratio. The frequency ratios of each factor’s type were summed to calculate the Gully Vulnerability Index (GVI), as in (3)
 | (3) |
6. Verification of Gully Erosion Vulnerability Maps
- In the verification of gully erosion vulnerability two basic assumptions are made:→that gully formations are related to certain geo-based spatial attributes such as topography, soil, vegetation and land cover, and →that future gullies impact will be influenced by the factors of rainfall and human interference.These two assumptions were observed to be dominant in the study area. This is because, gullies were related to the spatial information and are influenced by rainfall and human interference through construction. The gully vulnerability analysis result was validated using known gully locations as in Map 1. Validation was performed by comparing the known gully location data with the gully vulnerability map buffered for 10 years (2018) using generated rate of gully growth. Each gully site with its associated factors was compared. The rate explains how well the model and factor predict the gully erosion. Map 2 shows the result of the buffered gully sites which forms a pathway for the explanation for the gully erosion vulnerability index. In the case of logistic regression model, 0.9 to 1.0 (10%) class of the study area where the gully vulnerability index had a higher rank could explain 0.39 of all the gully sites. In addition, the 0.8 to 0.1 (20%) class of the study area where the gully vulnerability index had a higher rank could explain 57% of the gully sites. To compare the result in all the factors and logistic regression model used, an area ratio of 0.8 shows a prediction accuracy of 80 %. While in the case of all factors and frequency ratio model, an area ratio of 0.7 shows a prediction accuracy of 70%. Factoring in the gully causative factors into derived logistic regression model show an average value of 0.7883 which tend to indicate the effectiveness of logistic regression model. This method is after [20].Through an overlay, buffering and split operations, this work was able to predict the gully erosion vulnerability for 2018 as shown in Table 2.
7. Conclusions
- Gullies are among the most hazardous of natural disasters. Government and research institutions worldwide have attempted for years to assess hazards and risks due to gully erosion and to show their spatial distribution [13],[14],[15],[16],[17],[18],[19], and[1]. In this study, a statistical approach for identifying the vulnerable area of gully sites using GIS shows considerable promise.The result of validation of logistic regression and frequency ratio model, the logistic regression model showed the better prediction accuracy with more than 1.6%. The frequency ratio model is simple; the process of input, calculation and output can be readily understood. The large amount of data can be processed in the GIS environment quickly and easily. The logistic regression model requires conversion of the data to spread sheet formats for use in the statistical package, and later reconversion to incorporate it into the GIS database. The integration of GIS with statistical analyses exposes the great utilities of database construction, display, printing, management and spatial analysis. Thus, it is necessary to integrate the GIS andstatistics to reduce the restrictions of using the two separate applications and increasing efficiency in gully vulnerability examination.