-
Paper Information
- Next Paper
- Previous Paper
- Paper Submission
-
Journal Information
- About This Journal
- Editorial Board
- Current Issue
- Archive
- Author Guidelines
- Contact Us
American Journal of Geographic Information System
p-ISSN: 2163-1131 e-ISSN: 2163-114X
2012; 1(3): 49-65
doi: 10.5923/j.ajgis.20120103.03
The Applications of Geo-Info Systems in Gauging the Susceptibility of Coastal Areas in Louisiana and Mississippi
 Abstract
 Reference
 Full-Text PDF
 Full-Text HTML
Edmund C. Merem 1, Raphael Isokpehi 2, Daphine Foster 1, Joan Wesley 1, Jasmine Williams-Washington 1, Emmanuel Nwagboso 3, Chandra Richardson 1, Coney Romorno 1, Marshand Crisler 1, Keishelle Jones 1
1Department of Urban and Regional Planning, Jackson State University, 3825 Ridgewood Road, Box 23 Jackson, MS 39211 USA
2Department of Biology Jackson State University, 1400 JR Lynch Street, Jackson, MS 39211, USA
3Department of Political Science, Jackson State University, 1400 JR Lynch Street, Jackson, MS 39217, USA
Correspondence to: Edmund C. Merem , Department of Urban and Regional Planning, Jackson State University, 3825 Ridgewood Road, Box 23 Jackson, MS 39211 USA.
| Email: |  |
Copyright © 2012 Scientific & Academic Publishing. All Rights Reserved.
This research assesses the vulnerability of coastal areas in the Southeastern states of Mississippi and Louisiana using climate risk information. Emphasis is on the issues, and evaluation of the trends. In terms of methods, the paper uses GIS and descriptive statistics to map the trends. In the last several years, climate change impact continues to be felt in the Southeast especially the coastal zones. It has been predicted by scientists that many people could be affected by the impact of climate change risks in the Southeast coastal zones mostly from storms, high and extreme temperatures and others. As one of the most sensitive and vulnerable systems, coastal zones’ areas of concern include sea level rise, land loss, frequency of maritime storms, flooding and responses to sea level rise. Addressing the challenges associated with the threats of climate change in coastal areas of Mississippi and Louisiana, requires periodic assessment of the risks using geographic information systems. Without access to sufficient climate risk information management tools to measure the precise vulnerability of coastal zones areas, the emergency preparedness of managers and cities in the homeland to mitigate the dangers posed to infrastructure, human lives and the economy will be diminished. The results show a spatial diffusion and a growing risk in vulnerable coastal areas in the two states. Utilizing climate risk data and GIS techniques to analyze the dangers faced in coastal cities helps minimize their vulnerability in the region and the homeland. The paper suggests the need for constant assessment, bioinformatics education and GIS mapping of the risks.
Keywords: GIS, Climate Change, South East, Coastal Zones, Climate Risks, Emergency Preparedness, Homeland
Cite this paper: Edmund C. Merem , Raphael Isokpehi , Daphine Foster , Joan Wesley , Jasmine Williams-Washington , Emmanuel Nwagboso , Chandra Richardson , Coney Romorno , Marshand Crisler , Keishelle Jones , "The Applications of Geo-Info Systems in Gauging the Susceptibility of Coastal Areas in Louisiana and Mississippi", American Journal of Geographic Information System, Vol. 1 No. 3, 2012, pp. 49-65. doi: 10.5923/j.ajgis.20120103.03.
Article Outline
1. Introduction and Background Information
- This research assesses the vulnerability of coastal areas in the Southeastern states of Mississippi and Louisiana using climate risk information and GIS. Emphasis is on the issues, and evaluation of the trends. The South East Gulf coast region is endowed with ecological assets that support the region’s economic wealth[1]. In the last decades, human activities from the construction of dams to shoreline expansion have considerably changed natural landscapes, streams, and ecological processes. Pressures from human activities remain the most important agents of ecological change in the region today[2]. As we move further into the century, land-use changes are expected to rise as rapid population increase continues[3]. Global climate change, prompted by growing concentration of carbon dioxide and other heat trapping green house gases in the atmosphere, will combine with, and amplify, other human pressures on the Gulf Coast environments and the goods and services they offer[1,4,37]. Of the climate change scenarios in place, we must expect both warmer temperatures and rising rate of sea level over the next 100 years. Under these scenarios, summer high temperatures are projected to rise from 3 to 7 degree Fahrenheit and winter low temperatures to warm by as much as 5 degree Fahrenheit along the east and 10 degree Fahrenheit in the west. This will bring a remarkable growth in the July heat index in the Gulf coast of the south east[1]. Accordingly, the global sea level rise will affect the Gulf coast shoreline due to its flat topography, regional land subsidence, widespread shoreline development, and vulnerability to major storms[5]. Elsewhere climate models predict 8 to almost 20 inches sea –level rise along the Gulf coast in the next century[6]. Taking regional subsidence into account, the anticipated sea–level rise over the next 100 years could range from 15 inches in most of the Gulf Coast to as much as 44 inches along the Louisiana/ Mississippi Delta[1,7,8,9].Accordingly, in the last several years, climate change impact continues to be felt in the Southeast especially the coastal zones[10]. It has been predicted by scientists that many people could be affected by the impact of climate change risks in the Southeast coastal zones mostly from storms, high and extreme temperatures and others[1,7,8, 11,4]. As one of the most sensitive and vulnerable systems, coastal zones’ areas of concern include sea level rise and the responses to it, land loss, frequency of maritime storms and flooding[12]. To put the climate change parameters into perspective, one needs to consider the trends in the past few years. At a time when Hurricane Katrina left behind debris, downed trees, and prompted soil erosion in its path, the Mississippi Department of Marine Coastal Preserves Program (DMR) was faced with a daunting task. In the aftermath, the DMR Coastal Preserves Program not only devoted available resources to restoring and protecting the Mississippi Gulf Coast’s sensitive habitats, but the challenges for emergency preparedness and managers grew due to the impacts of the hurricane[13]. Regrettably, the huge toll from the disaster can be seen from the decimation of vital ecological features known to provide habitats and refuge for biodiversity and wildlife. These include the bayous, beaches, dunes, marshes, pine savannas and coastal forests in the area[14,15, 16]. Other notable impacts comprise of the dangers posed by big areas of fallen trees, shredded and tattered marsh, and debris loads covering huge areas, erosion of beaches and small creeks congested with debris and fallen trees. Furthermore, before Hurricane Katrina struck, Mississippi contained probably 3,000 acres of sea grasses. In going by current estimations, between 60 to 90% of the state’s sea grasses were either damaged or had vanished[14]). Louisiana as the home to the Globe’s seventh biggest delta is losing 25 to 50 square miles annually. Coastal Louisiana has already lost 1.2 million areas of wetlands this century and is losing additional 24 square miles of wetlands each year. Should climate change continue at the present pace, 70 percent of Louisiana’s remaining coastal wetlands would vanish by the end of the century. This will threaten numerous species. At the same time, continual sea level rise will considerably change the shape of Louisiana’s coast line devastating vital wetlands and letting saltwater seep into fresh water bodies, including crawfish ponds. Higher sea levels also imply higher storm surges that may arrive further inland. Global warming is expected to accelerate this trend in the coming decades making it even harder for waterfowl and other wildlife to thrive in the state[17,18]. Southern Louisiana is the most endangered land in the US, this has caused a net sinking of the land which in turn causes the wetlands on the Louisiana coast to recede inland as land sinks from under them. As Hurricane Katrina has shown, when these areas flood, they entrap residents and require enormous time to dry. With climate change pushing the pace of ocean rise, this would quicken the retreat of the wetlands and further raise the vulnerability of New Orleans[19,20]. It is projected to increase sea level by 3-10mm annually in the next five decades. This, combined with the subsidence of the Louisiana’s deltaic coast, possibly will result in sea level rise in the Gulf of Mexico. The sea level rise will range between 60 to180 cm higher in the next century than they are today.Judging from the current land loss rate, by the year 2050 Louisiana will have lost an additional one million acres of coastal wetlands[21,22]. In addition, the sea will continue to move further inland by as much as 33 miles during this period, transforming previously productive wetlands into open water and leaving New Orleans more exposed to sea flooding and hurricanes[9]. Several sources in the literature such as Greenland[23]; Alford[24] and Simas[25] have also reaffirmed the growing vulnerability of the State of Louisiana to the threats of climate change, in terms of the risks to sugarcane production in the producing areas as well as the evidence of river meander scars and the impacts on coastal marshes.In the absence of periodic applications of Geographic Information Systems (GIS) as a decision support tool to gauge vulnerability, decision makers and emergency managers risk overlooking the spatial locations and severity of these problems. This can accentuate the loss of lives in built environments and the degradation of natural areas in coastal environments of the region where the risks of climatic change run high. The previous applications of GIS through other studies in the South east region of the US brought enormous benefits such as the spatial display of the emerging vulnerabilities. However, none of those studies focused solely on climatic variability and recurrent issues in the states of Louisiana and Mississippi. This research will fill that void in the literature. Detailed analysis through multiple studies of other GIS based applications to environmental change can be found under various years in the work of Merem and Twumasi[26, 27, 28,29].
1.1. Objectives and Organization
- The research has four objectives. The first aim is to analyze the current issues in climate risks. The second objective assesses the risks posed to the South East region while the third objective is centred on the evaluation of the potential climate hazards in the region. The fourth and last objective focuses on the identification of mitigation measures and the design of a decision support tool for emergency preparedness and homeland security policy makers. The paper is divided into five areas with the first area focusing on the introduction and background information. The second section describes the methods and the study area while the third section presents the results and the evaluation of the trends. The forth section presents a discussion and findings of the research. The fifth and last section provides a closure and the future lines of action.
2. Methods and Study Area
- The method used in the study stresses the applications of Geographic Information Systems (GIS), spatial mapping and descriptive statistics in assessing climate change vulnerabilities of coastal counties in the study area of Mississippi and Louisiana. Addressing the challenges associated with the threats of climate change in coastal areas of Mississippi and Louisiana, requires periodic assessment of these risks using geographic information systems. Without access to sufficient climate risk information management tools to measure the precise vulnerability of coastal zones areas, the ability of emergency managers and cities to mitigate the dangers posed to infrastructure, human lives and the economy will be diminished. The paper uses climate risk information and related statistics based on descriptive statistics and Geographic Information Systems (GIS) to display the trends spatially.The initial step involves the identification of variables needed at the county and state level from the various years. These variables are needed to assesss climate change hazards at the county and state level. The variables consist of socio-economic and environmental information including wetland area, water area, land area of costal land, land area change, percentage of land area, farm income, population, damages from storms and hurricanes, number of hurricanes, their impacts, and risk level. The design of spatial data needed for the GIS analysis required the identification of appropriate digital county boundary lines covering the study periods. This entailed the assemblage of the electronic version of available hydrological and land cover and base maps. This process helped in the identification of risks impacting the land base and the natural environment of coastal areas in the states of Mississippi and Louisiana for the different periods. This was made possible by the retrieval of spatial data sets of shape and grid files from the Louisiana Strategic Online Resource Information Systems (SONRIS) and Mississippi Automated Resource Information System (MARIS) in digital form using ARCVIEW GIS. Other sources of data include NOAA, FEMA and the USGS. Given that the official boundary lines between several counties in the states stayed stable, it was possible to assign consistent geographic identifier code to the respective units in order to maintain analytical coherency. In the second stage, basic descriptive statistics was employed to transform the original data on environmental variables into relative forms. The statistical output of the variables from the spatial units were mapped and compared across time in ARCVIEW GIS. The process helped delineate the spatial locations and patterns of vulnerability, and the distribution of the risks within the study area across time.
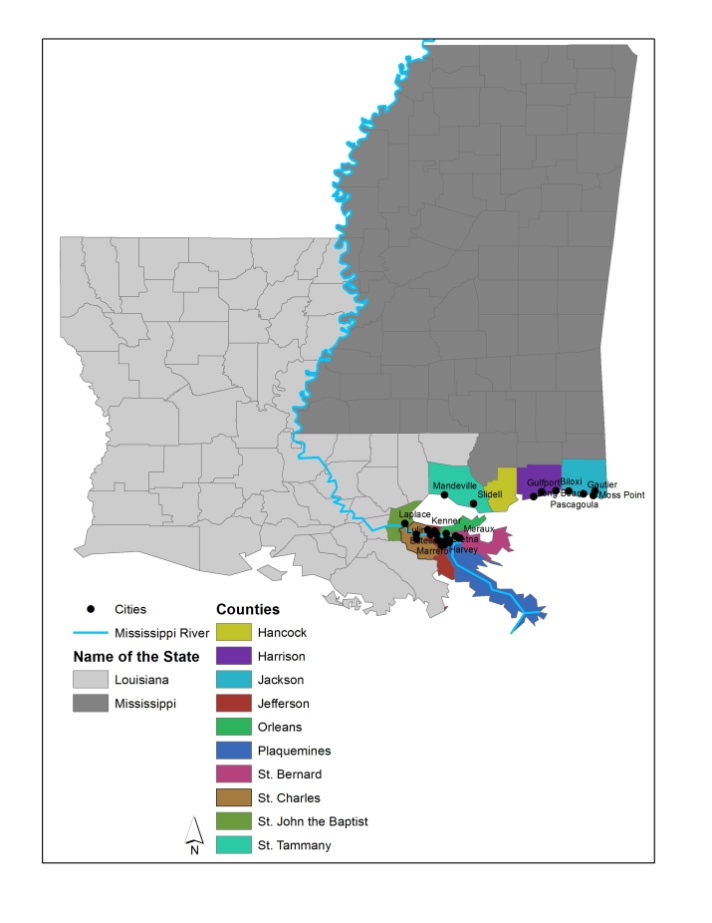
2.1. Study Area Description
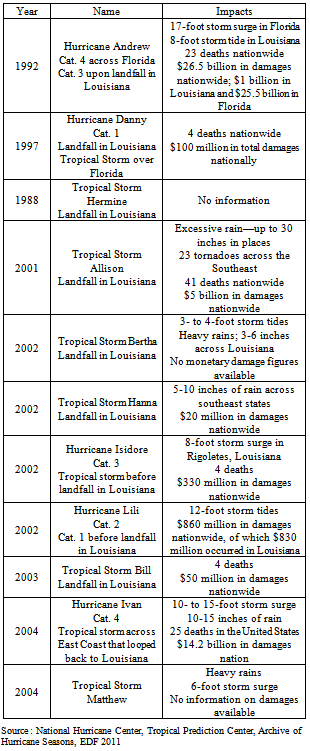
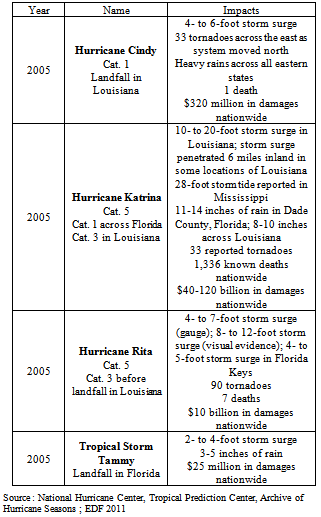
- The study area is the coastal areas of the south east states of Mississippi and Louisiana on the lower side of the condensed maps in Figure 1. The core cities in the coastal areas extend through the Mississippi River and the Gulf of Mexico. The Gulf of Mexico is characterized by the frequent occurrence of hurricanes. Sizable hurricanes have made landing in the Gulf Coast every year since 1994, with 26 named storms and 14 hurricanes occurring. From the census figures of 2010, the two states have a combined population of about 7 million. Over the decades beginning from 1970 to 2010, the area has witnessed consistent population changes with the decades of 2000, and the 2010 being a period with more increases in population (Table 1). With the coastal areas of both states, known for their natural attractions, they continue to be centers of large development often threatened by extreme climate change. Generally both coastal areas before hurricane Katrina had a population of almost 2 million. The breakdown shows a population of 1.4 million for coastal Louisiana and almost half a million for South Mississippi coastal area.
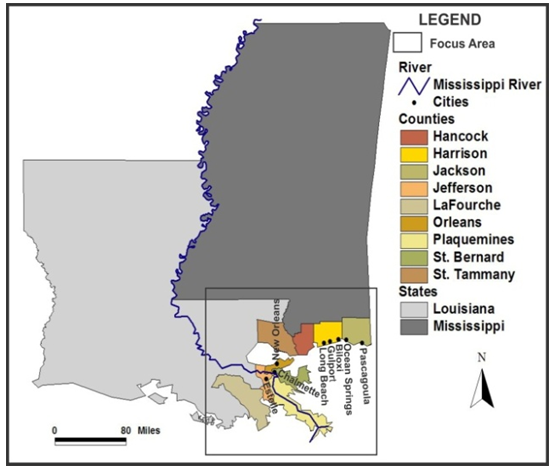 | Figure 1. Condensed Maps of Louisiana and Mississippi |
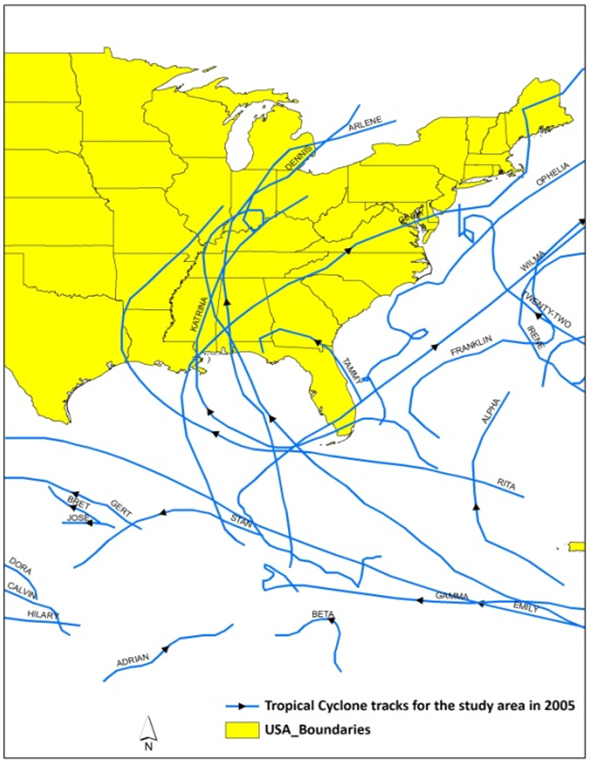 | Figure 1.1. The Paths of Tropical Cyclone For The Study Area In 2005 |
3. The Results of Environmental Analysis of the Risks
|
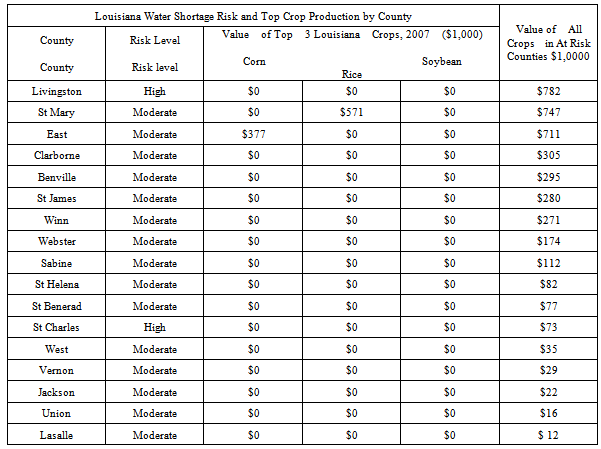
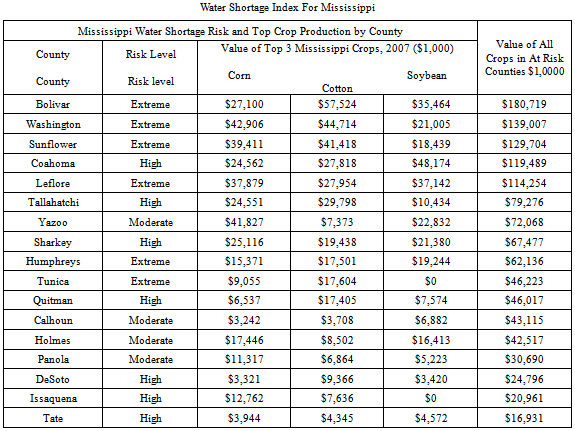
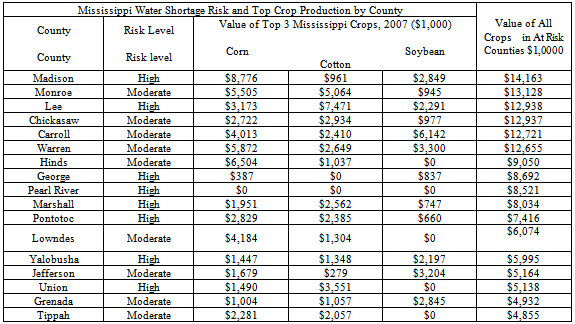
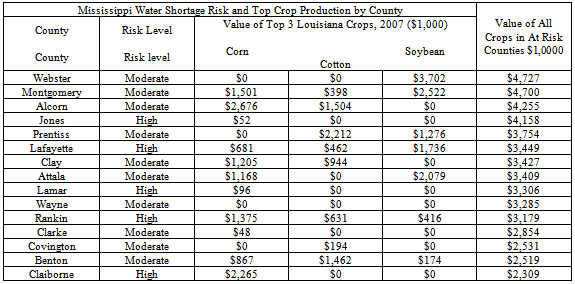
3.1. Agriculture and Water Scarcity
|
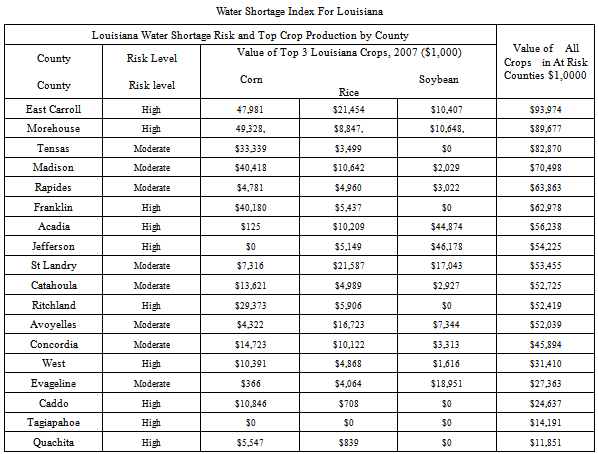
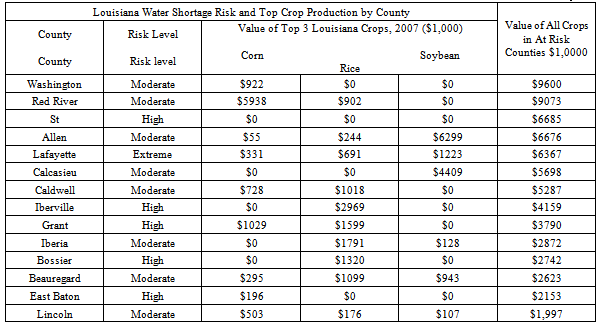
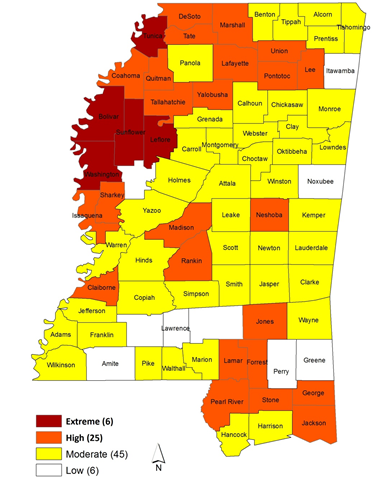 | Figure 2. Projected Climate Change Impacts On Water Access In Mississippi |
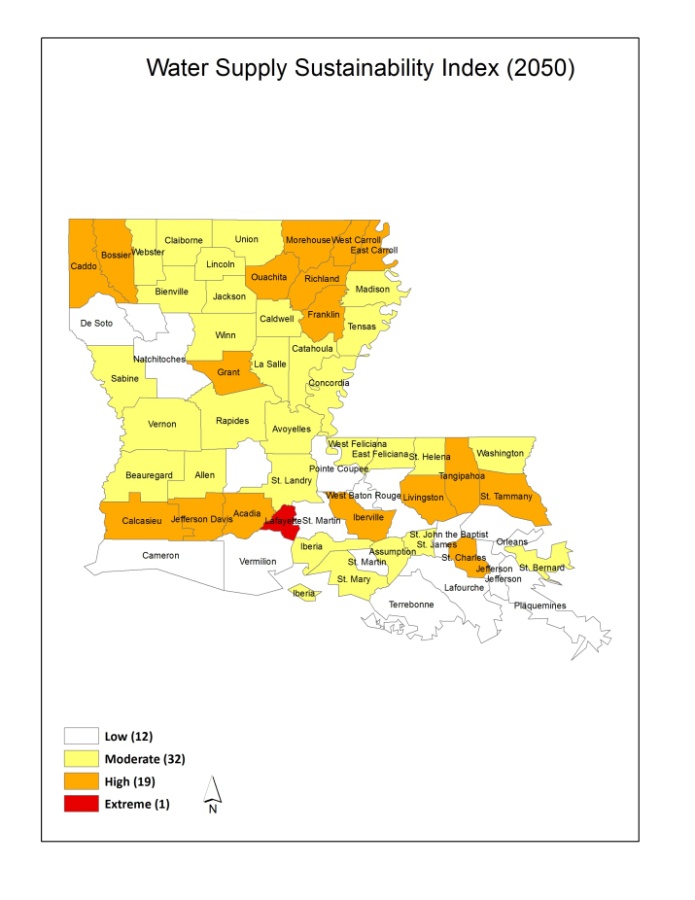 | Figure 2.1. Projected Climate Change Impacts on Water Access in Louisiana |
3.2. Agriculture and forestry
- Agriculture and forestry are enormously important industries in both states. While in Louisiana they contribute over 10 billion each year to the state’s economy, the state of Mississippi earned about $7.1 billion from forestry most notably the managed shortleaf and loblolly pine. Each is very sensitive to climate change. In the delta region, where drier conditions are expected, rice farming will likely decrease, given its sensitivity to increased salinity. Under the drier conditions, extra irrigation will be essential to maintain the production of cotton, soybean, sorghum, hay, sugar cane and vegetables. Considering that the fertilization effect from elevated levels of C02 can only raise productivity with sufficient irrigation. In the absence of adequate irrigation water, production would diminish at present levels. The managed short leaf and loblolly pine tree forests in Louisiana which contributed $7.1 billion in 1997 are at risk to drought and fire in areas projected to go arid. With elevated temperature, the capacity of trees to take in carbon wanes. Savannahs and grasslands in both states will increase at the expense of forests, mostly in areas further inland from the coast if drier climates scenario were to play out. Wetter climate conditions, on the other hand would boost the productivity of hardwoods at the expense of softwoods, but will also favor the influx of forest pest such as Southern pine bark beetle[32].Additionally, agriculture in the southern part of the state would probably feel the greatest impacts of sea-level rise. This would affect the hydrology of low-lying coastal soils. Rice farmers in coastal parishes would be affected enormously by sea-level rise and elevated risks of salinity in groundwater (Figure 2.2). While warmer temperatures could boost citrus production in Plaquemines and St. Bernard Parishes, coastal land loss and salt water intrusion continue to adversely impact farmers in the area. With livestock accounting for 33% of agricultural value in Louisiana, they are quite vulnerable to drought and other extreme climate conditions. Cattle farming in Vermillion Parish were plagued in September of 1998 by swarms of mosquitoes after a long-drawn-out down pour. The same flood water on which the mosquitoes hatched not only destroyed pasture grass, the rye grass essential for winter pasture became endangered by brackish water as well[33,34;].
 | Figure 2.2. Location of Climate Change Impacts in Agriculture, Forestry and Areas Vulnerable to Land loss, Seas Level Rise and Coastal Development Infrastructure Impact |
3.3. Coastal Landloss
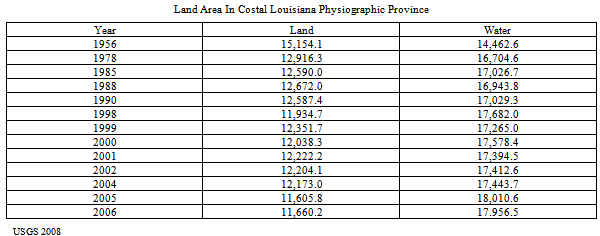
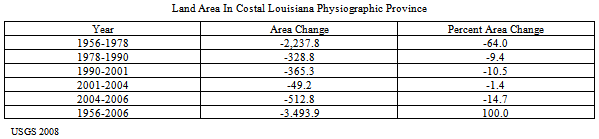
- Over the last two centuries, navigation channel dredging, oil and gas exploration and production, land reclamation, and the building of industrial facilities have damaged the Louisiana coastal region. This has resulted in primary and secondary wetland losses. These actions have impeded fresh accretion, lessened freshwater inflow and amplified saltwater intrusion. Other problems such as accelerated wave energies on delicate interior marsh substrate have damaged growing vegetation which would otherwise have held sediments and produced organic matter. Projecting the current land loss rate in the context of the future, by the year 2050, Louisiana will have lost over one million acres of coastal wetlands, this is bigger than the State of Delaware. At the same time, the Gulf of Mexico will continue to move forward inland at the rate of 33 miles during this period. This would gradually transform functional wetlands into open water that would keep major towns, like New Orleans and Houma, vulnerable to open waves and violent storms of the Gulf of Mexico[19].Figure 2.3 highlights a spatial distribution of actual and projected land gains and loss in coastal Louisiana between 1932 through 2050 in red, yellow, light green and dark green. The actual and projected land loss in red and yellow seem fully concentrated along the south west and south east portion of the state. Note also that minor patches of gains and anticipated gains remained visible in the same geographic locations in the map. The map legend indicates, there exists ample diffusion of the land loss trend prompted by climate change. This is much evident in the Terrabone Bay area, Grand Isle, and the Brenton Sound side of the study area. Another twisting to the trend, is that while there seemed to be more losses than gains, the projected land losses in space outnumber the gains by a much wider margin. See also the pace at which south Louisiana shorelines and the drifting of coastal land into the sea is occurring. Note also that much of the projected coastal land loses identified in red and yellow are within the areas located around the coastal counties adjacent to the Mississippi river portion of the state and the turbulent Gulf of Mexico prone to violent storms. For additional information, see Appendices C and D on the land distribution and the losses along the costal Louisiana physiographic region from 1956 to 2006.
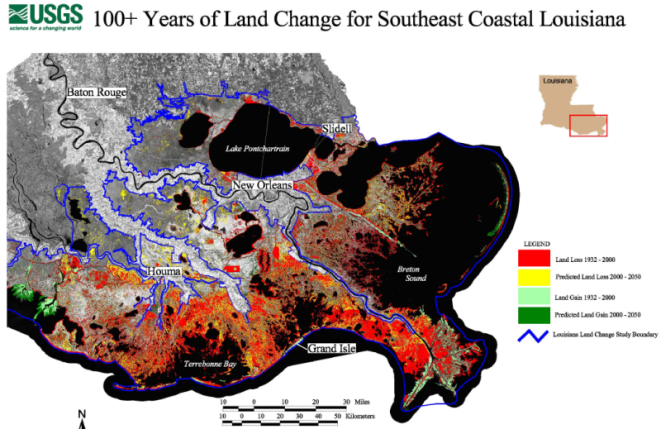 | Figure 2.3. Projected Coastal Land Loss in Louisiana (Source: USGS) |
3.4. Coastal Development and Infrastructure and Sea Level Rise
- As development and economic activity in coastal areas has increased, so, too, has societal vulnerability to coastal hazards. Global climate change will likely exacerbate that vulnerability. Essentially, the area South of New Orleans, which is highly developed for residential, industrial and tourism activities coupled with the international sea ports of New Orleans and Baton Rouge which operate as important transportation hubs with other smaller docks remain vulnerable. While much of the coastal fringe of Louisiana and Mississippi is rural and not overly developed, their low lying areas face growing challenges from sea level rise. Additionally, accelerating sea level rise due to global warming will heighten the pace of erosion. This is already a major threat to residences, roads and other infrastructures along the shorelines of Louisiana’s barrier Islands such as Grand Isle.Accordingly, Gulfport, Biloxi, and other sea ports and coastal communities in Mississippi which are highly developed for residences, industry and tourism are also at risk. Similarly, the anticipated change as a result of erosion, also threatens Mississippi’s barrier Islands such as the Ship Island and the mainland coast near Gulfport and Biloxi. Accelerating sea level rise will also increase storm surges as hurricanes become intense. Consequently bigger economic losses from storms, as well as higher restoration and protection expenses would rise in the coming years. Should barrier islands and wetlands disappear as shields during major storms, storm surge heights of 3-6 feet could reach as far inland as West bank communities across the river from New Orleans. With the gravity of these threats looming, current storm protection measures could be greatly overwhelmed. This is further compounded with the projected drifting of the coastal deltaic areas in 2050. As shown on the map and captured in different colors of dark red and orange, Louisiana deltaic coastline wetlands would experience severe submersion. Areas such as New Orleans could see sea level rise of 4.6 feet. The risks are compared with the current levels of the coast on a scale of 1 to 3.3 feet relative sea level by 2100. Note that areas such as New Orleans and Lake Pontchartrain are within 1-3.3 feet below sea level (Figure 2.4). Such high risks for New Orleans, puts the state in the sole category of having the highest sea level submersion scale in the nation.
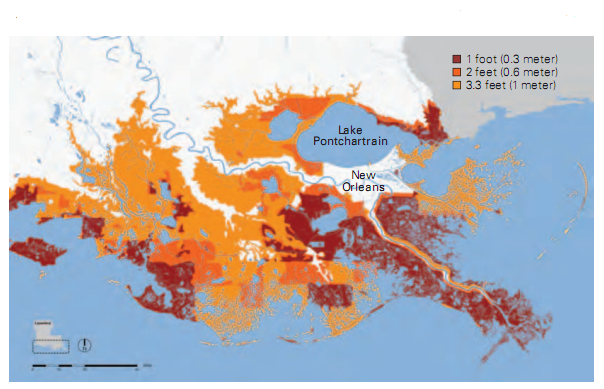 | Figure 2.4. Anticipated Coastal Wetlands Submersion at 1 to 3.3 feet relative sea level by 2100 For Louisiana |
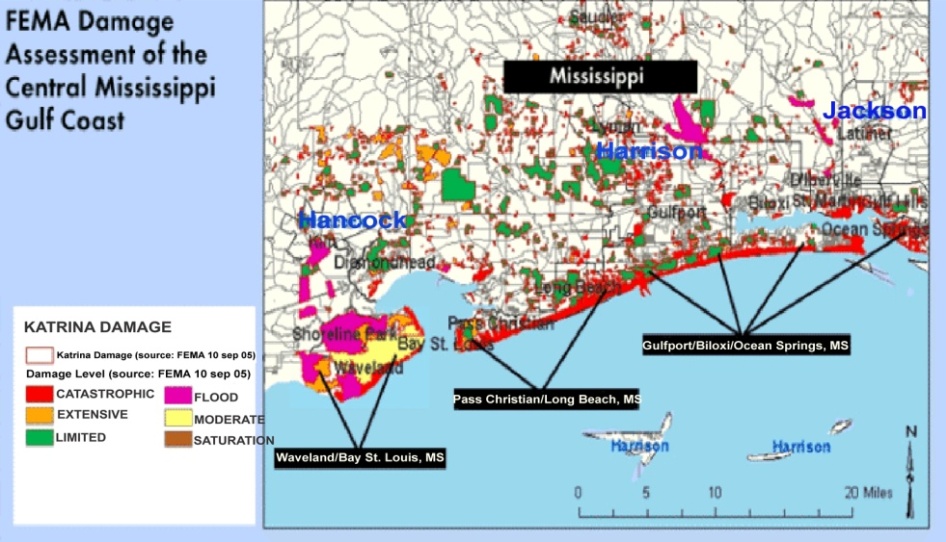 | Figure 2.5. Damage Assessment of Southern Mississippi in 2005 During Hurricane Katrina |
4. Discussions and Findings
- From the analysis, coastal areas in the study area remain quite vulnerable to the threats of changing weather patterns unleashed from climate change. This continues to be felt in various forms along the Southeast region especially the coastal zones of Louisiana and Mississippi. This section of the paper offers a synopsis of the findings and the results of the data analysis. Overall, the study area has experienced numerous cases of changing weather patterns along the coastal environment. This is evident with recurrent cases of storms and cyclones as shown in the study area analysis. Regarding, the issue of anticipated water shortage in agriculture, the paper shows that at- risk counties in Louisiana and Mississippi will not only be threatened, but their current agricultural operations and practices, and the local commerce remains highly vulnerable in 2050 should the scale of anticipated climate change scenario hold.Another thing to glean from spatial distribution of these risks in 2050, is the vicinity of the at risk counties to the major aquifers of the state as well. With the current demands and pumpage levels of ground water for agricultural activities becoming overly high in the states due to competing demands from the other sectors of the economy, including residential, industrial and the others. The adjoining aquifers and underground water bodies face the intrusion of salt water. This would likely compound the problems in areas where farm products and the ecosystem have low tolerance for the excessive levels of salt water intrusion most likely to emerge from rising temperatures in these areas.From the analysis, coastal land loss is another area of concern in the study area of Louisiana and Mississippi. If global warming continues at the current rate, 70 percent of Louisiana’s remaining coastal wetlands will be gone by the end of the century. This will endanger many species and the sensitive habitats that provide these creatures critical refuge. More so, continued sea level rise will dramatically alter the shape of Louisiana’s coast line destroying more critical wetlands and letting saltwater seep into fresh water bodies, including crawfish ponds. Higher sea levels also mean higher storm surges further inland. In addition, the Gulf of Mexico will continue to advance inland at a rate of 33 miles during this period, turning previously functional wetlands into open water. This will keep major towns and cities, such as New Orleans and Houma, exposed to violent storms from the Gulf of Mexico. The state of Mississippi comprises of many diverse upland and wetland habitats; but nowhere in the state can you find habitats, that are more functionally important than the dynamic coastal wetland habitats located along the beautiful Mississippi Gulf coast in Hancock, Harrison and Jackson counties. Considering the role of the ecosystem in providing habitats for biodiversity, the south Mississippi coastal areas have also experienced their own share of wetland loss. These habitats are also under the threats of human activities as well as climate change risk factors. The marshes of Point Aux Chenes Bay, Jackson County are being eroded away faster than any other marsh area in the state of Mississippi. This poses a major threat to the stability of coastal ecosystem. The problems of the study area are further compounded by the growth in infrastructure development within the coastal counties prone to the threats of the rising sea levels and sea surge prompted by hurricanes and costal storms. In 2005, both natural and built environments in coastal areas of Mississippi and Louisiana were severely obliterated by Hurricane Katrina. Future climate projections for the area show that, the intensity of these hazards would grow much stronger in the coming decades. Furthermore, fresh water ecosystem, aquaculture and fishery and human health in coastal areas of the study area are all at high risk from climate change in the coming years. Judging from the extent of spatial distribution of the trends and the risk levels projected for the coastal areas of the two states, it is evident, that addressing the challenges associated with the threats of climate change in coastal areas of Mississippi and Louisiana, requires periodic assessment of the risks using geographic information systems. From the spatial mapping of the trend using GIS, the results show a spatial diffusion and a growing risk in the coastal areas of the two states. Much of the damages suffered during hurricanes showed more concentration in the coastal areas of the study area. Projected losses of coastal marshes, and land stayed firm in the areas adjoining coastal zones of both states. In other words, there seem to be a coastal flavor to the impending risks from the projected climate change for the area. Without access to spatial data sets and mappings made possible through GIS, the ability of emergency mangers to predict and locate these risks across space would have been difficult. Therefore, utilizing climate risk data and GIS techniques to analyze the dangers faced in coastal cities of the study area assists emergency planners in the homeland in making quick judgments about mitigation measures. This helps in minimizing the vulnerability of the areas herein analyzed. In terms of future lines of action and recommendations, the paper suggests the need for continuous assessment, bioinformatics education, emergency planning, regular tracking of climate change and mapping of the risks in the years ahead. This will also benefit those in charge of emergency preparedness in homeland security.In light of these findings, the practical use of a mix scale approach involving primary data and GIS quickened the analysis and spatial location of environmental vulnerabilities associated with climate change risk factors and other elements caused by the impacts of development activities. In helping track costal ecological change, this approach stands as an update to the current literature on the assessment of risks in coastal ecosystems such as the South east region of Mississippi and Louisiana. Considering that minor efforts were made in the past to examine climate change issues and the risks to the South east regional ecosystem. GIS technology as used in this paper has fulfilled a useful purpose in mapping the current problems, the impending risks and their locations in the study area. Accordingly, the paper stands as an effective tool for climate risk management and environmental monitoring in a coastal ecosystem. Integrated data analysis using climate risk information and GIS analysis facilitated the analysis of the spatial diffusion of climate risks threatening the coastal areas of Louisiana and Mississippi.
5. Conclusions
- This research began by assessing the vulnerability of coastal areas in the Southeastern states of Mississippi and Louisiana using climate risk information. The paper identified the prevailing issues, and the evaluation of the trends. To analyze the trends, the project adopted the mix scale methods of GIS connected to descriptive statistics to map the trends. Based on the analysis, it is evident that, the study area’s coastal regions continued to experience the risk posed by climate change impact. The extent of these risks in the Southeast states of Mississippi and Louisiana especially the coastal zones can be manifested by the intensity of anticipated hazards likely to ravage both the natural and built environments in the area.The current and anticipated vulnerabilities on the Southeast coastal zones of Louisiana and Mississippi would stem from a variety of risk factors. The risks would mostly come from storms, coastal land loss, and the loss of barrier islands, flooding, high and extreme temperatures and sea level rise. Other risk factors embody damages to fresh water ecosystem due to salt water intrusion, water scarcity in agriculture, threats to human health, and the growing hazards from coastal development in geologically unsteady terrains along the shorelines.Addressing the challenges associated with the threats of climate change in coastal areas of Mississippi and Louisiana, requires periodic assessment of the risks using geographic information systems. Without access to sufficient climate risk information management tools to measure the precise vulnerability of coastal zones areas, the ability of emergency managers and cities in the homeland to mitigate the dangers posed to infrastructure, human lives and the economy will be diminished. The results show a spatial diffusion and a growing risk in vulnerable coastal areas in the two states of the homeland. Utilizing climate risk data and GIS techniques to analyze the dangers faced in coastal cities of the study area helps minimize their vulnerability. The paper offered numerous suggestions including the need for continuous assessment and mapping of the risks.The practical applications of a mix scale approach involving Geographic information Systems (GIS), spatial mapping along with climate risk data, as analytical tools has added another dimension in the literature. This tool has been effective in detecting the vulnerabilities of coastal areas of Louisiana and Mississippi to the dangers of change and degradation prompted by coastal development and human activities. While the analysis showed some interesting results in the Southern east coastal Eco region of the US homeland. It is evident that descriptive statistics, climate risk data and spatial mapping and GIS quickened the detection of the geographic diffusion of the risks posed by water scarcity, wetland loss, coastal development infrastructure, the degradation unleashed from storms, sea level rise and others. In closing, it is our belief that successful implementation of some of the strategies outlined herein could lead to effective climate risk management in the South east region and the homeland.
APPENDIX
Appendix A
Appendix B
Appendix C
Appendix D
Appendix E
- Fisheries and AquacultureMississippi has the most valuable aquaculture industry in the United States, producing food fish, bait fish, shrimp, crawfish and Oysters with an annual value of $200 million. Here food safety and security is paramount for wellbeing of the ecosystem and society. The state also has the second largest fishing industry in the five Gulf States which extremely relies on intact coastal wetlands and clean coastal waters. Just as Mississippi, Louisiana has a lucrative fish and sea food industry. The state’s aquaculture, known for producing food fish, baitfish, shrimp, crawfish and Oysters is ranked seventh nationally in the nation. Coastal Louisiana the crayfish capital of the world is highly sensitive to changes in the availability of fresh water and to salt water intrusion into crayfish ponds. The growing pace of sea level rise and the drop in precipitation along the coastal areas will amplify the risks of permanent or occasional salt water intrusion in these ponds, thereby drastically affecting production in both states. Based on the existing climate models, there would also be higher salt concentrations, less nutrient input, less flushing and overall less quality water in the near shore waters in these areas as well. This would threaten food security, the health of the citizens and the ecosystem. Where the salt tolerance of species in marshes, mangroves and sea grass-beds is surpassed, changes in the food web and probable reduction in fish and shell fish production would occur in both states. Should wetlands migration occur inland as sea level rise continues, the yield of estuarine dependent fisheries, such as shrimp will either grow or drop depending on the dimension and quality of the new habitat across time. Fresh Water Resources The current population in the study area has been put at 2.8 million for Mississippi and 4.5 million for Louisiana. Both numbers are projected to increase to about 3.1 million in 2025 and 5.5 million in 2010 respectively. The states freshwater resources and habitats will be more and more used up for city development, agricultural irrigation, the containment of salt water intrusion into coastal aquifers, and aquaculture and the preservation of healthy ecosystems. These competing demands on limited freshwater will trigger fresh water resource challenges[36]. In the coastal areas, the threat to freshwater resources will come from the combined effect of salt water intrusion due to sea level rise and the projected decrease in rain fall. Salt water intrusion also threatens freshwater withdrawals from the Mississippi River and other areas such as Bayou Lafourche. As global warming continues, more climate extreme events will accelerate frequent run offs likely to over stretch sewage systems. This would result in the pollution of surface and coastal waters with grave consequences for public hygiene, the fishing sector and environmental security. Anywhere salt water intrudes into coastal ground water source as a result of sea level rise, fresh water resources could be at risk. Similarly, saltwater intrusion into fresh water marshes also impedes vegetation with low salt tolerance in a manner that alters the composition and functional capability of the ecosystems. Higher water temperatures will alter aquatic ecosystems by changing aquatic food webs and species communities. This will impact water quality by reducing the amount of dissolved oxygen with extreme cases of fish death[35,36]. In fact, increased salinity since the 1950 has resulted in the decline of bald cypress forests in Louisiana[2]. In the coming years, this would amplify the challenges of the homeland and environmental security officials in the coast.Human HealthHealth concerns related to global warming originate from a complex set of interacting human and environmental factors. These concerns are particularly serious for the elderly and other vulnerable populations, but air and water quality, seafood safety and storm related risks are a major concern for all residents and visitors. The July heat index is projected to increase mostly in the Southern United States. Metropolitan areas such as Baton Rouge, New Orleans, Shreveport and Jackson Mississippi are particularly vulnerable to more heat waves. Both states would experience rising number of heat related casualties especially among senior citizens and the population at the margin. In fact, poor and young people who are unable to protect themselves from heat waves would have hard times surviving. Rising temperature will also lead to increased production of ground level ozone, which, when mixed with elevated levels of air pollutants and higher pollen counts, could seriously diminish air quality.Cities such as Baton Rouge, already cited as in non-compliance with federal air quality standards, are likely to face even more, greater problems. Along Louisiana’s coast, viral and bacterial contamination of shell fish has repeatedly caused illness that resulted in the closure of vital fisheries. The protozoan Perkisnsus marinus is the most important pathogen threatening the Gulf’s oyster industry. The prevalence of P marinus has been linked to salinity and temperature fluctuations, with low temperatures and salinities limiting infections and higher temperatures and rising salinities usually increasing it. Climate change will likely create favourable conditions for the breeding of P marinas. This will in turn threaten the stability of marine ecosystem in the study area. Accordingly, bioinformatics analysis and management under the aegis of geo-information systems will be crucial in tracking these risks.
ACKNOWLEDGEMENTS
- The authors would like to thank the US Department of Home Land Security, Science and Technology Directorate for Award 2011-ST-062-000048. Disclaimer: the viewes and conclusions contained here are those of the authors and should not be interpreted as necessarily representing the oficial policies of the funding agencies.
References
| [1] | Twilley, R., 2001a. Confronting Climate Change In The Gulf Coast Region --- Prospects For Sustaining Our Ecological Heritage. Executive Summary, Cambridge, MA:The Union of Concerned Scientists, ix-xiv |
| [2] | Twilley, R., 2001a. Confronting Climate Change In The Gulf Coast Region --- Prospects For Sustaining Our Ecological Heritage. Chapter 1 Climate and People as Derivers of Ecosystem Change, Summary. Cambridge, MA:The Union of Concerned Scientists, pp 1-14 |
| [3] | Burkett, V., 2007. April. Hearing On The State of Climate Change Science 2007: The Findings of The Fourth Assessment Report By The Intergovernmental Panel On Climate Change Impacts, Adaptation and Vulnerability. 1-9 |
| [4] | Brown, O., 2006. Migration and Climate Change. International Journal For Migration, IOM Geneva. Switzerland |
| [5] | Tibbets, J., 2007 Winter. Rising Tide. Will Climate Change Drown Coastal Wetlands. Coastal Heritage. 21:1: 2-14 |
| [6] | NOAA Coastal Services Center., 2009 February. Local Strategies For Addressing Climate Change. Charleston, South Carolina: NOAA, pp 1-24 |
| [7] | Jacob, J., 2008. The Resilient Coast; Policy Frameworks For Adapting The Built Environment To Climate Change and Growth In Coastal Areas of The US Gulf of Mexico. Texas: A&M University pp 1-37. |
| [8] | Twilley, R., 2001b. Confronting Climate Change In The Gulf Coast Region --- Prospects For Sustaining Our Ecological Heritage, Louisiana. Cambridge, MA: The Union of Concerned Scientist, pp 1-4. |
| [9] | Twilley, R., 2001 c. Confronting Climate Change In The Gulf Coast Region --- Prospects For Sustaining Our Ecological Heritage. Mississippi The Union of Concerned Scientist, Cambridge, MA: pp 1-4. |
| [10] | Anthony, A., 2009. Coastal Lagoons and Climate Change: Ecological and Social Revivifications In US. Atlantic and Gulf Coast Ecosystems. Ecology and Society 14:18;1-30 |
| [11] | Jacob, J., 2007. The Resilient Coast; Policy Frameworks For Adapting The Built Environment To Climate Change and Growth In Coastal Areas of The US Gulf of Mexico. Texas: A&M University, pp 3-40. |
| [12] | Digg, M., 2001.---- Climate Change What Will it Mean For Louisiana’s Coastal Fisheries. |
| [13] | Rubunioff, P., 2008 February. Summary of Coastal Program Initiatives That Address Sea Level Rise As a Result of Climate Change. Rhode Island Sea Grant / Coastal Resources Center. University of Rhode Island, RI: pp 1-50. |
| [14] | Louisiana –Mississippi Gulf Coast Ecosystem Restoration Working Group, 2010 March. Roadmap For Restoring Ecosystem Resiliency and Sustainability, pp 1-8. |
| [15] | Mississippi Department of Marie Resources, 2005 Fall. Coastal Markers, 9:2:1-9 |
| [16] | USGS, 2010 December. Forecasting The Effects of Land Use and Climate Change On Wildlife Communities and Habitats In The Lower Mississippi Valley, US Department of Interior. Fact Sheet 201. 12-3112. |
| [17] | USGS, 2010. Coastal Change Hazards: Hurricanes and Extreme Storms. St Petersburg Coastal and Marine Science Center. St Petersburg, Florida: US Department of Interior pp 1-6.. |
| [18] | Natural Wildlife Federation, 2009. |
| [19] | Twilley, R., 2007 December. Environment: Coastal Wetlands and Global Climate Change. Gulf Coast Wetland Sustainability In a Changing Climate. Baton Rouge Louisiana: Louisiana State University/Pew Center, pp 1-18. |
| [20] | Carbonnel, A., 2009. Climate Change and The Resilience of New Orleans: The Adaptation of Deltaic Urban Form. Lincoln Land Institute, Cambridge, MA: pp 1-35. |
| [21] | Kazmieczak, A., 2010. New Orleans: Preserving The Wetlands to Increase Climate Change Resilience. Adaptation to Climate Change Using Green and Blue Infrastructure: A Database of Case Studies, City of New Orleans Planning Team. New Orleans, LA: pp 1-10 |
| [22] | USGS, 2008. Land Area Change In Coastal Louisiana: A Multidecadal Perspective: From 1956 to 2006. US Department of Interior; Reston, Virginia: pp 1-6 |
| [23] | Greenland, D,. 2005 November. Climate Variability and Sugarcane Yield In Louisiana. Journal of Applied Meteorology 4:.1655-1666. |
| [24] | Alford, J., 1985. Meander Scars As Evidence of Major Climate Change In South West Louisiana. Journal of The American Association of Geographers 395-403. |
| [25] | Simas, T., 2001. Effects of Global Change On Coastal Salt Marshes. Ecological Modeling.139.1-15. |
| [26] | Merem, E.C. and Twumasi, Y.A, 2008 March a. Geospatial Information Systems Analysis of Regional Environmental Change Along The Savannah River Basin of Georgia; International Journal of Environmental Research and Public Health. 5: 1:281-294 |
| [27] | Merem, E.C. and Twumasi, Y.A., 2008 December 31st b. Using Spatial Information Technologies as Monitoring Devices In International Watershed Conservation along the Senegal River Basin of West Africa. The International Journal of Environmental Research and Public Health, 5:5: 464-476 |
| [28] | Merem, E.C. and Twumasi, Y.A., 2010 May. Using GIS In Environmental Management: Green Assessment of The Impacts of Petroleum Activities In The State of Texas. The International Journal of Environmental Research and Public Health, 7(5), 2101-2130. |
| [29] | Merem, E.C. and Twumasi, Y.A., 2011 June 23rd. The Applications of GIS in the Analysis of the Impacts of Human Activities on South Texas Watersheds International Journal of Environmental Research and Public Health 8(6), 2418-2446. |
| [30] | Environmental Defense Fund, 2010. Hurricanes and Climate Change; Louisiana’s Coast: What’s at Stake. EDF, New York, NY: pp 1-2. |
| [31] | Working Group For Post-Hurricane Planning For Louisiana Coast, 2006 January. A New Framework For Planning The Future of Coastal Louisiana After The Hurricanes of 2005. Integration and Application Network. University of Maryland Center For Environmental Science, Cambridge, Maryland: pp 1-48. |
| [32] | Kathryn, E.I., 2009. A Review of Land-cover Mapping Activities In Coastal Alabama and Mississippi. USGS-US Department of Interior, Reston, Virginia: pp 1-18. |
| [33] | Bloomfield, J., 2000. Impacts of Climate Change In The United Sates On Forests. Environmental Defense Fund. EDF, New York, NY: pp 1-6. |
| [34] | Tutwiler, M., 1999 May. Danger and Opportunity: Implications of Climate Change For Louisiana. A Report For Louisiana State Legislature To Fulfill House Concurrent Resolution 74, Regular Session. Legislative Study Group, HCR 74; Baton Rouge, LA. |
| [35] | Mississippi Department of Marie Resources, 1999 January. Mississippi’s Coastal Wetlands. Coastal Preserves Program. Biloxi, MS: pp 2-19. |
| [36] | Rabalais, N., 2009 March. Global Change and Eutrophication of Coastal Water. ICES Journal of Marine of Sciences .1-10. |
| [37] | Burkett, V., 2011. Potential Impacts of Climate Change and Variability On Transportation In The Gulf Coast / Mississippi Delta Region. USGS, Lafayette, LA. |
| [38] | Day, J., 2009 November. Biophysical Economics: The Mississippi Delta As A Lens For Global Issues. Earth Magazine, 1-5. |