-
Paper Information
- Next Paper
- Paper Submission
-
Journal Information
- About This Journal
- Editorial Board
- Current Issue
- Archive
- Author Guidelines
- Contact Us
American Journal of Geographic Information System
p-ISSN: 2163-1131 e-ISSN: 2163-114X
2012; 1(2): 17-28
doi: 10.5923/j.ajgis.20120102.01
Quantification of Land Transformation Using Remote Sensing and GIS Techniques
 Abstract
 Reference
 Full-Text PDF
 Full-Text HTML
Arshad Amin , Shahab Fazal
Department of Geography Aligarh Muslim University Aligarh 202002 India
Correspondence to: Arshad Amin , Department of Geography Aligarh Muslim University Aligarh 202002 India.
| Email: |  |
Copyright © 2012 Scientific & Academic Publishing. All Rights Reserved.
Urbanization is an inevitable part of economic development. Urbanization results in to changes in the landscape, specifically the proliferation of concrete and impervious surfaces, and the displacement of agriculture and forestland. Understanding these interactions between human activities and their consequences in landscape, is especially important in areas of the world that are experiencing rapid change, where the cumulative impacts of development may be realized too late to trigger mitigation measures. The present study of land transformation in Srinagar city aims to demonstrate the utility of integrating existing maps with the satellite data and related geographic information to dynamically map urban land transformation characteristics. This study provides a visual portrayal of growth and trends of transformation and conveys how the progress of modern urbanization results in changes to the landscape. The analysis revealed that there has been a large scale land use/land cover change and transformations in Srinagar city during the study period of 30 years (1981-2011). Such change was validated by carrying out the estimation of Land Consumption Rate and Land Absorption Coefficient. Moreover, the study also projects the likely changes that might occur till the year 2021. The projections for change by the year suggest that there will be further expansion of the city on the fertile agricultural fields in its fringe area as of 1981-2011 study period. This research work could present the diagnostic approach to the cause and effect relationship in in spatio temporal framework of urban geography.
Keywords: Urbanization, Economic Development, Landscape, Land Transformation, GIS
Article Outline
1. Introduction
- Rapid pace of urbanization is a global phenomenon in most of the developing countries. The urban population in these countries has grown by 40% between 1900 and 1975. Estimations suggest that 60% of the world’s population will be living in the urban areas by the year 2025[1]. Similarly, India experiences rapid growth of population and urban expansion which has become a serious issue for the environmental scientists because of the intensifying problems of urban congestion, poor housing, irregular and crowded transportation, lack of basic services and high employment rates. Urban growth brings the conversion of fertile agricultural area, vegetation and wetlands to urban areas, increase in impervious surfaces and even the extinction of few land use/cover features e.g., natural drainages[2,3].Land use/land cover pattern is an outcome of natural and socio-economic factors and their utilization by man in time and space. Land cover is the biophysical state of the earth’s surface and immediate subsurface[4]. It deals with, for example, the quantity and type of surface vegetation, water, and earth materials[5]. Land use concerns the function or purpose for which the land is used by the local human population and can be defined as the human activities which are directly related to land, making use of its resources or having an impact on them[6]. It is estimated that 1 to 2 million hectares of cropland is being converted to other urban land uses every year in developing countries to meet land demand for housing, infrastructure, industry and recreation[7]. Similarly, about 400,000 hectares of vegetation globally has been confirmed to be lost annually[8].The understanding of land use/cover change has moved from simplicity to greater realism and complexity over the last decades[9]. In 1991, a new and expanded approach to the study of global environmental change was attempted where global change scientists were joined by social scientists to examine both human causes and global consequences of altered land use pattern on the earth[5]. Improved understanding of the complex dynamic processes underlying land-use change will allow more reliable projections and more realistic scenarios of future changes. Crucial to projections is understanding of factors that control positive and negative feedback in land-use change. Similarly, understanding of processes of land-use change has led to a shift from a view condemning human impact on the environment as leading mostly to a deterioration of earth system processes to emphasis on the potential for ecological restoration through land management[10].Land use information can be used to develop solutions for natural resource management issues. Remote sensing (RS) and GIS techniques provide new tools for advanced land use management. GIS based multi-temporal land use data provides a historical vehicle for determining and evaluating long term changes in land use due to urbanization. The collection of remotely sensed data facilitates the synoptic analyses of Earth-system function, patterning, and change at local, regional and global scales over time; RS and GIS data also provides an important link between intensive, localized ecological research and regional, national and international conservation and management of biological diversity[11].However, the objective of the present study is to attempt mapping out the LULC status of Srinagar city between1981-2011 with a view of detecting the land consumption rate and land absorption coefficient. Lastly, the study tries to project the changes that might take place in the coming decade.
2. Study Area
- The study area is described in the following paragraphs:The present study is done on Srinagar city which lies between 33o59'14'' N and 34o12'37'' N latitude and 74o41'06'' E and 74o57'27'' E longitude. The city is located on both sides of the River Jhelum, locally called Vyeth in Kashmir (Figure 1), spreads between the plains of vale of Kashmir. It represents one of the, ecologically fragile, economically developing, tectonically unstable and one of the densely populated mountain ecosystems.
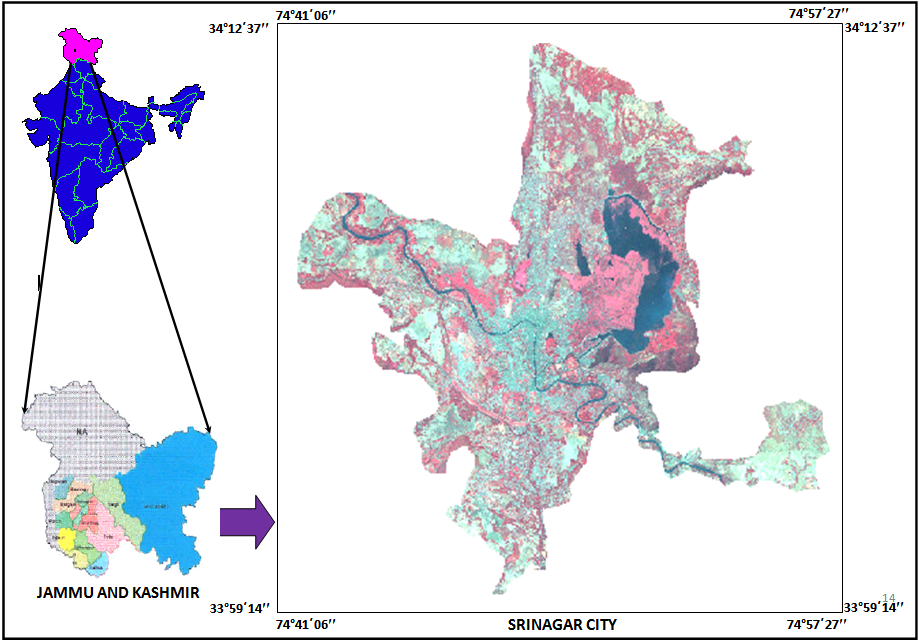 | Figure 1. Location map of srinagar city |
3. Data Sets and Methodology
- The data and the methodology used in this research work is explained in the below:The present study makes an attempt to evaluate the land use/land cover change and transformation and estimate the land consumption rate and land absorption ratio. The spatial data were developed for two points in time i.e., 1981 and 2011, processed in Geographic Information System (GIS). For the preparation of early date Land use/land cover of the study area, Town planning map of Srinagar city 1981 on 1:15,000 scale was used. Similarly, the land use land cover for the later date was carried out using IRS-1D LISS III + PAN 2011 merged satellite imagery procured from National Remote Sensing Agency, Hyderabad, India (Table 1). All data were developed into Universal Transverse Mercator (UTM) coordinate system, zone 43, with World Geocoded system (UTM WGS 84) projection parameters. Both the images were first geo-corrected and geo-referenced in Earth Resource Data Analysis System (ERDAS) Imagine 9.0 software. Further for assistance in the process of interpretation SOI toposheet No. 43J/16 was also geo-referenced and was given similar projection and datum. Satellite imagery was stacked into different bands to produce a false colour composite; the area of interest was extracted by sub-setting of the image. The area of interest (Municipal limits of Srinagar city) was extracted by sub-setting of the town planning map. The images were interpreted and then digitized in GIS environment using ArcGIS 9.3 software in the form of polygons representing different land use/land cover categories. Ground control points were determined from the field global positioning system readings. Road centrelines were digitized for all paved and unpaved roads at the time of map compilation. Level 1 classification system was followed and the data was classified into 9 land use land cover classes spread over a total area of 23446 hectares of the Srinagar city (which is also the Municipal limits). The trend and pattern of urban expansion was calculated and every polygon representing the particular class was quantified and displayed in respective maps. Further the study carried out the land transformation analysis by superimposing these two time period land use/cover maps in GIS environment. The objective was to fill a matrix showing transitions between the classified land use/cover categories.
4. Statistics Applied
- The statistical techniques applied in the present study are mentioned below:The comparison of the land use/land cover statistics assisted in identifying the percentage change, trend and rate of change between 1981 and 2011.In achieving this, the first task was to develop a table showing the area in hectares and the percentage change for each year (1981 and 2011) measured against each land use/land cover type. Percentage change to determine the trend of change can then be calculated by dividing observed change by the earlier area multiplied by 100.1. Percentage change (trend) =
 * 1002. Rate of change in percent is calculated as change in between the two study years per total change of these years divided by the time interval times 100.3. Land Consumption Rate =
  A = areal extent in hectares P = population4. Land Absorption Coefficient =
  A1 and A2 are the areal extents (in hectares) for the early and later years, and P1 and P2 are population figure for the early and later years respectively[12].● L.C.R = A measure of compactness which indicates a progressive spatial expansion of a city.● L.A.C = A measure of change in consumption of new urban land by each unit increase in urban population.The future expansion for the year 2021 was forecasted by correlating the current rate of expansion with the projected one. The 2021 population figures were estimated from the available 2011 population (provisional) figures of Srinagar city respectively for projecting the L.C.R and L.A.C. The first task to estimating the population figures was calculated by the formula below: n = r/100 * Po (1) Pn = Po + (n * t) (2) Where:Pn = estimated population (2021) Po = base year population (2011 population figure) r = growth rate (2%) n = annual population growtht = number of years projecting for
 5. Results and Discussions
- The results and discussions which came out from the present study are explained under the following sub heads:
5. 1. Land Use/Land Cover Distribution of Srinagar City
- Land use/cover was classified into 9 categories spread over 23446 hectares of Srinagar city conforming to the Municipal limits. These classes include, Built-up, Parks/Gardens & Playgrounds, Vacant, Agriculture, Plantation/Orchards, Forest, Barren, Marshy, Water body Figure 2 & 3). The rapid urbanization in the city has resulted into increase in built-up area and the resultant expansion (Figure 5). The statistics derived of different land use/cover classes is given in table 2 and the detailed explanation and the distribution of the above mentioned land use/land cover classes is given as follows:
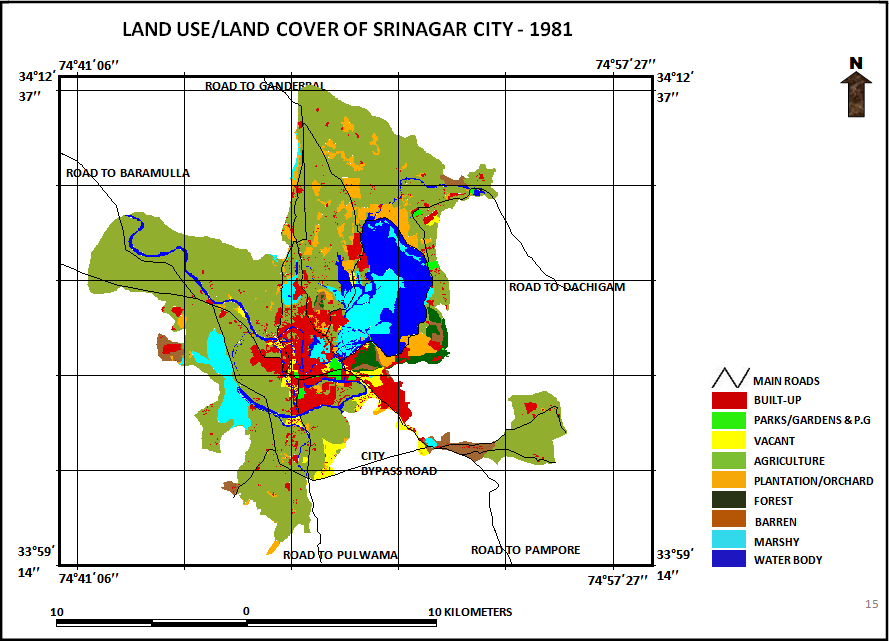 | Figure 2. Land use/land cover of srinagar city - 1981 |
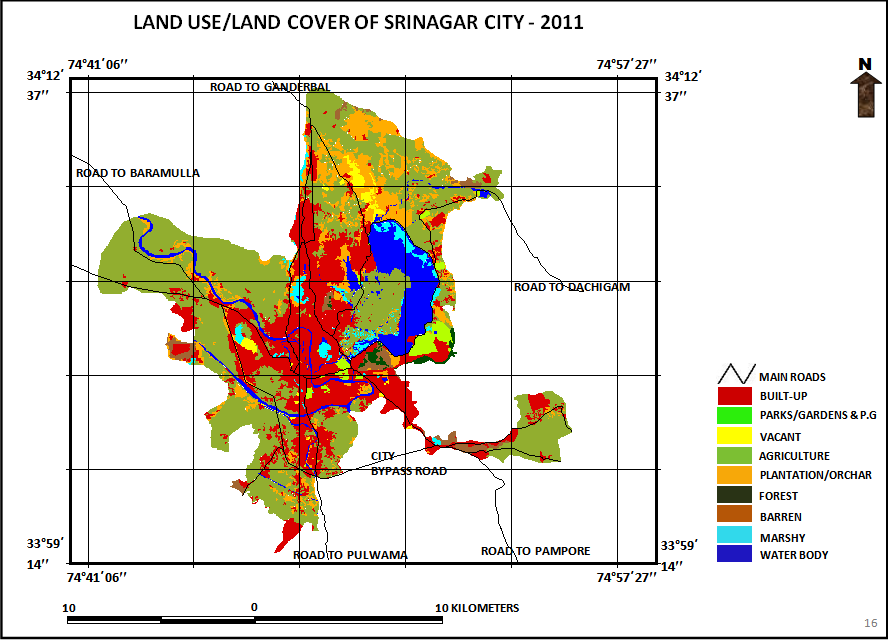 | Figure 3. Land use/land cover of srinagar city - 2011 |
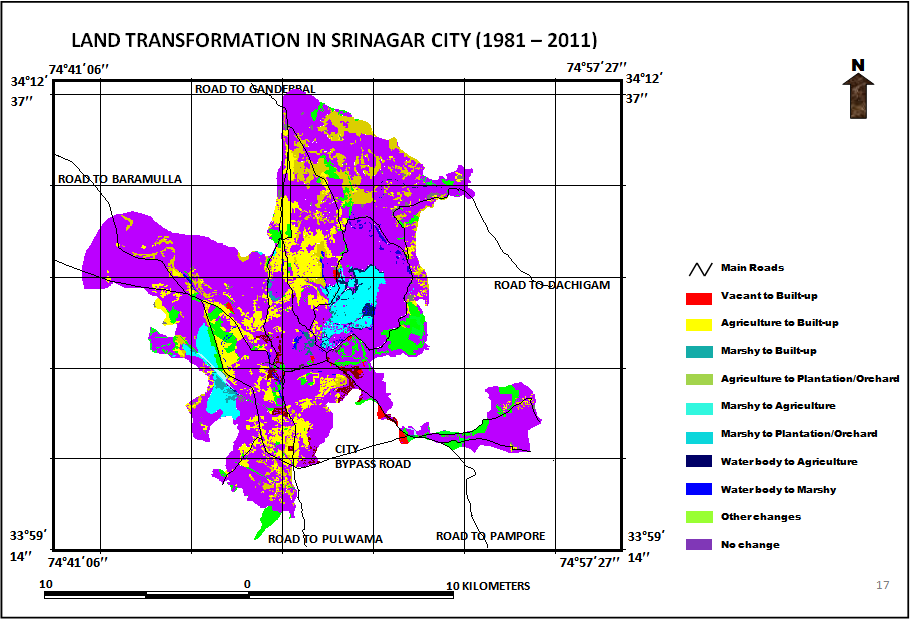 | Figure 4. Land transformation in srinagar city (1981 – 2011) |
|
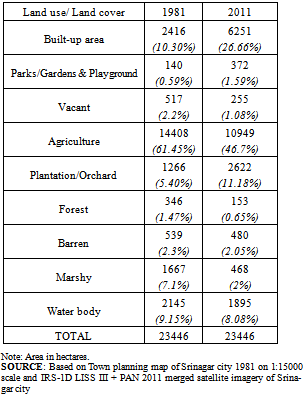
5.2. Land Use/Land Cover Change in Srinagar City
- During the study period significant changes in land use/land cover were witnessed in Srinagar city (Table 3) which are explained below:
|
5.2.1. Built Up
- In the present study, built-up includes area of intensive use with much of the land covered by structures i.e., residential, scattered settlement, commercial, industrial, restricted and others (Educational, governmental, hospital and religious) land use categories. Analysis shows that the built up land has increased from 2416 hectares in 1981 to 6251 hectares in 2011 (increase of 178 percent) (Figure 5). This increase in built up area is attributed to increasing demand of land from growing population and the development made in secondary and tertiary sectors. The general trend of expansion has taken place along the roads which are in the radial pattern. The places where new unplanned residentials came into existence during the study period includes Zainakot, Malura, Parimpora and Bemina in west, Soura and Ahmad Nagar in the northern end and Magarmal Bagh in southwest of the city. Whereas newly planned residentials came into existence at Lal bazar in the north and Chanapora, Natipora, Bhagat Barzulla, Rawalpora in south and Bemina in the west. Unplanned residential area in the year 1981 was confined more or less to the core area on east and west bank of River Jhelum.
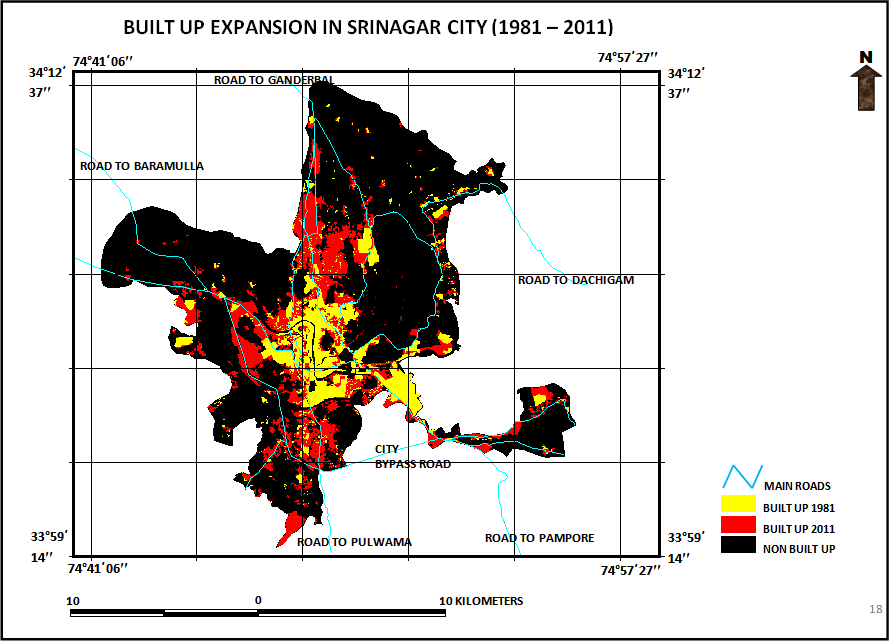 | Figure 5. Built up expansion in srinagar city (1981 – 2011) |
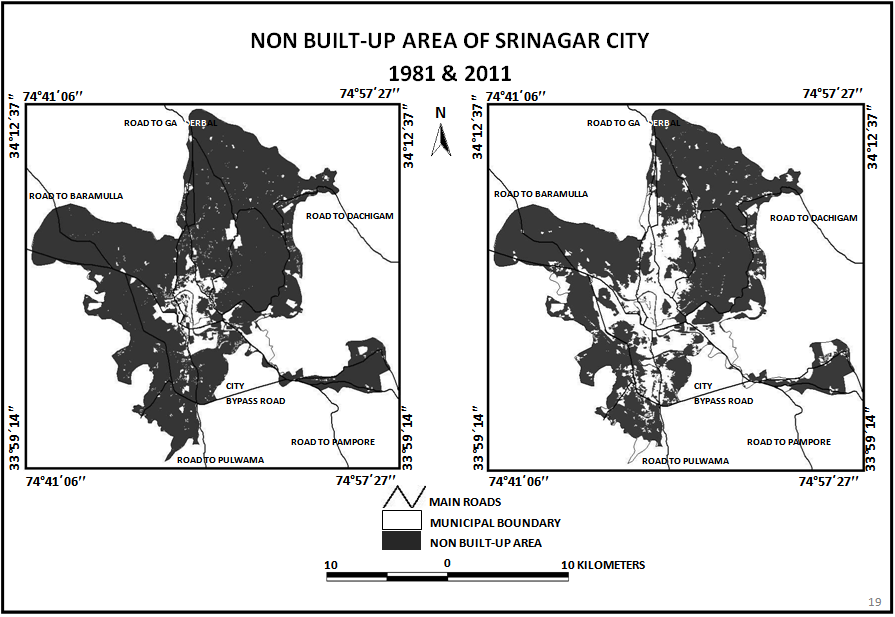 | Figure 6. Non built-up area of srinagar city1981 & 2011 |
5.2.2. Parks/Gardens & Play grounds
- This class includes various parks/gardens and playgrounds where people carry out recreational activities and these form an important part of the city’s culture. In the year 1981 total land area under this class was 140 hectares (0.59% of the total study area) which increased to 372 hectares (1.59% of the total study area) in 2011. Despite urban expansion, the total area under this class increased by 232 hectares, because of being the important tourist destination and also one of the obvious indicators of urban sustainable development is the quality and quantity of green spaces in the city[14]. The Parks/Gardens & Play grounds mapped include the famous Mughal gardens and others like Shalimar Bagh, Harwan garden, Nishat Bagh, Botanical garden, Tulip garden, Zabarwan Park, Golf course, Polo ground, Nehru Park, Cricket pavilion, Sher-i-Kashmir Park and Iqbal Park etc.
5.2.3. Vacant
- Vacant land includes the land belonging mostly to locals who left crop cultivation, most of which is speculative land holding. This class also includes the abandoned government land. In the year 1981, the total land area under this category was 517 hectares (2.2% of the total study area), which decreased to 255 hectares (1.08% of the total study area) in 2010 (i.e., decreased by 262 hectares). Capture of land market by the speculative developers and property dealers also the increasing demand from growing population, land prices have soared high. Therefore, some farmers discontinued the agricultural activities and left their lands unattended. They aim to sell off their land area at a good price in the near future. The existing vacant land was observed at Zakura & Tailbal in the northern end of the city, about 10-12 km away from city centre. Also good proportion of vacant land was mapped in the west and some patches at Ahmad Nagar in the west and northwest of the city. Although, vacant land was observed away from the city centre, but at the same time these areas are well connected with the roads. Increasing population pressure led to the movement of the well off people from the congested core area to the outskirts of the city. They purchase these vacant lands for residential purposes at very high prices.
5.2.4. Agriculture
- Agriculture class includes mostly Paddy land, Floating/vegetable gardens (Radh) and Saffron Karewa fields. In the year 1981 the total area under agricultural land use was 14408 hectares (61.45% of the total study area) which decreased to 10949 hectares (46.7% of the total study area) in 2011. Therefore 3459 hectares of agricultural land have been lost during the period of 30 years in the study area. Paddy is the dominant crop in agricultural land use. The decrease in its area is attributed to the expansion of the built up area on fertile agricultural land and occupational shift of the people from primary to secondary and tertiary activities. Moreover the shift from crop growing activities to the horticulture activities by many agricultural land owners led to the decrease in the total area under agricultural land use. The dominant Paddy growing areas were mapped in the west, south and also in north eastern hilly areas. The practice of vegetable gardens/Floating garden are predominantly observed in the western parts of Dal Lake and Khushalsar wet land in the north. These gardens are owned by the boatmen (locally called Hanjis) who cultivate vegetables on these movable lands on water surfaces. Saffron cultivation is practiced on the famous Karewas in the southeast of the city which is an outstanding land use feature of Kashmir, where world’s best Saffron is grown.
5.2.5. Plantation/Orchard
- This class includes Willow plantation, Apple, Cherry, Almond, Walnut orchards, distributed all over the city away from the core area. In the year 1981 the total area under this class was 1266 hectares (5.40% of the total study area) which increased to 2622 hectares (11.18% of the total study area) in 2011. This class has increased by 1355.5 hectares. Significant proportion of land under orchards was observed in north, some patches were also mapped in southwest and southern end of the study area. Similarly, willow plantation was observed in small patches spread all over the study area. Significant area under willow plantation was observed along the banks of River Jhelum in the west. Some Willow plantation was also observed in the east along the foot hills of Zabarwan mountains, also in Lokut Dal area where marshy area has been transformed into willow plantation area by Boatmen (Hanjis). The crop cultivators replaced significant area with horticulture activities which has made dependency of significant share of the economy on these orchards.
5.2.6. Forest
- Forest class includes the dense vegetation cover observed in the hilly areas of the study area. In the year 1981, the total area under this class was 346.5 hectares (1.47% of the total study area) which decreased to 153.5 hectares (0.65% of the total study area) in 2011, hence decreased by 193 hectares. Forest cover has decreased because of increased anthropogenic pressure. Poor people who could not manage to get land on the plain areas cleared the forest areas in the foot hills and managed to live there. It was observed in the hilly areas of the city i.e., Koh-i-Maran and Koh-i-Sulaiman, and also in the southeast at Zabarwan foot hills.
5.2.7. Barren
- In this study, barren class includes the bare exposed rocks, along with some quarrying area. These are the areas of less vegetation and have limited ability to support life. In the year 1981 the total area under this class was 539.5 hectares (2.3% of the total study area) which decreased to 480 hectares (2.05% of the total study area) in 2011, thereby losing 59.5 hectares. This class has been mapped in the rocky areas of the study area i.e., the bare rock surfaces of Koh-i-Maran and Koh-i-Sulaiman hills. Similarly, some patches in the northwest, Khanmou quarrying site in the southeast, also some patches were mapped in north at Alestang and New Theed’s hilly areas. The decrease in area is attributed to the capturing of barren land by other built-up classes because of increasing demand for land from the growing population.
5.2.8. Marshy
- Marshy area is included in the wetlands category. It includes the wet lands observed in and around the water bodies of the city. In these areas water table is at, near, or above the land surface for a significant part of the year. In the year 1981 the total area under this category was 1667 hectares (7.1% of the total study area) which decreased to 468.5 hectares (2% of the total study area) in 2011. Among all the land use/land cover classes, marshy class is the prime victim of urban expansion in Srinagar city. It lost 1198.5 hectares during the period of 30 years. Because of population growth and poor implementation of government proposals, significant areas from these marshes have been converted into residential areas. Most of them have got completely extinct e.g., Rakh-i-Gandakshah and Rakh-i-Arat marsh in the west.Presently, it exists only at few locations i.e., in the eastern part of Dal Lake, Khushalsar marsh in the north, Brari Nambal located in the core area, small patches at Bemina and Parimpora in the West etc. Presently these areas are inhabited by boatman (Hanjis) who earn their income from these marshy areas by cultivating those fruits and vegetable which need water throughout their growth period.
5.2.9. Water body
- Water body class includes the rivers, lakes and water reservoirs of the city. In the year 1981, the total area mapped under this category was 2145 hectares (9.15% of the total study area) which decreased to 1895 hectares (8.08% of the total study area) in 2011. Because of anthropogenic pressure almost all the water bodies have decreased by more than 250 hectares during the study period. The existing water bodies of the city which have been observed in this study includes; the Dal Lake, Nigeen Lake, River Jhelum, Brari nambal, Tailbal Nallah and Harwan water reservoir. The lakes are the centres of tourist attraction adding to the total revenue in tourism industry. But at the same time, these water bodies are getting deteriorated both in area as well as in their quality of water. Shikaras (ferry) and the Houseboats are the major attraction in these water bodies. River Jhelum is another important water body of Srinagar city, which originates in the south east of Kashmir at a spring (Verinag). During its course, it dissects Srinagar city diagonally in southeast to northwest direction. Also, various other small tributaries join it during its course. Northern area of Brari nambal in the core area, Tailbal Nallah located to the northeast of Dal Lake which also feeds the Lake. Harwan water reservoir at Harwan in the northeast of city, feeds most parts of the city.
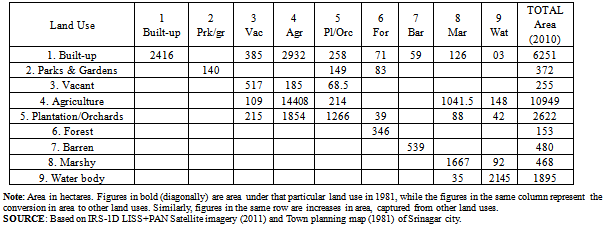
6. Land Transformation in Srinagar City
- Land is in a continuous state of transformation as a result of various natural and man-made processes[15]. Land transformation has been asserted as one of the important fields of human induced environmental transformation[16]. An important aspect of change detection is to determine what is actually to what i.e., which land use class is changing to the other. This information reveals both the desirable and undesirable changes and classes that are relatively stable overtime. This information also serves as a vital tool in management decisions. During the study period, Srinagar city has not only expanded from its original size but there was significant interchange of land among various land use/cover classes. These changes are because of the development of city resulting in increased demand of land for residential, commercial, industrial etc. purposes. This demand of land along with site attraction, functional convenience, functional magnetism and the land value of that particular area ultimately influence the pace and direction of urban land transformation.Table 4 and Map 3, shows this transformation between 1981 and 2011. It was observed that the growth has taken place away from the city core area following the theory of city growth as propounded by Christaller (1933). Transformation process is evident all over the city explicitly towards the outer areas. Thus shows the expansion of the city towards its periphery.Significant land transformation was witnessed among built-up area, vacant, plantation/orchards, agriculture and water bodies/marshy lands. Built-up area increased by 3835 hectares, capturing land mainly from agriculture, vacant, plantation/orchards and marshy area. Parks/Gardens and play grounds increased by 232 hectares, gaining area from plantation and forest area. Plantation/orchards land lost 689 hectares; this loss was gain for built-up, parks and orchards, and vacant area. At the same time plantation/orchard gained by 1355 hectares from agriculture, vacant, marshy, water body and forest classes. Vacant lost its 262 hectares to built-up area for residential and commercial development and also for agriculture and horticulture area expansion. Agriculture lost 3459 hectares of land for residential, commercial, industrial, parks and gardens and plantation/orchards. Marshy area and water bodies lost 1449 hectares area mainly to agriculture, plantation/orchards, residential and governmental land use. The urban expansion in Srinagar city has also brought ecologically important land use classes under the transformation process. For example, forests have been cleared down for bringing up settlements, parks/gardens and play grounds, plantation/orchards etc for various socio-economic purposes, which is a loss to the ecology. At the same time, rocky surfaces i.e., the barren land was brought under residential, parks and gardens. This is scientifically indifferent pattern of land transformation, but the widening gap between the growing population and the available land led to the emergence of such situation.Unorganised planning and political instability in the Kashmir region has also played its part in transforming the city into unplanned one. Most of the vacant land best suited for commercial purposes has been consumed unplanned. Unemployed youth try to establish business activities of their own without proper registrations from the government organization hence leading to self selection of locations. Further development in the city will further lead to the land transformation. Though the Master plan for the state is already prepared still the implementations are lacking.Analysing the nature of the change under stability i.e., areas with no change and instability loss or gain by each class between 1981 and 2011 as observable in table 4, stability seems to be a relative terms as no class is actually stable during this period.
|
|
|
| |||||||||||||||||||||||||||||||||||
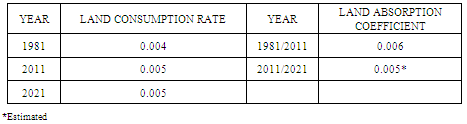
7. Land Consumption Rate, Consumption Ratio and Future Projections
- Land consumption rate which is a measure of compactness indicates a progressive spatial expansion of a city (Table 5); being high in 1981/2011 and as per the projected land use, it will further increase between 2011 and 2021, because of the growing population (Table 5 & 6). Also, land absorption coefficient being a measure of consumption of new urban land by each unit increase in urban population was significant between 1981 and 2011. This therefore suggests that the rate at which new lands are acquired for development is high. As per the projected expansion it will be high between 2011 and 2012. This may also be the trend in 2011 to 2021 as there seems to be the expansion of the city centre towards the outskirts. This is because of the fact that the city core area has become congested. Government has made strategies to decongest the core area where in various government and private offices have been shifted to the west of the city. Moreover, the well off people from the core areas prefer to move towards the outskirts on open spaces. Table 7 shows the statistics of land use/land cover projection for 2021. This step is taken with the intention of giving an insight to what LULC situation of Srinagar city will look like by the year 2021. Comparing the figures with table 2 there exist significant changes in classes between 2011 and 2021. Thus the projected figures reveal that agriculture maintains the highest share in the total land use followed by built-up class. Vacant, forest and parks and gardens retains the lowest position. Plantation/orchards and water body maintains significant share among all the other land uses.
8. Conclusions
- The above discussed study can be concluded as follows: Located in the heart of the bowl of Kashmir valley; Srinagar city is its capital city, ever since its creation. The analysis reveals that besides the physiographic limitations, there has been widespread urban expansion in Srinagar city during the study period of 30 years (1981-2011). Built-up area has increased by 3835 hectares, which is the combination of anthropogenic activities and it is the one that affects the other land use/cover classes. In achieving this Land Consumption Rate and Land Absorption Coefficient were introduced in this research work. The widening gap between the available land and the growing population has resulted into increase in land consumption rate and land absorption coefficient, which shows the urban expansion. Further, the estimated projected population observed that change by 2021 may likely follow the trend of 1981/2011 all conditions being equal. This could lead to more built-up congestion and expansion of the city on the fertile agricultural land in its fringe area. The economic development in the city has triggered social transformation leading to the change and interchange of land use/cover classes. Its land use accommodates every decision making centre and various other government and private resource centres which sets a chain of interaction, and boosts activities of the population of capital city with the people of different areas and urban centre of Kashmir valley. This has triggered the movement of people from rural areas to the city, which has accentuated the process of land use change and transformation. Agriculture land has been witnessed as the prime victim of this land transformation which has lost 3459 hectares during the study period. Vacant, forest, barren marshy and water bodies are the other prominent victims of land transformation in Srinagar city.
References
| [1] | Adesina FA, Siyanbola WO, Okelola FO, Pelemo DA, Ojo LO, Adegbulugbe AO (1999). Potentials of agroforestry for climate change mitigation in Nigeria, some preliminary estimates. Glob. Ecol. Biogeogr. Lett., 8: 163-173. |
| [2] | Amin A and Fazal S, (2012) Land Transformation Analysis using Remote Sensing and GIS Techniques (A Case Study), Journal of Geographic Information System, vol 4(3) in press. |
| [3] | Amin, A., Amin A., Singh, SK., (2012) “Study of urban land use dynamics using geospatial approach”, Bulletin of Environment and Scientific Research, vol 1(No 2), pp. 18-24. |
| [4] | Burley, T.M., (1961) “Land use or land utilization?” Professional Geographer, vol. 13, (6), pp. 18-20. |
| [5] | Doos BR. 2002. Population growth and loss of arable land. Glob. Environ. Change: Hum. Policy Dimens. 12(4):303–11. |
| [6] | FAO (Food and Agriculture Organization) (1995) “Planning for Sustainable Use of Land Resources”. FAO Land and Water Bulletin 2. Rome: Food and Agriculture Organization of the United Nations, p 21. |
| [7] | Fazal, S and Amin, A., (2011), Impact of urban land transformation on water bodies in Srinagar city, India. Journal of environmental protection, vol 2 (No 2), pp. 142-153. |
| [8] | Herold, M., Goldstein, N. and Clarke, K., (2003) The Spatiotemporal form of urban growth: Measurement, analysis and modeling. Remote sensing of Environment Vol. 86(3), pp.286-302. |
| [9] | Herold, M., Roberts, D., Gardner, M. and P. Dennison (2004) Spectrometry for urban area remote sensing - Development and analysis of a spectral library from 350 to 2400 nm, Remote Sensing of Environment, 91, 3-4, 304-319. |
| [10] | Huang, S.L., Wong, J.H & Chen, T.C (1998) A framework of indicator system for measuring Taipei’s urban sustainability. Landscape and urban planning, Vol, 42, pp. 15-27. |
| [11] | Ifatimehin, O.O. (2007). “An Assessment of Urban Heat Island of Lokoja Town and Surroundings Using Landsat ETM Data”. FUTY Journal of the Environment, Volume2 (1): 100-108. |
| [12] | Jenson, J.R., and Cowen, D. C. (1999). Remote sensing of urban/suburban infrastructure and socio-economic attributes. Photogrammetric Engineering and Remote Sensing, Vol. 65(5), pp.611-622. |
| [13] | Lambin, E.F., Geist, J.H., and Lepers, E., (2003) Dynamics of land use and land cover change in tropical regions, Annual Review of Environmental Resource, p-207. |
| [14] | Meyer, W.B and Turner II, B.L (1994) (editors), Changes in Land use and Land cover: A Global Perspective, The press syndicate of University of Cambridge, U.K. |
| [15] | S. Fazal, (2000) “Urban Expansion and Loss of Agricultural Land,” A GIS Based Study of Saharanpur City, India. Environment and Urbanization, Vol. 12. No. 2, pp 133-149. doi:10.1177/095624780001200211. |
| [16] | Socio economic profile of Jammu and Kashmir (2008), Directorate of economics and statistics, Jammu and Kashmir, pp, 82-89. |
| [17] | Turner, B.L. II., Skole, D., Sanderson, S., Fischer, G., Fresco, L and Leemans, R., (1995) “Land Use and Land Cover Change”, Science/Research Plan. IGBP Report No.35, HDP Report No.7. IGBP and HDP, Stockholm and Geneva, pp. 20-25. |
| [18] | UNPF (1999). The State of World Population, pp. 76. New York: United Nations Publications. |
| [19] | USEPA (2001). “Our Built and Natural Environment: A Technical Review of the Interactions Between Land Use”. Transportation and Environmental Quality. Pp. 4. |
| [20] | Victor DG, Ausubel JH. 2000. Restoring the forests. Foreign Aff. 79(6):127–44. |
| [21] | Vitousek, P.M., Mooney, H.A., Lubchenco, J and Melillo, J.M., (1997) “Human domination of Earth’s ecosystems.” Science, vol. 277, pp. 494-499. |
| [22] | Wilkie DS, Finn JT (1996). Remote Sensing Imagery for Natural Resources Monitoring. New York: Columbia University Press, p. 295. |
| [23] | Yeates, M and Garner, B. (1976). The North American City, Harper and Row Pub. New York. |