Sudha Yerramilli
National Center for Biodefense Communications, Jackson State University, Jackson, MS, USA
Correspondence to: Sudha Yerramilli , National Center for Biodefense Communications, Jackson State University, Jackson, MS, USA.
| Email: |  |
Copyright © 2012 Scientific & Academic Publishing. All Rights Reserved.
Abstract
Integration of flood risk assessment information in the urban planning process plays an integral role in the effective management of flood risk mitigation measures. The present study develops a hybrid approach in identifying flood risk zones and assessing the extent of impact of the hazard by integrating HEC-RAS and GIS technologies. This GIS-based approach, which allows visualizing and quantifying the results in a spatial format, was applied to the City of Jackson, MS. A 200-year magnitude flood event, which was experienced by the study region in 1979, was simulated to expose the vulnerability of the current infrastructure of the region whose developmental codes are bound to a 100-year magnitude flood event. The results indicated the efficiency of the developed hybrid approach in modelling the flood scenario, visualizing the spatial extent and assessing the vulnerability of the region. The vulnerability assessment from the 1979 flood event simulated by HEC-RAS model presents the intensity of risk to which the City of Jackson is exposed with its major transportation corridors (I-55, Highway 80) and numerous critical facilities getting affected by flood waters. By generating quantified estimation of inundation depth levels at any point of interest in the study region, which is absent in the previous research, this study attains utmost significance. Flood risk assessed by simulating higher magnitude flood events using such hybrid approach magnifies the vulnerability of the region and reinforces that any land use planning decisions in floodplains should make informed choices by incorporating scientifically derived information in their decision making process.
Keywords:
Flood risk assessment tools, Urban Planning, Hazard assessment, GIS, HEC-RAS
Cite this paper: Sudha Yerramilli , A Hybrid Approach of Integrating HEC-RAS and GIS Towards the Identification and Assessment of Flood Risk Vulnerability in the City of Jackson, MS, American Journal of Geographic Information System, Vol. 1 No. 1, 2012, pp. 7-16. doi: 10.5923/j.ajgis.20120101.02.
1. Introduction
Flooding is the most common natural hazard that can happen any time in wide variety of locations due to high intensity rainfall events. The projections of climate change trends indicate increase of the occurrence of the intense rainfall events, both in terms of their intensity as well as the frequency[1]. Such high intensity rainfall events along with the changes in the land use patterns are expected to have implications on the intensity of river flooding and local flash flooding in a flood plain region and can substantially alter the spatial extent of future flood risk[2]. The geographic and demographical growth of urban regions can potentially alter the degree of vulnerability in terms of exposure to inundation depths and spatial extent of flood waters[3]. The sustainable and effective management of flood risk mitigation measures demands a holistic approach that can integrate the flood risk assessment information in the decision making process in any proposed developmental activity. The processes of urban planning and the flood risk assessment share an inter-dependant relation and the two processes should consider the objectives, direction and constraints of the other to ensure alignment between planning policies and flood risk mitigation measures[4].With the impact of climate change effects on the intensity of rainfall events, identifying the vulnerable areas and assessing the degree of impact for a higher magnitude flood risk event more clearly describes the potential risk at which the current developmental or infrastructural facilities are situated. Availability of hazard-identified spatial information can assist the decision making authorities to stay informed about the possible higher magnitude risks and integrate the information while developing land use zoning guidelines or developmental budgetary proposals. Emphasizing the significance of flood-risk assessment studies, Burby[5] states that the main components of such studies should focus on hazard identification and vulnerability assessment as the flood risk is considered as a product of spatial identification and vulnerability[6]. Numerous flood risk assessment studies by many researchers throughout the world indicated the significance of technical and scientific approach in developing methodologies[7].Integration of technologies – HEC-RAS (Hydrologic Engineering Centers River Analysis System) and GIS (Geographic Information Sysytem) to obtain scientifically derived information has been specified as efficient in simulating, identifying and analyzing flood events in a geo spatial environment[8]. The use of Geographical Information System (GIS), to a large extent can facilitate in providing accurate information as it can handle the digital data along with their associated attribute information on physical and environmental aspects for the spatial features. The capability of applying GIS to the flood simulations assist in analyzing the flood levels or extents spatially. It helps in visualizing flood simulations in an interactive setting, where the spatial impact of various scenarios can be viewed along with the location of critical facilities and thus to assess the region’s vulnerability towards a flood event efficiently[9]. In this connection, Bajwa and Tim[10] describe the 1-dimensional HEC model (HEC-RAS developed by US Army Corps of Engineers, USACE) as a geospatial hydrology tool kit that recognizes the power of Arc GIS environment in generating and visualizing flood simulations. The HEC-Geo RAS products developed by US Army Corps of Engineers enable these flood simulation models to be compatible with Arc GIS environment and provide valuable tools to evaluate impacts associated with flood plains[11]. The ability of GIS to pre and post process spatial data (using HEC-Geo RAS extension) from HEC-RAS is fundamental to the effective and efficient in representing the model results in terms of flooding extent, inundation depth. Illustrating flood hazard levels in a GIS environment has been very effective way of conveying the flood risk to the decision making authorities. The present research aims at designing and implementing a hybrid approach where a higher magnitude flood event is simulated by integrating hydrological model (HEC-RAS) with GIS so as to identify and analyze flood prone zones in a geospatial environment. The paper discusses the research under the sections of history of floods in the City of Jackson, development of hybrid approach in identifying hazard areas and assessing vulnerability of the region. Further the paper presents the validation of model results and discusses the results under hazard identification and vulnerability assessment sections.
1.1. History of Flood Events in the City of Jackson
The City of Jackson, which is the capital city of the state of Mississippi with a population of 184,256 (2000 US Census), located in Hinds County is chosen as the study region. The City of Jackson is susceptible to flooding from the Pearl River as well as a number of creeks that flow through the city (Figure 1)[12]. The City of Jackson suffers annual flood damages from the Pearl River of about $10M.
1.1.1. Description of 1979 Flood
Pearl River flood of 1979, also known as “Easter Flood of 1979” was the most catastrophic flood that the city of Jackson had ever experienced in its history. According to US Army Corps of Engineers report[13], the 1979 flood flows (with 128000 cfs of peak stream flow) surpassed the records of past flood events and inundated 1935 residential houses and 775 businesses establishments causing more than $200 million damage. The extent of damage was severe as serious disruptions occurred to transportation and communications that blocked the city for number of weeks. The 1979 flood was estimated as a 200 year flood event that left the city of Jackson with devastating damages. Rutherford[14] describes these damages as a public policy disaster as the increase in the property damage occurred due to the development built in the floodplain since the previous major flood in 1961. Rutherford[14] published that the developmental policies were encouraged by the U.S. Army Corps of Engineers flood control levees project completed in 1968 which proved unreliable. These flood control levees in Jackson were designed for a 100-year flood flow of 103,000 cubic-feet per second (cfs) and could not resist the peak flow in 1979 which was 128,000 cfs and as a result, the Pearl River flooded the fairgrounds and coliseum as well as parts of downtown.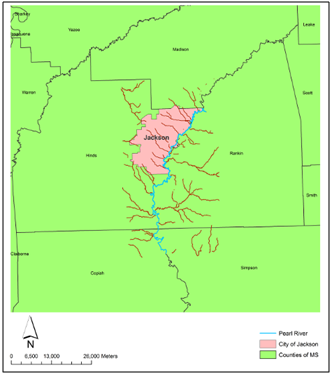 | Figure 1. River/stream network in the City of Jackson |
Hinds County (in which the City of Jackson is situated) is participating in NFIP (National Flood Insurance Program)program, all the land use controls are required to be bound to 100-year flood event. That means the flood areas are delineated by this event. The destructive consequences of 200-year magnitude 1979 flood reveal the necessity of conducting flood risk assessment in the City of Jackson so that the vulnerability of the region to a higher magnitude flood event can be well represented in a spatial format. The information generated by analyzing the potential losses that might occur due to such inundation can play an integral role in the decision making process of the planning authorities by assisting them in making informed decisions while promoting developmental activities in the Mississippi state capital.
2. Methods
The methodology involved in the integration of GIS and HEC-RAS flood simulation models is shown in the figure 2.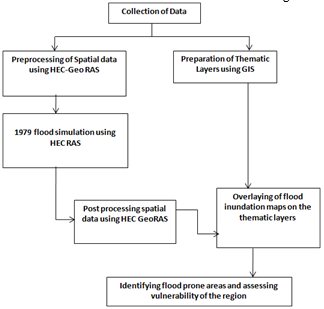 | Figure 2. Flow chart showing the process involved in the methodology |
2.1. Data Acquisition
The data collected is primarily from secondary sources. The digital elevation model (DEM) with 10 meter resolution is collected for the Hinds, Rankin and Madison Counties from MARIS (Mississippi Automated Resource Information System). The 1979 flood event river/stream flow data in the City of Jackson for the USGS monitoring stations (Pearl River at Ross Barnett Reservoir, Hanging Moss, Eubanks creek, Towns Creek, Lynch Creek, Cany Creek and Pearl River at Jackson) has been collected from USGS website. The stream network data (shape file) for the study region is obtained from National Hydrography Dataset (NHD). The land use maps used in the present study are downloaded from USGS seamless data distribution system (NLCD 2001 land use/land cover data). The aerial maps (National Agricultural Imagery Program of 2 meter GSD) for the Hinds, Rankin County are downloaded from MARIS. The present study uses the HAZUS-MH (HAZARDS – U.S., Multi-Hazard) inventory data for the critical facilities which is obtained from FEMA (Federal Emergency Management Agency). All the data files have a common spatial reference (NAD_1983_Transverse_Mercator projection).
2.2. Development of HEC-RAS flood simulation Model
The pre processing of the geometric data (to extract the physical characteristics of the study region) and the post-processing of the outputs (to visualize the flooding impact) that are required by the HEC-RAS model processes are done using HEC Geo RAS. This interface (as an extension in Arc GIS) allows the preparation of geometric data import into HEC-RAS and processes simulation results exported from HEC-RAS in a geospatial environment. To achieve consistent accuracy through the process of integrating HEC-RAS and GIS, choosing the correct coordinate system and mapping projection plays an important role. The DEM collected from MARIS has the North American Datum of 1983 (NAD83) with Transverse Mercator projection and these are applied to the data frame for efficiency. To create the geometric file, the DEM is converted to a TIN (Triangulated Irregular Network) format. Figure 3 shows the TIN of the study region imposed on the County boundaries. 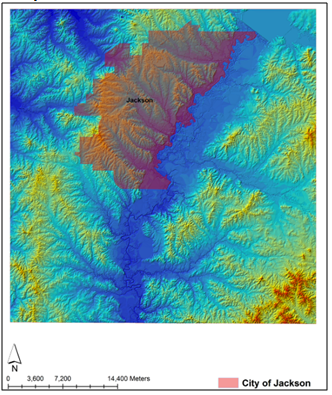 | Figure 3. Creation of TIN for the study region |
The geometric files used in HEC-RAS require information on the hydraulic structures and physical attributes of the river. HEC-Geo RAS retrieves this information about the attributes by creating RAS layers (using editor tool in Arc GIS). The RAS layers are populated with the physical attribute information by digitizing features in different layers and retrieving associated terrain data. The river Centerline is created by digitizing the Pearl River flowing from the upstream of the Ross Barnett Reservoir to the end of City of Jackson (from upstream to downstream). The associated terrain data attributes are populated using RAS geometry functions. The banks and flow paths are digitized (left path followed by the right and looking downstream) and are assigned their respective attribute information. Cross sectional lines are created to extract the elevation data from the TIN (terrain data). Cross sectional lines are the key inputs to the HEC-RAS simulations as the intersection of these lines with river centerline and flow paths carry crucial information such as location of bank stations, downstream reach lengths and manning values (land use codes). The cross sectional lines are digitized perpendicular to the river centerline (from left to right looking downstream) with an approximate distance of 100 feet between the lines. Using RAS geometry function, the attributes of the cross-sectional lines are populated with the elevation, river profile, bank stations and reach lengths.The Bridge and ineffective flow areas are created (by looking at the aerial photographs) using editor tools in Arc GIS. Under Levees layer, the East Jackson and the Jackson levee are digitized and the profiles are completed by retrieving the attribution information using RAS geometry functions. HEC-RAS simulations require each cross-sectional line to carry a manning ‘n’ value (land use type) in the geometric file. The land use categories are reclassified into open water, developed open land, urbanized land, barren land, vegetation, crops/grassland and wetlands and are represented by polygons. The corresponding manning values (as provided in HEC-RAS user manual) are assigned for each polygon and imported to the land use layer in HEC-Geo RAS (Figure 4). 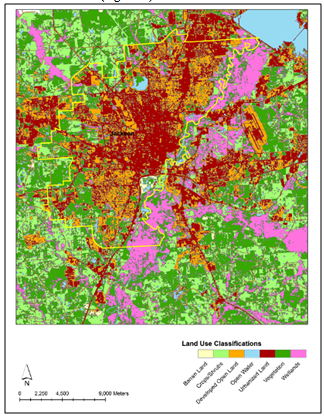 | Figure 4. Land Use classifications in the Study area |
Using RAS geometry functions, the manning values are extracted and allocated to the cross-sectional lines in the geometry file. Upon successful creation of these layers, the geometric data is exported to HEC-RAS for simulating the 1979 flood event.
2.3. Simulation of 1979 flood event in HEC-RAS
The processing of the flood simulation in HEC-RAS is done by using steady flow simulation. In this process, the boundary conditions are established at all the ends of the river nodes by entering the normal depth value and initial conditions were set by populating the model with the corresponding stream flows for 1979 flood event. Upon successful implementation of the simulation, the HEC-RAS output is exported to HEC-Geo RAS for post-processing of the output.
2.4. Post processing of HEC-RAS results
Post-Processing facilitates the automated floodplain delineation based on the data contained in the RAS GIS output file and the original terrain TIN. Using HEC-Geo RAS functionalities, the imported HEC-RAS results are processed with the TIN of the region to generate the flood water surface extents and the flood water depth files for 1979 flood event.
3. Results and Discussion
A thorough search for the inundation depth values for the study region provided only one single data source that is the flood water gage height at Pearl River at Jackson (United States Geological Survey (USGS) monitoring station). USACE, University of Colorado and NOAA reports[15,16,17] mentions the height at this point as 43.28 ft (13.19 meters) on the day of 1979 flood event. The inundation depth level obtained through HEC-RAS simulation at the Pearl River at Jackson point is 12.56 meters. The difference in the estimation (which is less by 4.75%) of the inundation depth level by HEC-RAS simulation could be attributed to the usage of 2001 Land use and DEM data in the model. As there is no quantified inundation depth data available for any other point in the study region, the output generated by integrating HEC-RAS and GIS for such a higher magnitude flood event attains utmost significance.
3.1. Validation of HEC-RAS Output by a Visual Comparison with NOAA Photographs
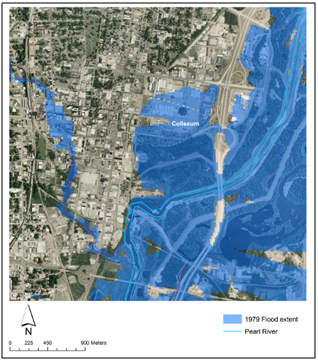
In the absence of quantified data on 1979 flood event, the simulated output is validated by comparing the simulation output with the observed 1979 flood event photographs obtained from National Oceanic Atmospheric Administration (NOAA). Figure 5 depicts that the City of Jackson is susceptible to flooding from the Pearl River and other creeks that run through the city. The model results indicate most of the areas in the City of Jackson are inundated and were along the creeks.The failure of levees (100-year flood level resistant) towards the 1979 flood magnitude resulted in the flooding of the fairgrounds, Coliseum as well as parts of downtown. A visual comparison of the NOAA photographs with HEC-RAS model results (Figure 6a, 6b, 6c, 6d, 6e and 6f) reveals the same fact.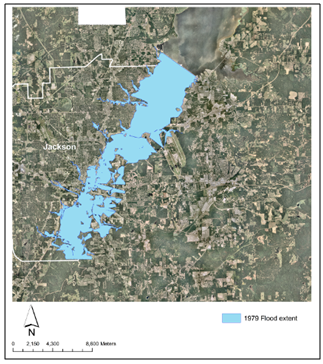 | Figure 5. Simulated HEC RAS 1979 Flood inundation results |
 | Figure 6a. HEC RAS simulation showing inundation at Coliseum Area |
The HEC-RAS model has generated similar inundation patterns which are close to the real situation in 1979. A close comparison of figures 6a and 6b (area not inundated between coliseum and downtown), figures 6a and 6c (inundation patterns on I-55), figures 6d and 6e (flood waters on Lakeland drive) can help in validating HEC-RAS model output.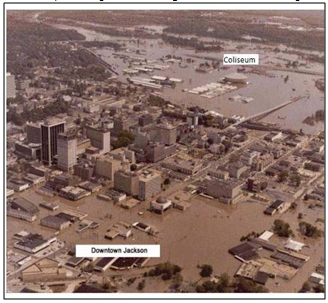 | Figure 6b. NOAA photograph showing inundation at Coliseum area |
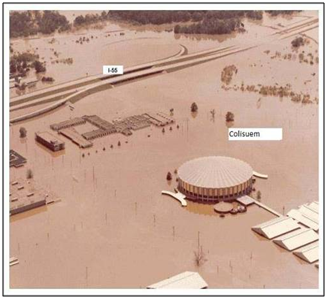 | Figure 6c. NOAA photograph showing inundation on I-55 at Coliseum area |
As the results yielded by the HEC-RAS model are close to the observed data of 1979 flood, the model can be assumed as valid to perform the hazard assessment analysis for the study region. In this regard, the identification of 1979 flood hazard is presented through the spatial extent and water depth grids maps of the inundation waters in the City of Jackson.Vulnerability assessment is done by overlaying the HEC-RAS simulation results with the thematic layers of the key facilities over the study region. In this connection, the results are discussed in terms of hazard identification and vulnerability assessment sections.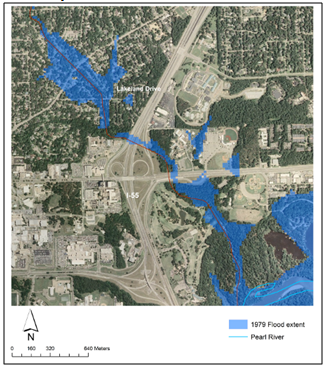 | Figure 6d. HEC RAS Simulation showing inundation at Lake Land drive area |
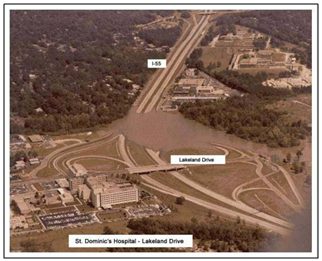 | Figure 6e. NOAA Photograph showing inundation at Coliseum area |
3.2. Hazard Identification
Figure 7 and figure 8 obtained from HEC-RAS simulations depict the extent and depth grid of inundation occurred during the flood of 1979 magnitude (a 200-year flood magnitude). The area of spatial extent that is under flood waters is of 90083600.001 square meters of area. The depth of flood waters range from 0.0094488cm to 1256 cm (Figure 8). The depth of the flood waters are estimated by the HEC RAS model. For these calculations, the model takes into consideration, number of inputs such as DEM, location of bridges, culverts, over passes and their heights, road elevations etc, blocked obstructions, levees, storage areas and thus generates the water depths as a raster data. As the developmental activities in the City of Jackson (which is in Hinds County) are bound to a 100-year flood magnitude, the hazard-bound spatial extent obtained at a possible higher magnitude reveals the necessity of integrating system generated information in the decision making process in order to make informed choices.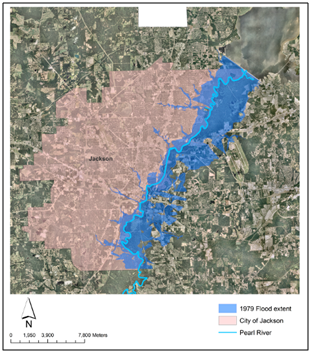 | Figure 7. Spatial extent of flood waters from HEC RAS simulation |
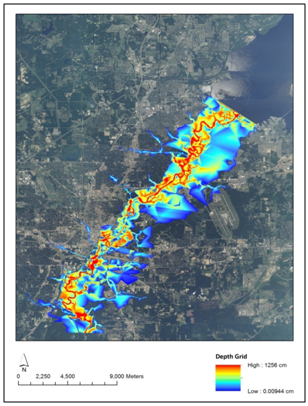 | Figure 8. Depth grid of the flood waters from HEC RAS simulation in the City of Jackson |
3.3. Vulnerability Assessment
The infrastructure failure of any region is estimated from the potential vulnerability of its critical facilities in the face of a hazard. Hospitals, schools, waste water treatment and potable water plants, hazardous plants, transportation utilities such as airport, railroad, and bus stations are identified as critical facilities by Odeh[18]. Potential impact on these key facilities, which play a critical role in the functioning of the state capital, can paralyze the functionality of the region. The vulnerability assessment is conducted by identifying the key facilities in the city of Jackson that are at risk of damage/loss from the hazard identified. The information analyzed helps to determine or prioritize the mitigation measures that can make the region more disaster-resistant. The impact of flooding in terms of number of key facilities affected is presented in Table 1. | Table 1. Number of Key facilities in the City of Jackson, MS vulnerable to 1979 flood |
| | Key Facilities | Number of Key facilities in the City of Jackson, MS vulnerable to 1979 flood | | School | 8 | | Hospital | 3 | | Hazardous Material Plants | 9 | | Potable Water Facilities | 1 | | Waste Water Facilities | 3 | | Airport Runways | 1 | | Bus Facility | 2 | | Railway Facility | 2 |
|
|
3.3.1. Impact on Hazardous Material Plants
The location of hazardous material plants in the flood plains is shocking as the outbreak of any plant during a flood event can pollute the environment (water ways/ pipelines) at an alarming pace which may result in serious injuries, deaths, long-lasting health effects, and damage to buildings, homes, and other property. The results presented in figure 9 shows that the study region is extremely exposed to flooding risk with 9 hazardous material plants situated within the possible inundation area of a 1979 flood magnitude. Some of them are situated on the flooding zone where the model predicted inundation depth is more than 2.5 meters. Any chemical accident in these plants during the flood event can prove to be a serious threat to the population and property that are in contact with the resultant pollutants.
3.3.2. Impact on Potable water and waste water facilities
Potable water facility is one of the basic amenities of any community that aims at providing environmentally safe transmission, storage and distribution of high quality public drinking water supply. These key facilities can be said as hypersensitive units which when polluted will result in long reaching impacts by affecting the public health over area. From the HEC-RAS model results (Figure 10), the major potable water facility unit in the study region falls under the inundation zone with 3.5 meters of water depth leaving the most populated county, the Hinds County, under vulnerable conditions. Adding to this, the presence of 4 waste water treatment plants (which often retain toxic materials in the process of removing physical, chemical and biological contaminants from the waste water to make it suitable to discharge back in to the environment) poses a great threat to the city of Jackson. From the model results (Figure 10) it is observed that three waste water facilities are located in the inundation zone, some of them under around 9 meters of inundation water depths, posing threat to the population and natural resources in the region.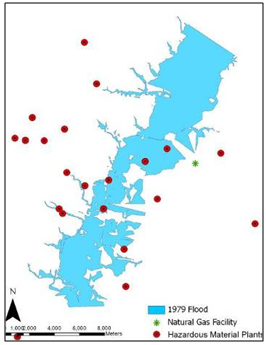 | Figure 9. Spatial location of hazardous waste plants under the impact of 1979 flood waters |
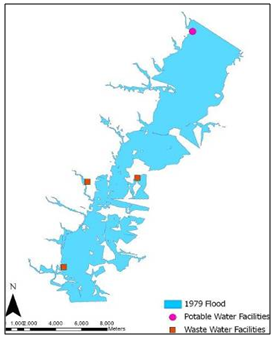 | Figure 10. Spatial location of potable water and waste water treatment plants under the impact of 1979 flood waters (HEC RAS Simulation) |
3.3.3. Impact on Transportation facilities
Flooding can cause extensive damage to a region by disrupting the transportation systems. The interruption of the movement of people and goods due to a flooding risk paralyse the region’s social and economic functionality. The inundation of the major transportation corridors- the interstates and the state highways and facilities that serve the region bring the day-to-day activities to a standstill, thus affecting from a local to regional level. The results from the HEC-RAS model (Figure 11) depicts that the interstates (I-55 and I-20) and state highways (80 and 25) in the study region are passing through the flood inundation zones. The results obtained from HEC-RAS simulations indicate the maximum inundation depth levels on I-55 (near to coliseum) and I-20 (near I-55 junction) could be 4.7 meters and 4.08 meters respectively. The flooding of these routes may paralyze the economic functionalities of the capital city of Mississippi (Jackson) posing direct as well as indirect impacts on the region. Figure 11 shows the spatial locations of the road network that is likely to get submerged under the flood waters. The possible water depths inundation map obtained from HEC-RAS flood simulation represents that the interstates I-55, I-20 and highway 80 and 25 runs through the water depth levels of maximum 8 meters during the flooding event.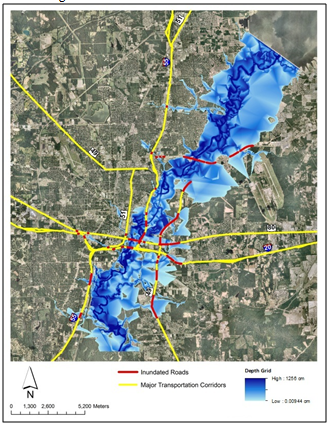 | Figure 11. Location of major transportation routes under inundation |
Another impact on the transportation sector can be noticed from Figure 12, as the flood of 1979 magnitude makes the study region partially inaccessible with 2 bus stations, 2 railway stations and 1 airport runway getting inundated under the flooding waters.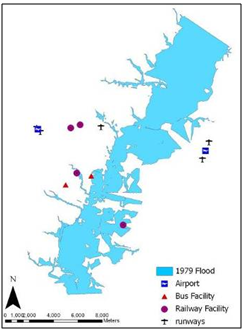 | Figure 12. Location of major transportation routes under inundation |
3.3.4. Impact on Hospitals and schools
The HEC-RAS model result, from Figure 13, shows that 3 hospitals (one of them under 1.5 meters of inundation depth) and 8 schools are falling under inundation. The impact on these hypersensitive units can even increase with some of the schools and hospitals outside the flood waters getting affected indirectly by the closures of transportation routes (I-55, I-20, Highway 80 and 25 and local roads) leading to these facilities.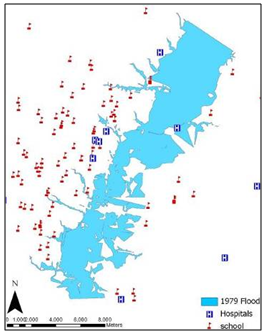 | Figure 13. Location Of Hospitals And Schools Under The Impact Of 1979 Flood Waters |
3.3.5. Vulnerability to 1979 flood water depths
In order to understand the different levels of flood vulnerability, a ranking is given to the key facilities with respect to the depth of flood waters at their respective locations (Table 2). The depths presented in table 2 indicate that the waste water and the transportation system of City of Jackson are highly vulnerable when exposed to a magnitude of 1979 flood.| Table 2. Vulnerability ranks for the key facilities based on the flood water |
| | Key Facility | Flood water Depth | Vulnerability Rank | | Hazardous Material Plants | 2.75m | 6 | | Potable and | 3.5m | 4 | | Waste Water | 9m | 1 | | I-55and I- 20 | 4.08-4.25m | 3 | | Hwy 80and Hwy 25 | 8m | 2 | | Hospitals | 2.44m | 5 | | Schools | 1.25m | 7 |
|
|
4. Conclusions
This study presents a systematic approach in identifying flood hazard and subsequently in assessing the vulnerability of the region by the integration of hydrological models with GIS. The combination of Arc GIS and HEC-RAS 1-D flood simulation model indicate the capability of simulating flood events and spatially depicting the degree of exposure or vulnerability of the region towards a hazard event in terms of inundation extent and depth of water levels. With only 4.75% of under estimation, the HEC-RAS simulated water level depth at Pearl River at Jackson matched with the only available inundation depth record at that point. The model can be said to have generated reliable quantified output. This hybrid approach provides quantified information on the water level depths and facilitates to access the data at any point of interest. As there is no quantified data on the inundation depths for such a higher magnitude flood hazard in the study region, the visualization and the quantification of the flood risks, as facilitated by this approach, can generate invaluable information and assist the decision making authorities to make informed choices towards mitigating the catastrophic effects of flooding disaster.The vulnerability assessment from the 1979 flood event (200-year magnitude), simulated by HEC-RAS model, reveals the intensity of risk to which the City of Jackson is exposed. As the developmental programs in this county are bound to 100-year flood level, the vulnerability of the region to a higher magnitude flood event is amplified with higher number of critical facilities getting affected by flood waters. The Capital city of Mississippi can be expected to be paralyzed with most its major transportation corridors- I-55, Highway 80, coming under inundation zones.The catastrophic effects of flooding disaster can be mitigated by integrating scientifically reliable information obtained from a risk assessment studies developed using this hybrid approach. Flood risk assessed by simulating higher magnitude flood events magnifies the vulnerability of the region and reinforces the fact that any land use planning decisions in floodplains should make informed choices and the corresponding developmental activities should be carried out in a sensible and careful manner.
References
| [1] | IPCC., 2007. Climate Change 2007: The Physical Science Basis. Contribution of Working Group I to the Fourth Assessment Report of the Intergovernmental Panel on Climate Change, Cambridge, United Kingdom and New York, NY, USA: Cambridge University Press, AR4-WG1. |
| [2] | Collins, E., and Lucy, Simpson., 2007. The impact of Climate changes on the insuring flood risk. In: Institute of Actuaries of Australia Biennial Convention, 23-26 September, Christchurch, New Zealand: Trowbridge Deloitte, 23-26. |
| [3] | Montz, B., 2000. The generation of flood hazards and disastersby urban development of flood plains. In: D. Parker, Floods. London & New York: Routledge, 116-127. |
| [4] | The Ireland Ministry of Environment, 2008. The planning System and flood risk management. Tullamore: Environment, Heritage and Local Government. |
| [5] | Burby, R. J., 1998. Cooperating with Nature: Confronting Natural Hazards with Land use planning for Sustainable Communities. Washington DC: Joseph Henry/National Academy Press. |
| [6] | Great Britain Department of Communities and Local Government, 2006. Planning Policy Statement 25: Development and Flood Risk. London: Crown Copyright, PPS25. |
| [7] | Rifaat Abdalla, C., Vincent Tao., Huayi Wu., and Imran Maqsood., 2006. A GIS-supported 3D approach for flood risk assessment of the Qu'Appelle River, Southern Saskatchewan. International Journal of Risk Assessment and Management, 6, 440 – 45. |
| [8] | Sam U. Shamsi., 2002. GIS Applications in Floodplain Management. In: 22nd Annual ESRI International User Conference, July 8–12, San Diego, CA: ESRI. |
| [9] | Bernardo, R., Almeida, I., and Ramos., 1994. GIS in flood risk management. University of Maine. Available from: [Accessed 11 November 2008]. |
| [10] | Bajwa, H. and Tim, U., 2002. Toward immersive virtual environments for GIS-based Floodplain modeling and Visualization. In: 22nd Annual ESRI International User Conference, July 8-12, San Diego, CA: ESRI. |
| [11] | Cameron, A., 2000. Hydraulic modeling of the Salt River, Arizona using HEC-Geo RAS. In: 20th Annual ESRI International User Conference. June 26-30, San Diego, CA: ESRI. |
| [12] | City of Jackson., 2008. Local flood Hazards. City of Jackson. Available from:[Accessed 9 December 2008] |
| [13] | US Army Corps of Engineers, 2004. Pearl River Watershed Study. US Army Corps of Engineers. Available from: [Accessed 12 January 2009] |
| [14] | Rutherford, P. H., 1982. The Jackson Flood of 1979 A Public Policy Disaster. Journal of American Planning Association, 48, 219-231. |
| [15] | US Army Corps of Engineers., 2010. USACE Process for the National Flood Insurance program Levee system Certification for the East and West Bank Pearl River Levees in Hinds and Rankin Counties, Mississippi. Vicksburg, MS: US Army Corps of Engineers |
| [16] | Anderson, D. and Weinrobe, M., 1980. Effects of a natural disaster on local mortgage markets: The Pearl River flood in Jackson, Mississippi- April 1979. Natural Hazard Research, Available from:[Accessed 14 July, 2009]. |
| [17] | NOAA., 2009. April Pearl River floods of 1979. NOAA: [Accessed on 7 august 2010] |
| [18] | Odeh, D., 2002. Natural Hazards Vulnerability Assessment for Statewide Mitigation Planning in Rhode Island. Natural Hazards Review, 3, 177-187 |
 Abstract
 Reference
 Full-Text PDF
 Full-text HTML