S. Maddah Kolur1, F. Kolahdouzan1, M. Khabari1, H. Afzalimehr1, V. P. Singh2
1Department of Civil Engineering, Iran University of Science and Technology, Tehran, Iran
2Department of Biological & Agricultural Engineering & Zachry Department of Civil and Environmental Engineering, Texas A&M Univ., College Station, Texas, USA
Correspondence to: H. Afzalimehr, Department of Civil Engineering, Iran University of Science and Technology, Tehran, Iran.
| Email: |  |
Copyright © 2022 The Author(s). Published by Scientific & Academic Publishing.
This work is licensed under the Creative Commons Attribution International License (CC BY).
http://creativecommons.org/licenses/by/4.0/

Abstract
Submarine pipelines are an important infrastructure and constitute vital vessels for transporting water, natural gas, oil, and petroleum products. In this study, scouring in one, two, and three tube models were experimentally investigated. The aim of this study was to investigate scour profiles for cases where pipes of different diameters were placed next to each other without any gap. In this regard, 15 experiments were performed in a flume 13 meters long, 0.46 meters wide, and 0.6 meters deep. For bed material, sand with a median particle size of 0.24 mm was used. The validity of experimental results was evaluated by performing 4 experiments under one-tube conditions and comparing the results with similar studies. When two pipes of the same diameter were placed next to each other without distance, they acted as an interconnected object and the maximum scouring depth formed between the two pipes. In the case where two pipes had different diameters, the greatest scouring depth formed near the larger diameter pipe. The scour depth formed under two pipes of different diameters was less when the larger diameter pipe was placed upstream, showing the pipes were placed in descending order (in terms of diameter). The results obtained for two pipes with different diameters also applied in the case of three pipes.
Keywords:
Pipeline, Scour depth, Same pipe diameter, Different pipe diameters, Optimal pipe layout, Bed material
Cite this paper: S. Maddah Kolur, F. Kolahdouzan, M. Khabari, H. Afzalimehr, V. P. Singh, Experimental Study of Scouring in Groups of Pipelines with Different Diameters, American Journal of Fluid Dynamics, Vol. 12 No. 2, 2022, pp. 131-140. doi: 10.5923/j.ajfd.20221202.01.
1. Introduction
Offshore pipelines are an important infrastructure for transporting water, natural gas, oil and petroleum products. Due to the increasing extraction of oil and gas resources, the use of submarine pipelines is increasing dramatically and every year huge investments around the world are being made on projects to build new submarine pipelines.Undoubtedly, many environmental factors, such as the effect of waves, currents, etc. threaten these pipe lines. The pipelines can have severe economic, social, and environmental impacts, if they cause problems, such as leaks or failures. According to the analysis of offshore pipelines in the Gulf of Mexico, between 1967 and 1975, four main causes of failure of offshore pipelines were corrosion, scouring, seabed movement, and tertiary activity [1].When a pipe is placed on an eroded seabed, scouring occurs due to the interaction between the pipeline and the erodible seabed, under current, wave, or a combination of both around the pipeline. As a result, parts of the pipe remain suspended, in other words, they have no support. Over time, the length of free openings increases, and the pipe may rupture and structural failure under severe oscillating loads will occur due to vortexing. Therefore, the study of the mechanism of occurrence and expansion of the scour cavity, its depth and the factors affecting it have been considered by researchers and designers. [2]Yang et al. (2018) have divided the process of formation and development of scouring under pipeline into three parts, which are: scour initiation, tunnel erosion, and eddy erosion [3]. Mao (1986) stated that when a pipe is placed on the seabed or riverbed, vortices are formed around the pipe. He defined these vortices as vortex A (upstream of the pipe) and vortices B and C (downstream of the pipe) [4] (Figure 1).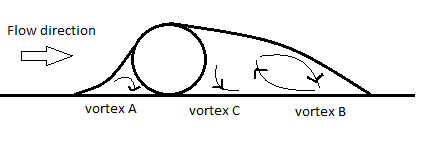 | Figure 1. Display of vortices around horizontal pipeline (Mao, 1986) [4] |
Dey & Singh (2008) stated that in  , as the ratio of pipe diameter to particle diameter
  increases, the ratio of scour depth to pipe diameter
  increases. In case
  as the
  ratio increases, the
  ratio will decrease [5]. Zhao et al. (2015) also stated that in order to reduce the scour depth in a two-pipe system, pipelines should be as close to each other as possible [6]. Zhang et al. (2017) obtained similar results to Zhao et al. (2015) and stated that in
  two pipelines act as a one body. They also stated that for
  the scouring depths of upstream and downstream pipes are close to the scouring depth of a single pipeline [7]. Li et al. (2020) stated in a numerical study that increasing the ratio of the distance between two pipes to the diameter of the pipes
  makes the scour hole below the upstream pipeline wider. Also, the smaller distance ratio, the more delay the scouring hole will be under the downstream pipe [8].In most submarine pipeline projects in the world, the pipes are grouped together. Therefore, in this study, experimental scouring in one, two, and three tube models was investigated. The aim of this study was to investigate scour profiles for cases where pipes of different diameters wre placed next to each other without any gap. The optimal arrangement of pipes with different diameters in terms of scouring is also presented.
2. Experimental Setup and Procedure
2.1. Laboratory Flume Specifications
Experiments of this study were performed in a flume with plexiglas walls 13m long, 0.46m wide, and 0.6m deep, which has a centrifugal pump with a maximum power of 30hp and a maximum capacity of 440 
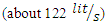 (figure 2).
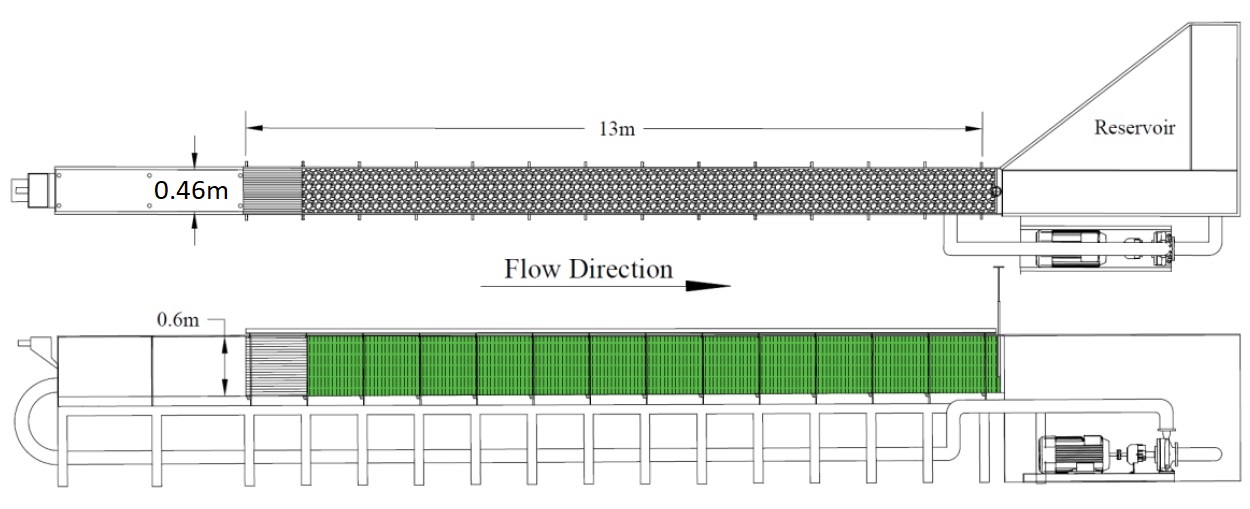 | Figure 2. Laboratory flume specifications |
Due to the significant turbulence at the entrance of the flume, a set of 1 m long metal panels was used as a filter to help dissipate the flow energy [9] (Figure 3). | Figure 3. Schematic of metal panels |
To ensure the flow development, the distance between 8.75m and 10.25m from the entrance of the flume (1.5m long interval) was selected as the test site and models were located in the middle of this interval at a distance of about 9.5m from the entrance and 3.5m from the end of the channel. (Figure 4).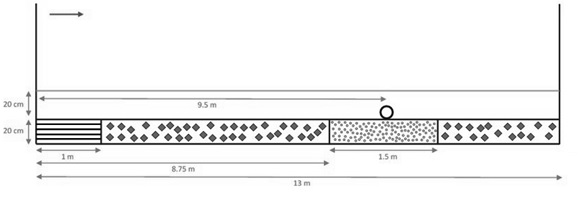 | Figure 4. Location of laboratory models |
2.2. Specifications of Bed Sediments
During the experimentation, sand with median particle diameter of 0.24 mm was used. This sand, which is extracted from the sand mine around Ardakan city in Yazd province of Iran, is soilless.It is noteworthy that Zhang et al. (2017) and Yang et al. (2019), who studied the scour depth in two-pipe and piggyback pipe systems, respectively, had used sand with median particle size of 0.24 mm [10] [7].The granulation diagram of this sand, which is granulated and plotted by ASTM standard sieves, is shown in Figure 5. Also, the send uniformity was checked and confirmed based on Dey and Singh’s study [5].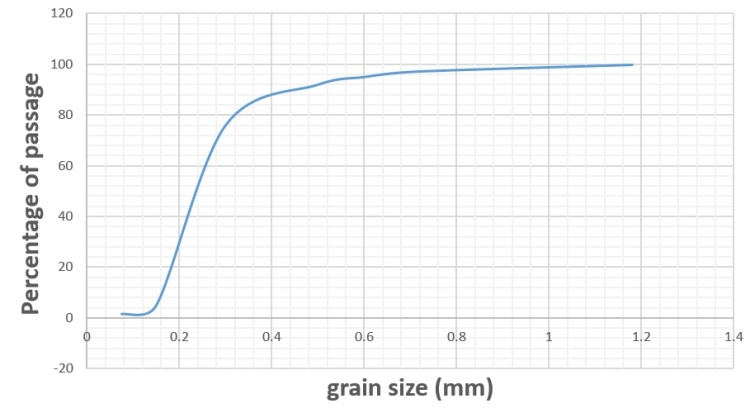 | Figure 5. The granulation diagram of sand in this study |
By examining the height of the sediment inside the channel and the scour depths obtained in various studies related to pipelines, the height of the sediment inside the channel was determined to be 20 cm. Washed sand with median particle size of 1.9 mm was used in other parts of the channel. This sand would certainly not be able to move and affect the scour profile during the tests.In this study, PVC pipes were used. These pipes have external diameters of 20, 25, 32 and 40 mm.
2.3. Flow Specifications
2.3.1. Water Depth
Dey and Singh (2008) have stated that the scouring depth in shallow flows increases with increasing flow depth. But when the ratio of flow depth to pipe diameter (h / D) is more than or equal to 5, the scour depth is independent of flow depth [5]. The water depth in the experiments of this study was 20 cm, which is 5 times the diameter of the largest pipe (4 cm).
2.3.2. Flow Conditions
Zhao et al. (2015) have shown in their studies that scour depth under the pipe were similar in clear water and live bed conditions [6]. Also, Zhang et al. (2017), who studied scouring in groups of pipes, performed most of their experiments under live bed conditions [7]. Therefore, because the time of the laboratory experimentation is limited and scouring in clear water conditions is time consuming, and also in some similar studies experiments have been done in live bed conditions, it was decided to perform most experiments under live bed conditions.
2.3.3. Flow Velocity
In live bed conditions, any velocity greater than the critical flow velocity ( ) can be used. In experiments performed to determine the proper flow velocity under live bed conditions, it was decided to use 1.4 times the critical velocity as flow velocity. The criteria for selecting the appropriate coefficient for live bed conditions are such that the occurrence of scouring and its evolution occurs in shorter time and at the same time the movement of bed particles (general scouring) is not significant.The Melville relations (relations 2 and 3) were used to calculate the critical velocity [11]:
 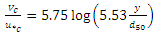 | (2) |
 | (3) |
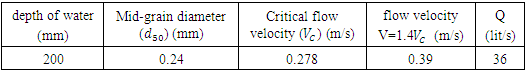
Table 1 shows the critical velocities obtained from the Melville relation, velocity, and flow rate.Table 1. A summary of experimental data
 |
| |
|
2.4. Test Duration
Zhang et al. (2017) stated that they continued experiments until no significant change in scour depth was observed under the two pipelines over a period of 30 minutes [7]. In this study, it was decided that if the scour depth did not change more than 1 mm after 2 hours, we would stop the test.To draw scouring profiles, checkered plates glued to the channel wall were used. Data collection was performed in this method in steps of 0.5 cm and the accuracy was 0.05 cm.
2.5. Number of Tests and Their Naming
In this study, 15 experiments were performed, including 4 tests in one-pipe mode, 9 tests in two pipes and 2 tests in three pipes. For the classification of experiments and the regularity of the obtained data, a naming system had been selected for each of these cases, which is described below.One-pipe tests were performed for four pipes with diameters of 2, 2.5, 3.2 and 4 cm with the aim of validating the tests and also comparing the results of subsequent tests. The name of these experiments was Ax, where A is the symbol for single-pipe experiments and x is the diameter of the pipe.Two-pipe experiments were performed in two forms of the same diameter and different diameters. The three tests were in the form of two tubes with the same diameter, which were performed for tubes with diameters of 2, 3.2, and 4 cm. Figure 6 schematically shows how the pipes were placed in this position and relevant parameters.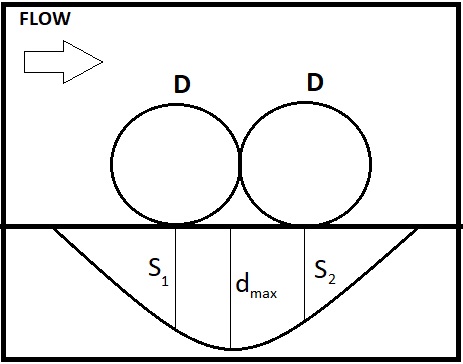 | Figure 6. Schematic of two-pipe experiments with the same diameter and relevant parameters |
Six next two-pipe tests involved models in which two tubes of different diameters were placed next to each other. In this case, pipes can be placed in the flume in two ways. A condition in which the smaller diameter tube is upstream and the larger diameter tube is downstream, which is called the Small-Big mode, abbreviated as S-B. In the other case, the larger diameter pipe is upstream and the smaller diameter pipe is downstream, which is called the Big-Small mode and stands for B-S. Figure 7 shows a schematic of these experiments in the two cases mentioned along with the relevant parameters.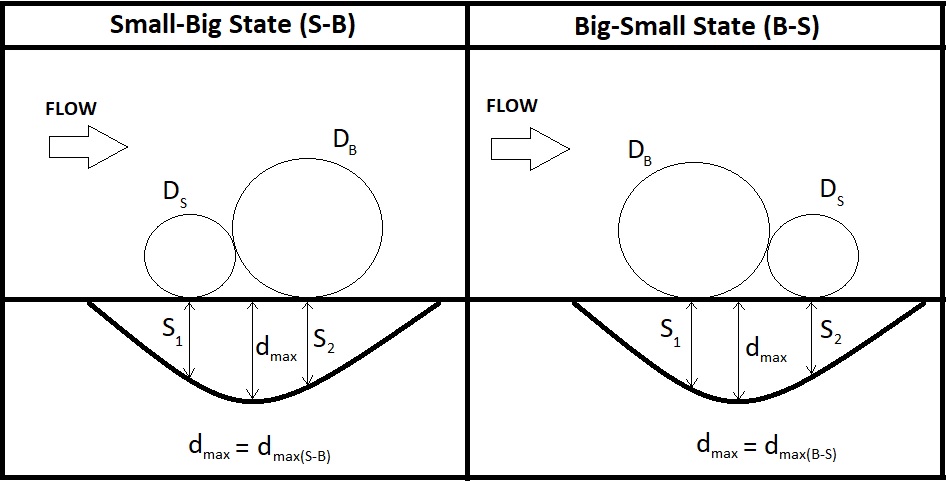 | Figure 7. Schematic of two-pipe experiments with different diameters and relevant parameters |
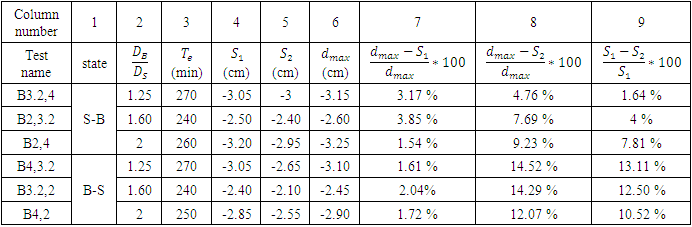
These experiments were performed for three pairs of pipes with diameters: 3.2 and 4, 2 and 3.2, 2 and 4. The ratio of larger pipe diameter to smaller pipe diameter  in these three modes was 1.25, 1.6 and 2.Names of the two-pipe tests are Bx,y, where B is the symbol for the two-pipe tests, and x and y are the diameters of the upstream and downstream pipes, respectively.Also, two three-pipe experiments, with diameters of 2.5, 3.2 and 4 cm, were performed in S-B and B-S modes. The names of these experiments are Cx,y,z, where C represents the three-pipe experiments and x, y, and z are the diameters of the upstream, middle, and downstream pipes, respectively. Figure 8 shows the image of these two experiments before starting the test.
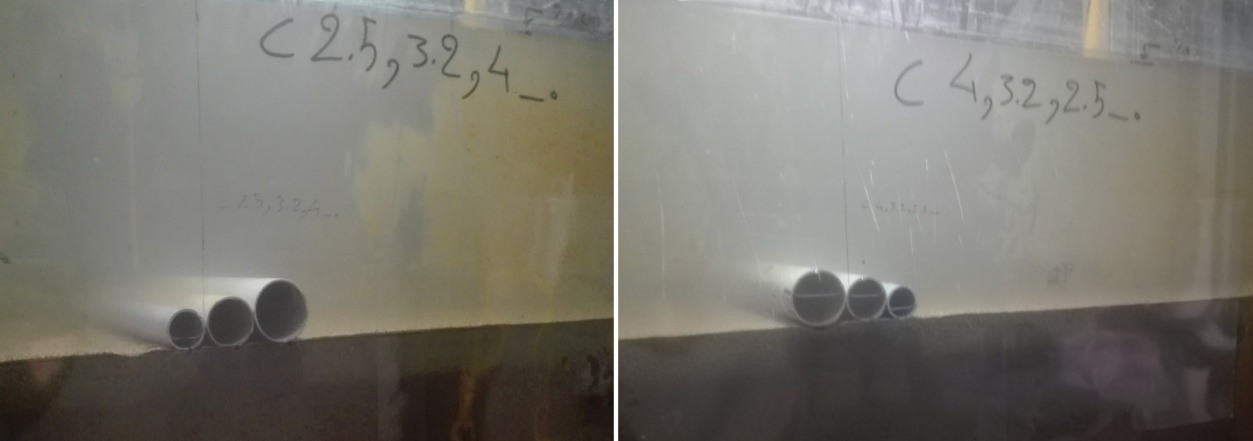 | Figure 8. Location of three pipes with diameters of 2.5, 3.2, and 4 cm in two positions, S-B and B-S |
3. Results
3.1. One-Pipe Tests
The main purpose of one-tube experiments is to validate the data obtained from the experiments and also to compare the data of subsequent experiments.Figure 9 shows the scour profile formed under the pipe with a diameter of 4 cm at different times. This figure shows that when the pipe is exposed to flow, a small scouring hole is formed under the pipe and a small sand dune downstream of the pipe. Over time, the scour cavity becomes larger and the sand dune gradually moves downstream. This process continues until the scouring cavity reaches equilibrium. At this time, the shear stress of the bed under the pipe is equal to the critical shear stress and scouring under the pipe stops.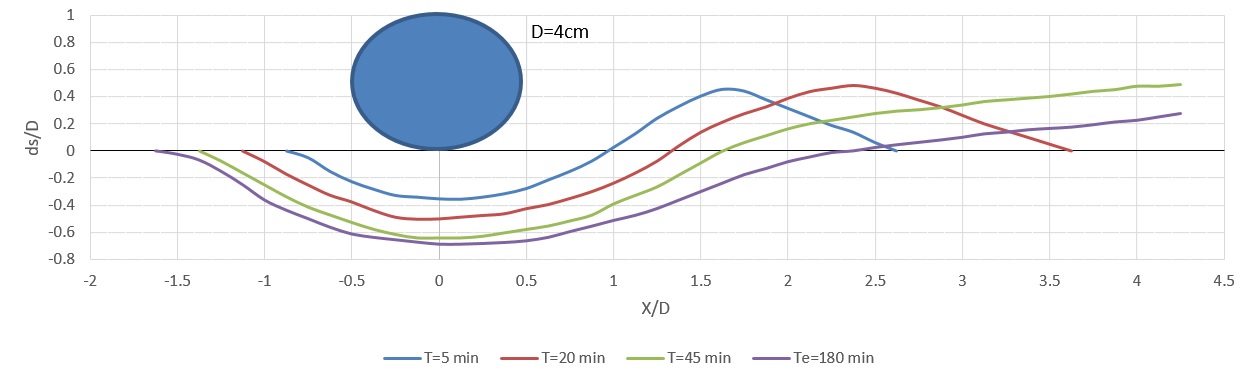 | Figure 9. Scour profile of single-pipe with diameter of 4 cm in different times |
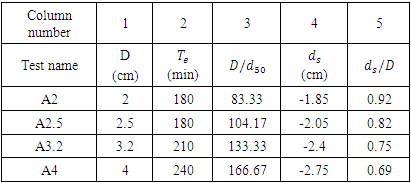
Results of the experiment on single pipes with diameters of 2, 2.5, 3.2, and 4 cm are also shown in Table 2. According to Table 2, as the diameter of pipe increases, the dimensionless scour depth  decreases. In columns 3 and 5 of Table 2, the ratio of pipe diameter to median particle diameter and dimensionless scour depth is calculated.
 Table 2. Results of 4 single-pipe tests
 |
| |
|
In Figure 10, results of these 4 experiments are placed next to the chart in Dey & Singh (2008) study [5]. Therefore, based on the formation and development of scour profiles under single pipes (Figure 9) and the comparison of dimensionless diagrams obtained from the results of one-pipe experiments with the diagram of Dey and Singh study (Figure 10), the accuracy of the results was confirmed.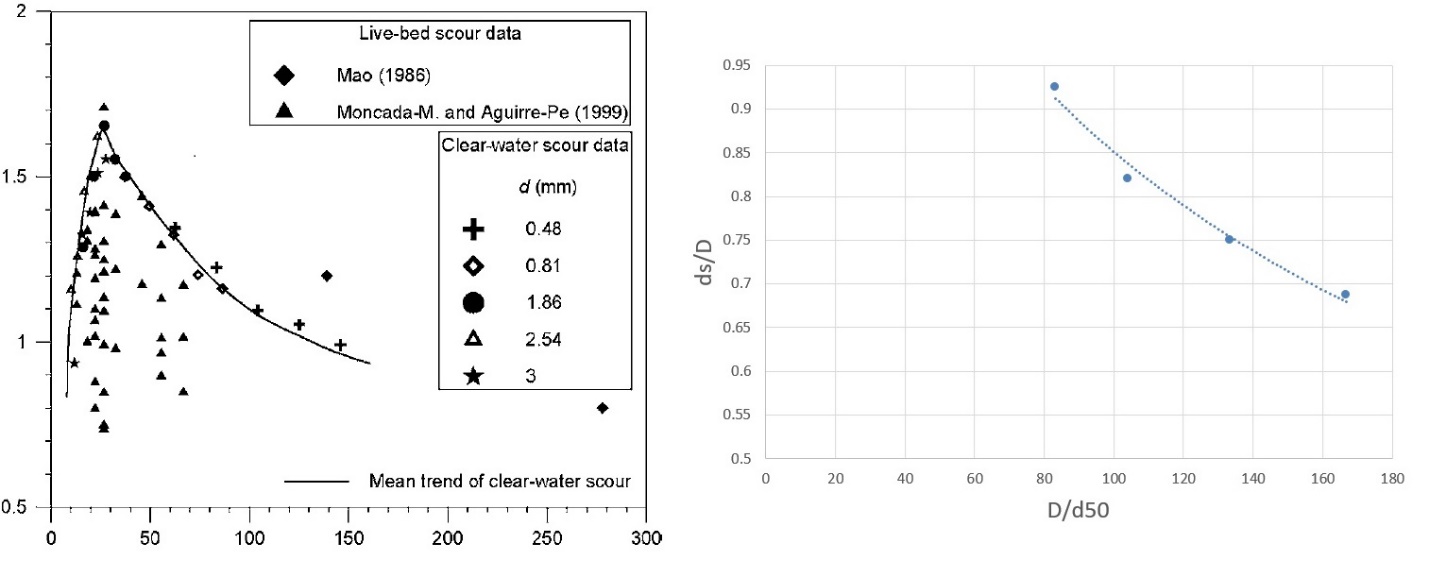 | Figure 10. Comparison of dimensionless diagrams obtained from the results of one-pipe experiments with the diagram of Dey and Singh (2008) study [5] |
3.2. Two-Pipe Tests with the Same Diameter
Performing two-pipe experiments with the same diameter, as the basic tests of the two-pipe system, was necessary to gain a better understanding of how scouring is formed and developed under these pipes. In the two-tube experiments with the same diameter, two tubes were placed side by side without gap. Figure 11 shows the scouring sections related to the test of two pipes with a diameter of 4 cm next to the section presented in the study of Zhang et al. (2017) [7].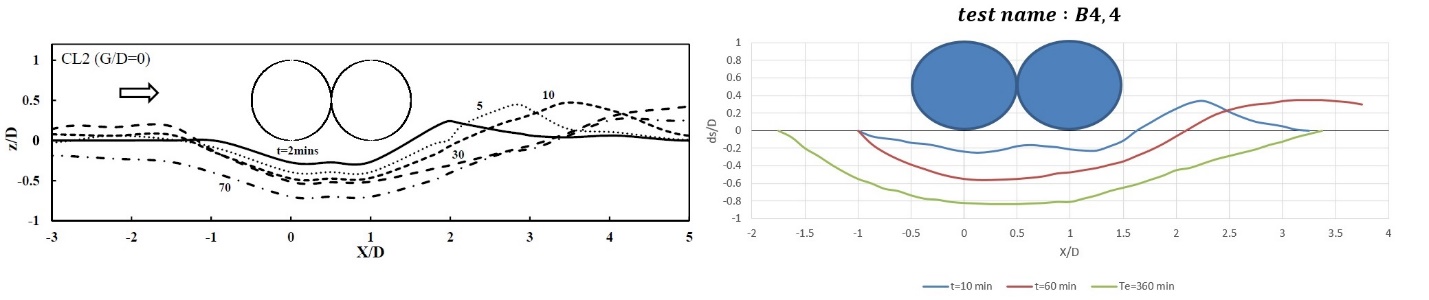 | Figure 11. Scouring sections related to the test of two pipes with a diameter of 4 cm next to the section presented in the study of Zhang et al. (2017) [7] |
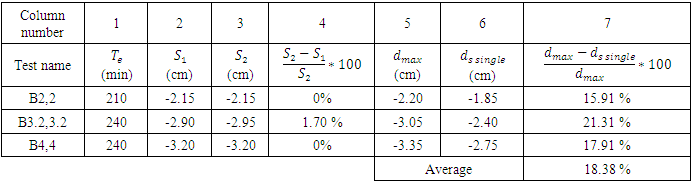
According to Figure 11 and comparison of two scour sections, it can be said that the process of scour sections is similar in these two diagrams and the difference in maximum scour depths is due to differences in pipe diameters. Given the pipe used in the study by Zhang et al. had a diameter of 15 cm, it is certain that the dimensionless scour depth would be smaller than the pipe with a diameter of 4 cm. Also, differences in the criteria for stopping experiments can be a reason for differences in scour depths. The results of 3 two-pipe experiments with the same diameter are presented in Table 3.Table 3. Results of two-pipe tests with the same diameters
 |
| |
|
The values in column 4 of Table 3 show that the scour depths below the upstream and downstream pipes are very close to each other and can be said to be equal  By examining Figure 11 and columns 2, 3, and 4 of Table 3, it can be said that the place of formation of the maximum scouring depth under the pipes
  was between two pipes. Also column 7 of Table 3 shows that the maximum scouring depth for two pipes without spacing had increased by an average of 18.38% compared to the single-pipe experiment with the corresponding diameter.According to the above points, it can be concluded that when two pipes of the same diameter, without distance from each other, were affected by flow, they acted as an interconnected object and the general shape of the scour profile formed was very similar to the scour profile of a single pipe. The difference was that in the case of two pipes, due to the placement of two pipes next to each other, the width of the scour hole increased and by intensifying the vortices formed, it increased the scour depth by about 18%.
3.3. Two-Pipe Tests with different Diameters
Studies on the scouring of pipe groups had all used and discussed pipes of the same diameter. In this part of the study, the two-pipe experiments with different diameters were performed to investigate and identify the scour section below them.The test of this section included two-pipe tests in which pipes of different diameters, without spacing, were placed in two modes, S-B and B-S. The  ratios in these experiments were 1.25, 1.6, and 2. Figure 12 shows the scouring sections obtained during these 6 experiments.
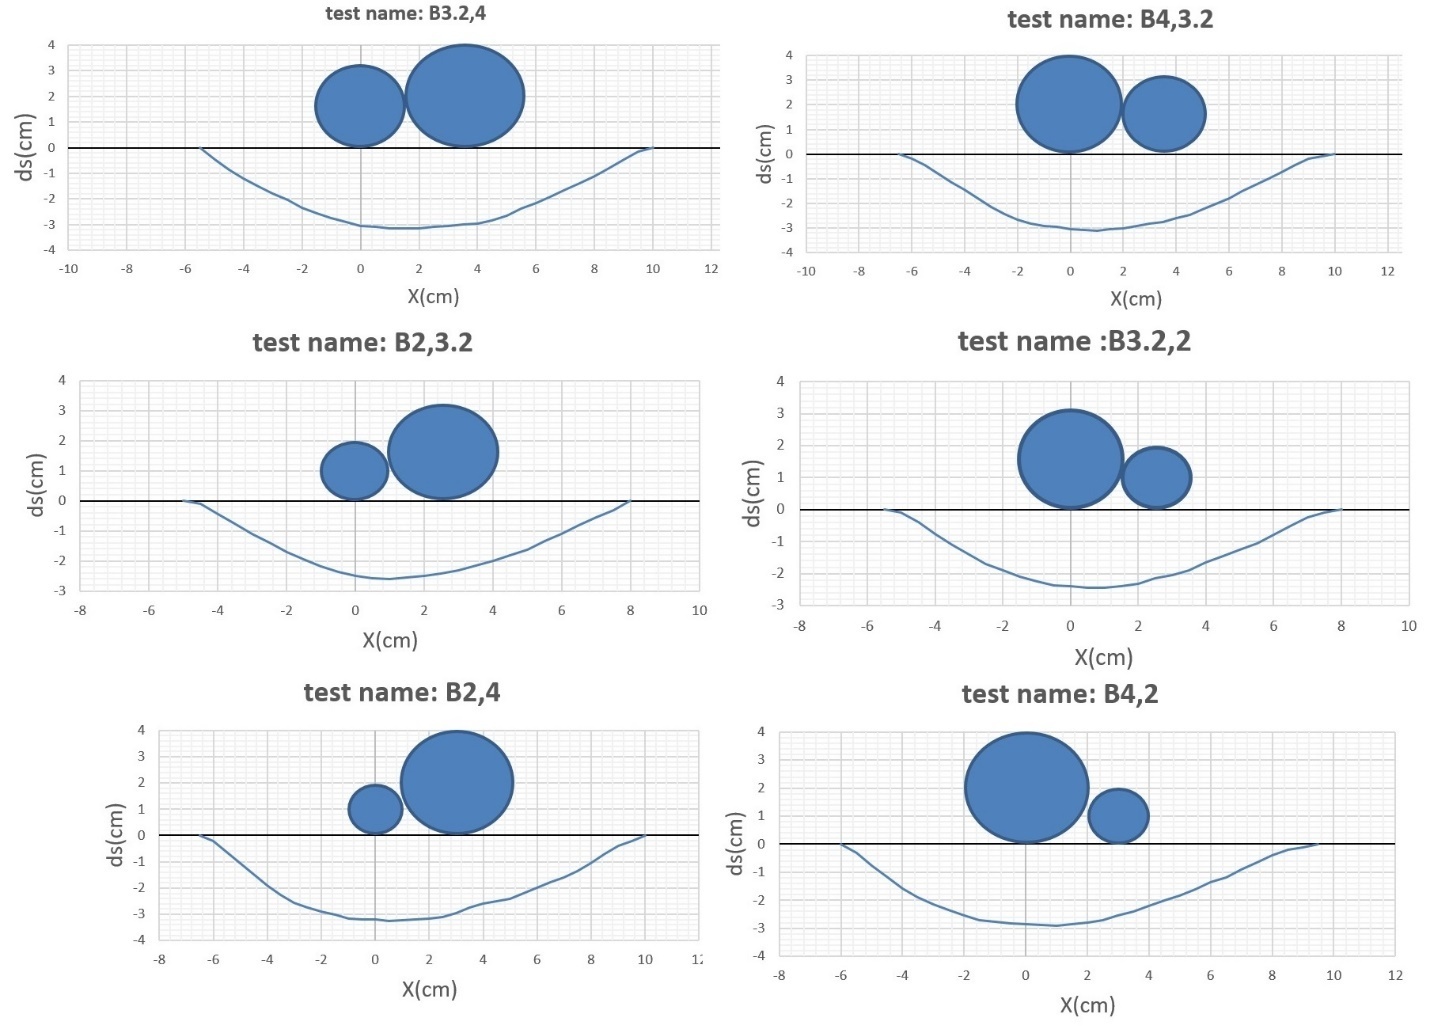 | Figure 12. The scour profiles of two-pipe tests with 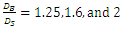 in S-B and B-S modes in S-B and B-S modes |
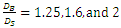
According to Figure 12, it is possible to understand, to some extent, the differences between scour sections in the two cases tested. Examination of this figure shows that the scouring section formed in the experiments performed in S-B mode was very similar to the scouring section of two-pipe experiments with the same diameter that the maximum scouring depth formed in the distance between the two pipes and the scouring depth occurred under the upstream and downstream pipes had just a little difference. However, the scouring section for the B-S tests was different and the upper part of the scouring hole was deeper than the downstream part of the hole. In other words, the maximum scouring depth formed near the upstream pipe and the scouring depth formed under the downstream pipe was significantly different from the scouring depth of the upstream pipe. For a review of the results of these 6 experiments, their results are given in more detail in Table 4.Table 4. Results obtained from two-pipe tests with
 in S-B and B-S modes in S-B and B-S modes
 |
| |
|
Examination of columns 7 and 8 of Table 4 confirmed the above points based on the experimental diagram. The numbers in these two columns of the table showed that regardless of the  ratio, the maximum scouring depth in the S-B mode formed between the two pipes and the scouring depth occurred below the upstream and downstream pipes were slightly different (less than 10% ) from the maximum scouring depth. But in the B-S case, the maximum scouring depth formed near the upstream pipe (larger diameter pipe) and the difference between the upstream pipe scouring depth and the maximum scouring depth was very small (less than 4%). At the same time, the difference between the maximum scouring depth and the downstream scouring depth was significant (more than 12%).According to the above paragraph, it can be concluded that for two pipes with different diameters, the location of the larger pipe determines the location of the formation of maximum depth of scouring. In the S-B mode, because the larger diameter pipe is in the downstream, the scouring cavity extends below this pipe and the maximum scouring depth formed near this pipe. In the B-S mode, where the larger diameter pipe was located in the upstream, the resulting vortices deepened the scouring hole near this pipe, creating the maximum scouring depth at this point, and the scouring hole below the downstream pipe developed less. Column 9 of Table 4, which shows the difference between the scour depths occurred under the upstream and downstream pipes, confirmed the above results.Examining column 6 of Table 4, it can be seen that for each of the
  ratios, the maximum scour depth was always greater in the S-B mode than in the B-S mode. Table 5 shows the differences between the maximum scour depth in the two modes S-B and B-S for each of the
  ratios.
 Table 5. Differences between the maximum scour depth in the two modes S-B and B-S for each of the
 ratios ratios
 |
| |
|
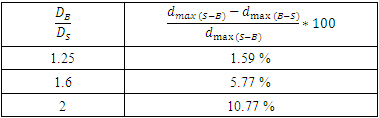
Table 5 shows that at a constant  the maximum scour depth formed in the S-B mode was always greater than in the B-S mode, and the higher
  ratio, the greater difference. Figure 13 shows this difference relative to the
  ratio.
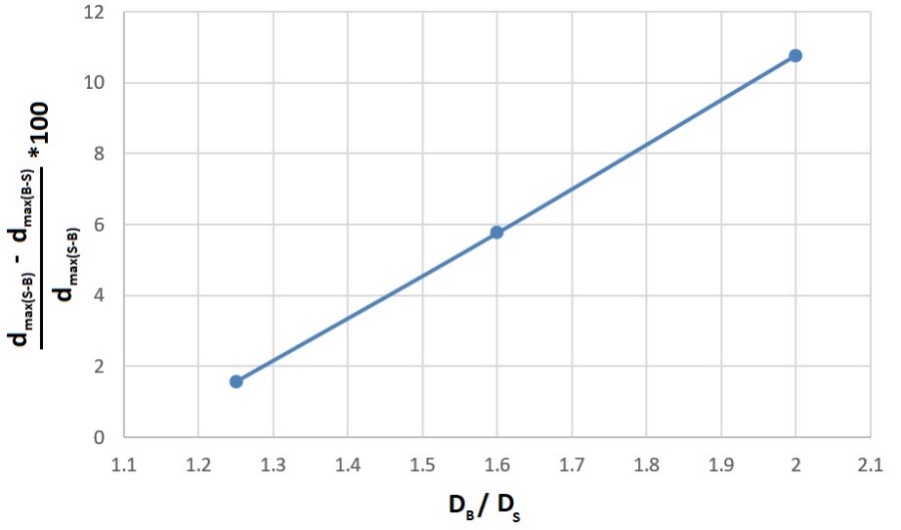 | Figure 13. Differences between the maximum scour depth in the two modes (S-B and B-S) relative to the  ratio ratio |
Based on Figure 13, it can be said that the difference between the maximum scour depth in the two modes S-B and B-S was linearly related to the  ratio.
3.4. Three-Pipe Tests
Three-pipe tests were performed with the aim of verifying the confirmation or non-confirmation of the results obtained from the two-pipe tests with different diameters in the three-pipe mode. In this section, using three pipes with diameters of 2.5, 3.2, and 4 cm, two three-pipe experiments in the S-B and B-S modes were performed. Figure 14 shows the scour sections obtained from these two experiments.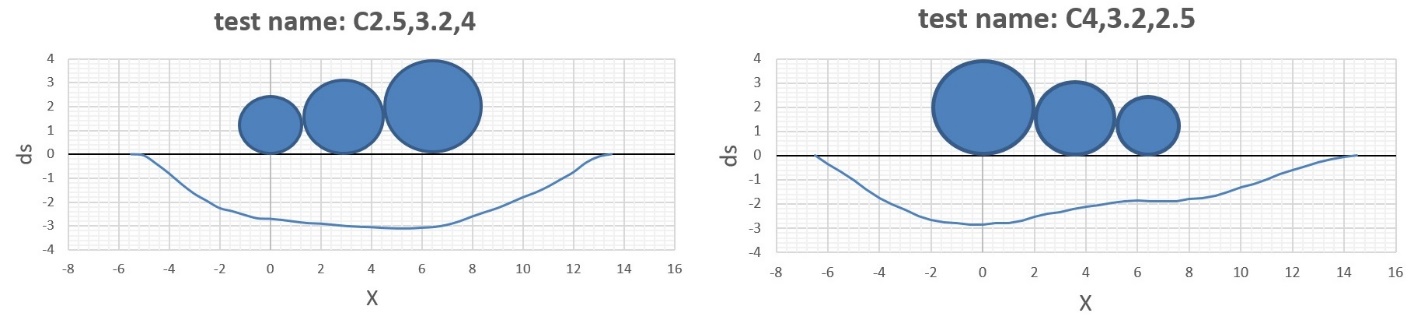 | Figure 14. Scour profiles of three-pipe tests with diameters of 2.5, 3.2, and 4cm in S-B and B-S modes |
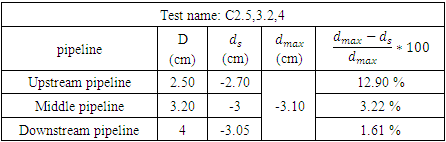
Details of the results obtained from the three-pipe test performed in the S-B mode are given in Table 6.Table 6. Results of three-pipe tests in the S-B mode
 |
| |
|
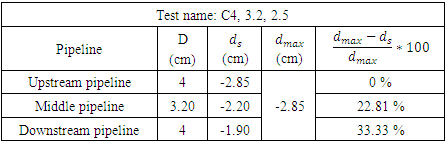
Table 6 shows that like two-pipe test, in the S-B mode of three-pipe test the scouring depth formed near the pipe with a larger diameter and the scouring depth that occurred under the pipes was slightly different from the maximum scouring depth. Results obtained from the three-pipe test performed in the B-S mode are also given in Table 7.Table 7. Results of three-pipe tests in the B-S mode
 |
| |
|
Table 7 shows that in the three-pipe experiments performed in the B-S mode, the maximum scour depth formed below the upstream pipe (the pipe with a larger diameter). Also, the scour depth occurred below the middle pipe and the downstream pipe had a significant difference (22 and 33%, respectively) with the maximum scour depth.Also, comparison of the maximum scour depths of this experiment showed that similar to the two-pipe experiments, this depth was greater in the S-B mode than in the B-S mode. The 2 experiments performed in the three-pipe mode showed that the results obtained from the 6 experiments performed in the two-pipe mode with different diameters also applied to the three-pipe mode.
4. Conclusions
In this study, 15 experiments were performed for scouring in groups of pipelines with different diameters for one-pipe, two-pipe and three-pipe configurations. The main results obtained from these experiments are as follows.1- The results of 4 one-pipe experiments showed that with increasing the diameter of the pipe, the dimensionless scour depth  decreased, which is consistent with the results of Dey & Singh (2008) study. 2- When two pipes with the same diameter were placed next to each other, they acted as an interconnected object and the scour depth under the upstream and downstream pipes was very close to each other and it can be said those were equal. Also, the maximum scour depth increased by an average of 18.38% compared to the single-pipe test with the corresponding diameter. In addition, the place of formation of the maximum scour depth under the pipes
  was between the two pipes.3- The results of 6 experiments performed for two pipes with different diameters showed that the location of the larger pipe determined the location of the maximum scouring depth under pipes. In the S-B case, the maximum scour depth formed near the downstream pipe and in the B-S case near the upstream pipe. In the B-S case, the scour depth below the downstream pipe was significantly different from the maximum scour depth.4- In two-pipe experiments with different diameters, for each of the
  ratios, the maximum scour depth generated in the S-B mode was always greater than in the B-S mode. The difference between the maximum scour depth under the pipes in S-B and B-S was directly and linearly related to the ratio of larger pipe diameter to smaller pipe diameter
  and the higher the ratio, the greater the difference.5- The results obtained from two pipes with different diameters also applied in the case of three pipes. In the case of three pipes with different diameters, the maximum scouring depth formed near the larger diameter pipe and the maximum scouring depth that occurred under the pipes in S-B mode was greater than in the B-S mode.6- According to the results of this study, it can be said that if in a project it is decided to place pipes with different diameters next to each other, the most optimal situation in terms of scouring is the case where the pipes are placed in descending (in terms of diameter) (B-S mode).
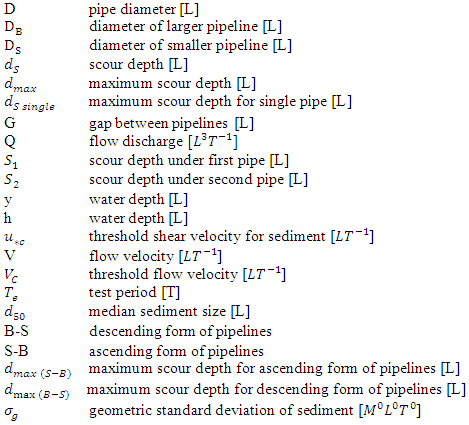
Notation
References
| [1] | Xue-Feng Zhao, Qin Ba, Le Li, Peng Gong, Jin-Ping Ou, “ A three-index estimator based on active thermometry and a novel monitoring system of scour under submarine pipelines “, Sensors and Actuators A 183 (2012) 115-122. |
| [2] | Saeid Maddah Kolur, Fereshteh Kolahdouzan, Amid Pahlavan, Vijay P. Singh, Hossein Afzalimehr, “ Experimental Investigation of Scouring around Piggyback Pipelines in Different Arrangements “ , American Journal of Environmental Engineering 2021, 11(1): 16-20. |
| [3] | Jiecheng Yang, Ying Min Low, Cheng-Hsien Lee, Yee-Meng Chiew, “ Numerical simulation of scour around a submarine pipeline using computational fluid dynamics and discrete element method “, Applied Mathematical Modelling 55 (2018) 400-416. |
| [4] | Y. Mao, “THE INTERACTION BETWEEN A PIPELINE AND AN ERODIBLE BED,” Ser. Pap. Tech. Univ. DENMARK, no. 39, Mar. 1986. |
| [5] | Subhasish Dey and Navneet P. Singh, “Clear-Water Scour below Underwater Pipeline under Steady Flow“, Journal of Hydraulic Engineering. 2008. 134: 588-600. |
| [6] | Ming Zhao, Shailesh Vaidya, Qin Zhang, Liang Cheng, “ Local scour around two pipeline in tandem in steady current “, Coastal Engineering 98 (2015) 1-15. |
| [7] | Qin Zhang, Scott Draper, Liang Chang, Ming Zhao and Hongwei An, “ Experimental Study of Local Scour Beneath Two Tandem Pipelines in Steady Current “, Coastal Engineering Journal, Vol. 59, No. 2 (2017) 1750002 (22 pages). |
| [8] | Yuzhu Li, Muk Chen Ong, David R. Fuhrman, Bjarke Eltard Larsen, “ Numerical investigation of wave-plus-current induced scour neneath two submarine pipelines in tandem “, Coastal Engineering 156 (2020) 103619. |
| [9] | Nima Ataollahi, Marziyeh Khabari, Ehsan Shahiri Tabarestani, Vijay P. Singh, Hossein Afzalimehr, “ Interaction of Three-Dimensional Pool-Riffle Sequence and the Flow Characteristics in the Presence of Wall Vegetation “, Journal of Civil Engineering Research 2021, 11(2): 51-61. |
| [10] | Shaopeng Yang, Bing Shi, Yakun Guo, “Investigation on scour scale of piggyback pipeline under wave conditions “ , Ocean Engineering 182 (2019) 196-202. |
| [11] | Melville, B.W., and M. Sutherland, 1988. Design method for local scour at bridge pier. Journal of Hydraulic Engineering, 114(10): 70-82. |

 Abstract
 Reference
 Full-Text PDF
 Full-text HTML