-
Paper Information
- Paper Submission
-
Journal Information
- About This Journal
- Editorial Board
- Current Issue
- Archive
- Author Guidelines
- Contact Us
American Journal of Fluid Dynamics
p-ISSN: 2168-4707 e-ISSN: 2168-4715
2018; 8(3): 73-83
doi:10.5923/j.ajfd.20180803.01

Hydrodynamic Performance of a Novel Ocean Wave Energy Converter
 Abstract
 Reference
 Full-Text PDF
 Full-text HTML
Aliakbar Babajani
Department of Mechanical Engineering, Shahrekord University, Shahrekord, Iran
Correspondence to: Aliakbar Babajani, Department of Mechanical Engineering, Shahrekord University, Shahrekord, Iran.
| Email: |  |
Copyright © 2018 The Author(s). Published by Scientific & Academic Publishing.
This work is licensed under the Creative Commons Attribution International License (CC BY).
http://creativecommons.org/licenses/by/4.0/

Ocean waves are one of the energy resources which have potential to fulfil some parts of the world’s energy requirements. Recently, existing OWECs have been evaluated to find the most appropriate systems for the wave energy extraction of the Caspian Sea. Hence, point absorbers are found to be the most appropriate devices for this sea. Generally, the aim of this study is to study a novel ocean wave energy converter named “Searaser” which may be economical and practical for the Caspian Sea. Thus, this study presents a numerical simulation of Searaser inside a wave tank using commercial software (Flow-3D). In order to validate the simulations, the numerical and experimental results were compared with a point absorber and the both were in reasonable agreement. Afterwards, the performance of Searaser was numerically calculated for different heights of ocean waves. Accordingly, the obtained results indicate that the output flow rate and the power generation increase significantly by increment of wave heights, and using this device may have the potential to be practical and profitable for industrial applications by improving its system.
Keywords: Searaser, Ocean Wave Energy Converter (OWEC), Computational Fluid Dynamics (CFD), Renewable Energy, Flow-3D
Cite this paper: Aliakbar Babajani, Hydrodynamic Performance of a Novel Ocean Wave Energy Converter, American Journal of Fluid Dynamics, Vol. 8 No. 3, 2018, pp. 73-83. doi: 10.5923/j.ajfd.20180803.01.
Article Outline
1. Introduction
- Fossil fuels as the major source of energy have several disadvantages like environmental hazards, rising prices, climate change. On the other hand, renewable energies such as ocean wave energy, solar energy, and wind energy are sustainable sources which will never run out. Furthermore, these types of energy sources generate electricity without producing any hazardous products such as carbon dioxide (CO2) or any other chemical pollutants, so they can supply the worldwide demands of electricity. In recent years, the wave energy as a renewable energy has attracted the interest of many researchers and companies due to its incredible advantages. Wave energies have several benefits in comparison with other renewable energies, for instance they are more available, predictable, and higher energy densities, which can produce more power with lower cost. To capture the flow field, some methods are used including computational fluid dynamics [1] for different applications such as heat transfer [2-4] and turbomachinery [5, 6] or other techniques using image processing [7-9] which they have shown a good agreement between numerical and experimental results. The main reason why the numerical approach is used in this research is to evaluate the capability of Flow-3D for energy convertor, since experimental tests are very expensive. Therefore, numerical simulation can be a solution to minimize the costs.In general, there are diverse types of wave energy converter (WEC) systems. WEC is categorized in four different groups including oscillating water column, overtopping device, attenuator, and point absorber [10]. In the first group, the oscillating water column (OWC) operates on the principle of air compression and decompression. In fact, the air compression and decompression drive the turbine by rising and descending the water in the chamber. For example, spare buoy is a simple form of oscillating water columns [11]. Recently, some theoretical optimization studies have carried out for spare buoys [12, 13]. The best known turbines for OWCs are Wells and Impulse turbines [11]. Falco et al. [14, 15] compared Wells turbine and new biradial Impulse turbine. The result showed that single stage Wells turbines do not have high efficiency for this case and biradial turbines are the best choice in terms of performance.In the second group, the overtopping devices utilize the wave velocity for filling a reservoir located in the higher level than the ocean surface, and then the water falls in low-head turbines to produce electricity. Some familiar examples of overtopping devices are Wave Dragon [16], SSG [17-19] and WaveCat [20]. Additionally, a new type of overtopping device named overtopping breakwater for energy conversional (OBREC) is under development which includes the rubble mound breakwater with frontal reservoir. Diego et al. [21] compared the result of this innovative WEC with traditional rubble mound overtopping device, proposed new formulae for hydraulic performance, and loading on the front reservoir.In the third group, the attenuators have multiple floating segments connected to each other and these buoys are parallel to the wave direction. In fact, the waves cause the segments to move relative to each other, which this motion concentrated at the joints is used to pump high pressure oil through hydraulic motors and these motors drive electrical generators to produce electricity. Pelamis is a snake-like device that consists of cylindrical bodies connected together [22]. Furthermore, there are other famous attenuators such as Wave Star [23], Salter Duck and Anaconda [24].In the last group, the point absorbers convert energy by capturing the wave’s heaving motion. In fact, the buoys employ the vertical motion of waves to compress gas or liquid; then this fluid drives the power generator and produce electricity. Totally, point absorbers can be divided into single-body or multiple-body devices. Single-body point absorbers move through a fixed seabed case and multiple-body devices generate electricity by motion of two bodies relative to each other [25]. In comparison to other types of WECs, point absorbers are simple and small devices which can be used in different depths of water in offshore areas. In addition, many researchers have focused on modeling the point absorbers to find this system as the most cost-efficient technology of wave energy extraction [26], and It has been proved that the best usable system in the Caspian Sea (specifically in the southern basin) is a point absorber [24]. To produce considerable energy, point absorbers can be attached to each other in parallel or series forms [26, 27]. Over the past decade, many studies have been carried out to investigate the hydrodynamic performances of energy converters; however, recent researches indicate that using numerical is capable of measuring noise generation due to pressure fluctuations [28, 29], and it is necessary to employ these techniques for energy converters in the future.In 2013, Alivin Smith [30] invented a novel OWEC named “Searaser” based on the registered patent. According to the inventor’s patent, this invention has exceptional benefits in compared with other type of OWECs, which will be completely mentioned in section 2 (Description of Searaser). In the current study, the performance of Searaser in a wave tank was studied by solving Navier-Stokes equations. Hence, a commercial CFD code (Flow-3D) which is appropriate for numerical modeling of WEC has been used to solve the governing equations. One can also use other multiphasic software such as Abaqus for this purpose which offers a variety of user friendly subroutines [31, 32]. In order to validate the hydrodynamic results, the hydrodynamic performance of a point absorber was calculated by this software which the difference of numerical and experimental data was acceptable. Afterwards, the performance of Searaser with geometric dimensions based on the extracted data from patent was numerically evaluated for varied wave heights. Eventually, the obtained results demonstrate that the power generation obviously increases by the increment of wave heights.
2. Description of Searaser
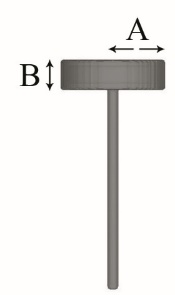
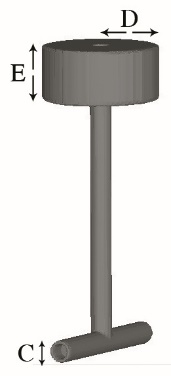
- This novel technology named “Searaser” which can be used as a water pump to generate electricity was invented by Alvin Smith and registered as a patent [30]. Indeed, Searaser is a new device in order for utilizing hydro-power as a renewable energy source. As shown in Fig.1, Searaser consists of a cylinder attached to a piston. This piston is forced upwards by the buoyancy force since it is floating on the water surface when the ocean waves approach the device. Afterward, the gravity force of body overcomes other forces such as dynamic forces and wall friction after passing waves, and it causes to move buoy downward gradually.
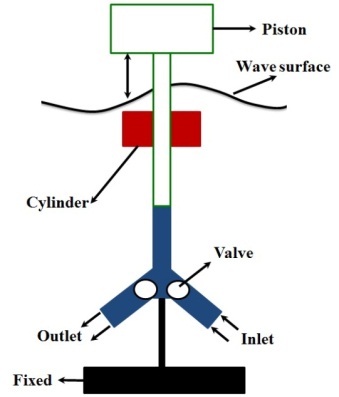 | Figure 1. Different components of Searaser |
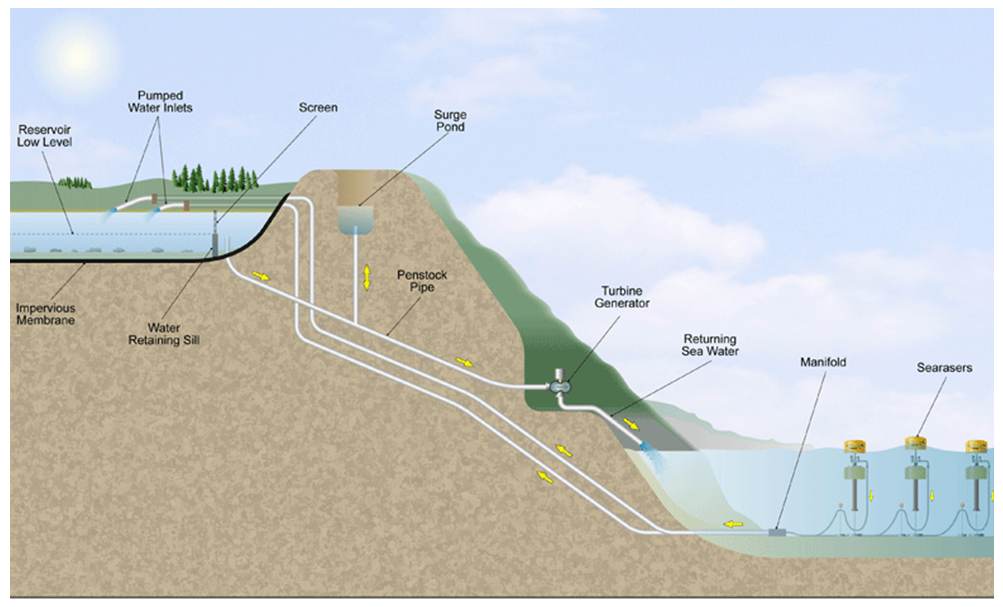 | Figure 2. Cycle of electricity generation via Searaser. (www.searaser.net) |
 | Figure 3. Transferring output water from Searaser inside wind turbine |
3. Governing Equations
- To perform parametric study and avoid experimental expenses in flow simulation problems [33, 34] numerical approach using Flow-3D was considered. Flow-3D uses a unique technique named FAVOR to describe geometric objects in a computational domain which is based on the concept of area fraction (AF) and volume fraction (VF) in a rectangular structured mesh. The VF is defined as the ratio of open volume to the total volume in a cell whereas three AF’s (AFR, AFB, AFT) are defined for three cell faces respectively in the direction of increasing cell-index as the ratio of the open area to the total area. This FAVOR technique works well with complex geometries by introducing the effects of AF and VF into the conservation equations of fluid flow. This technique has led to the successful development of a general moving object (GMO) capability which in principle permits the modelling of any type of rigid body motion (six degree of freedom, fixed axis and fixed point) on a fixed-mesh. This particular simulation is the application of this GMO model to a fixed axis dynamically coupled motion of WRASPA and Searaser. Solver calculates AF and VF at each time step which describes object’s motion through a fixed-rectangular mesh. Hydraulic, gravitational, and control forces and torques are calculated and equations of motion for the rigid body are solved explicitly for translational and rotational velocities of moving objects under a coupled motion.
3.1. Equations of Movement (Rigid Body)
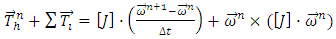
- In general, each motion of a rigid body can be divided into translational and rotational movements. The velocity of each single moving point is equal to the optional base point velocity plus the velocity that is originated from the rotation of the body around the base point. For movement in 6 degrees of freedom, the general moving object (GMO) model considers the mass center of the body (G) as the base point. The equations for 6 degree of freedom movement are divided into two separate following equations [35]:
 | (1) |
 | (2) |
 is the angular velocity (rad/s),
  is the velocity of mass center (m/s),
  is the total force (N), m is the mass of the rigid body(kg),
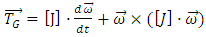
  is the total torque (N.m) about G and
  is the moment of inertia tensor (kg.m2) about G in a body proportional referenced system. Total force and total torque are calculated as the summation of some different components as follow:
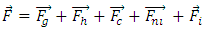 | (3) |
 | (4) |
 is the gravitational force,
  is the hydraulic force that is due to pressure field and shear forces of the wall on the moving body,
  is the net control force of the network that can be used for controlling and confining the rigid body motion,
  is the non-inertial force when the rigid body moves in a non-inertial space system. Therefore, in this case there is no
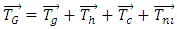
  so
so 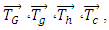 and
and  are the total torque, gravitational torque, hydraulic torque, control torque and non-inertial torque around the mass center of the rigid body, respectively. The continuity and momentum equations for a moving body and the relative transport equations for the volume of the fluid function (VOF) are as follow:
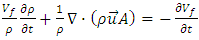 | (5) |
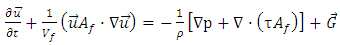 | (6) |
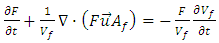 | (7) |
 is the fluid density (kg/m3) (water in this case),
  is the velocity of fluid (m/s),
  is the volume fraction,
  is the area fraction,
  pressure (pa),
  the viscous stress tensor (pa), G gravity (m/s2) and F is the fluid fraction. For coupling of the GMO’s motion, equation (1) and (2) should be solved in each time step and the situation of all the objects is recorded and the volume fraction is updated by FAVOR technique. Equation 5 and 6 can be solved by substitution of
  in right- hand side of both equations with the following form:
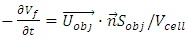 | (8) |
 and
and  are the surface area (m2), surface normal vector, the velocity of moving object (m/s) in a mesh cell and the total cell volume (m3) respectively. Equation 1 and 2 are solved by the explicit GMO method with the following discretised equations:
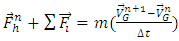 | (9) |
 | (10) |
 and
and  are the sum of all force and torque elements except hydraulic parts. In each time step, after calculating
 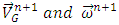 in the same way, the fluid velocity and pressure field are obtained by duplicately solving the momentum and continuity equations [36].
4. Validation
- In order to verify the numerical results in Flow-3D, a point absorber named “WRASPA” was simulated exactly similar to the experimental model in reference [35] to compare the numerical and experimental data. In Fig.4, the geometry and dimensions of simulated WRASPA are shown clearly.
 | Figure 4. Geometry and dimensions of simulated point absorber (WRASPA) |
 | Figure 5. a) Schematic of meshing the wave tank and WRASPA, b) Axis and dimensions including boundary conditions |
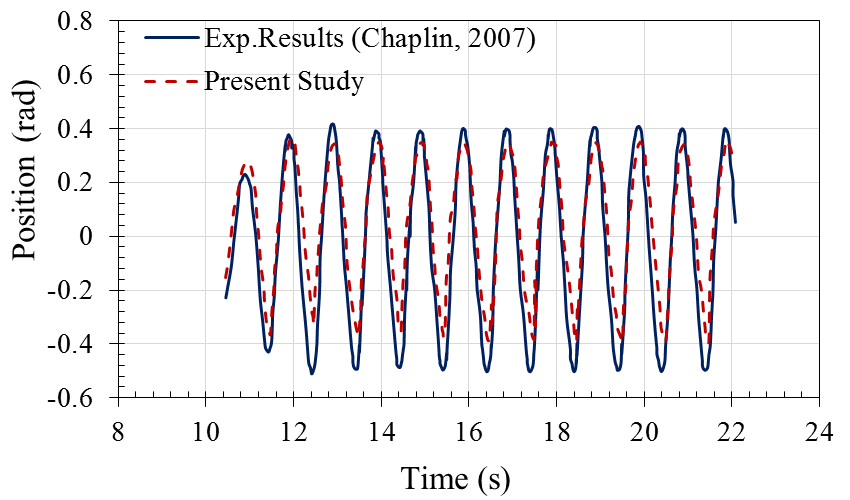 | Figure 6. Comparison of numerical and experimental results for angular rotation |
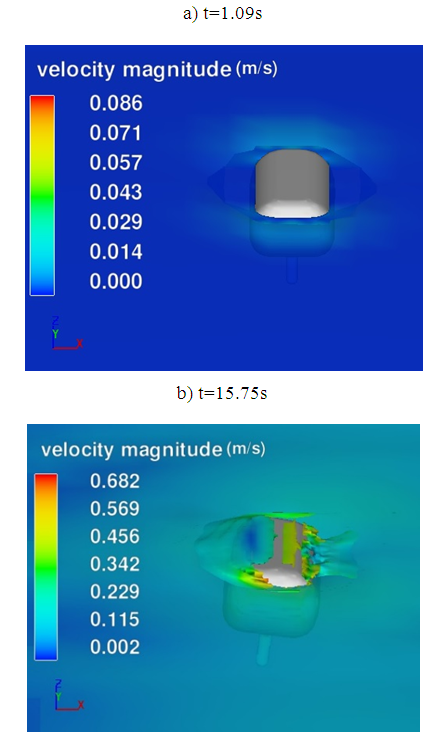 | Figure 7. Velocity contour of simulated WRASPA, a) t=1.09s, b) t=15.75s |
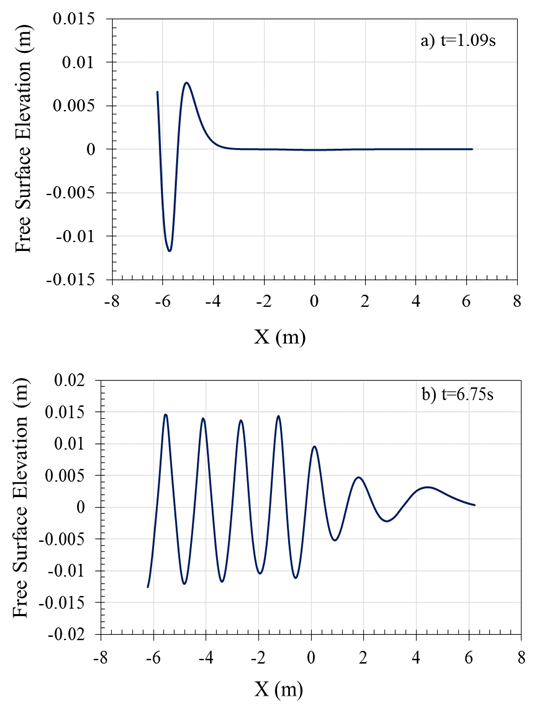 | Figure 8. Free surface elevation of wave for different times; a) t=6.75s, b) t=1s |
5. Searaser Modeling
5.1. Geometrical Dimensions and Components
- In this study, Alvin Smith’s second scheme (modified model) was chosen for simulation including 4 main bodies as follow:a) BuoyThe buoy radius and height are A=2.6m and B=1.5m, respectively. This buoy is inserted 10.1m deep in the pumping duct. The radius of this part is considered equal to radius of the pumping case to prevent leakage from the edges. As shown in Fig.9, the buoy is not completely filled and a cylindrical space with the radius of 2.3m and height of 0.5m is extracted from the buoy. As the buoy should overcome the water column and also push the accumulated water, the net weight of this buoy is 9000kg. In order to construct this device, specific composite material is usually utilized to prevent the corrosion caused by water; also the buoy should be filled with sand, water to have the reasonable weight since the composites are lightweight. Furthermore, the buoy was designed to be capable of moving only in vertical direction (the gravity direction) because the vertical duct does not allow it to move toward other directions.
 | Figure 9. Schematic of first component-buoy |
 | Figure 10. Schematic of second component-chamber |
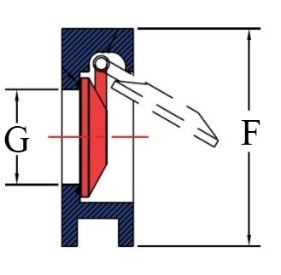 | Figure 11. Schematic of outlet and inlet valve- Wafer Swing Check Valve |
5.2. Boundary Conditions and Mesh Blocks
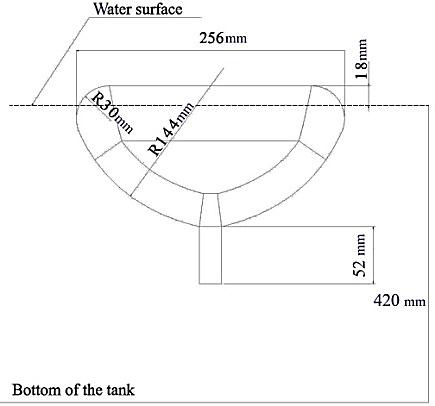
- In the present work, meshing the solution domain was extremely important because the fluid and solid were moving simultaneously. According to the ability of meshing in this software, three mesh blocks were generated with structure type to improve the accuracy of calculations. As indicated in Fig. 12, X and Y coordinate axes were on the center of upper buoy and Z axis was in direction of ground gravity. In Fig. 12, the abbreviation of WV, S, O, and W stand for wave, symmetry, outflow and wall conditions. In addition, the RNG (k-ε) turbulence model was utilized to model the turbulent flow while the wave was sinusoidal.
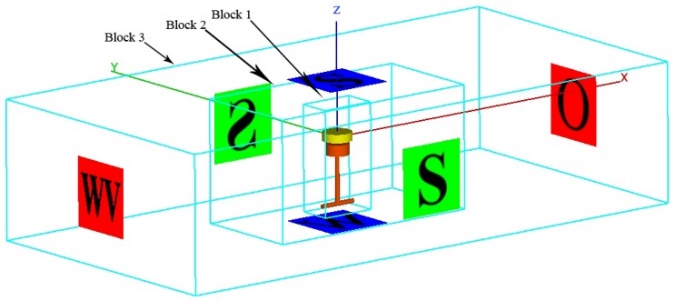 | Figure 12. Boundary conditions and mesh blocks |
6. Grid Independency
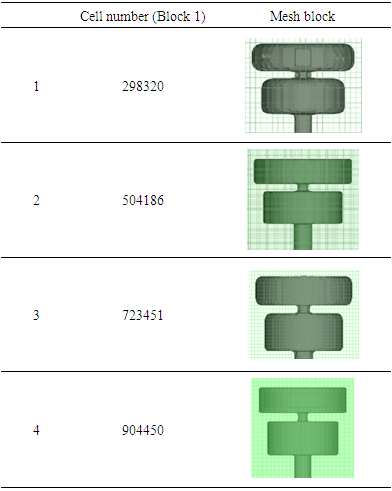
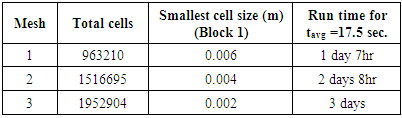
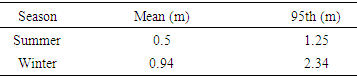
- Grid study is usually essential to acquire the number of a sufficient grid. Therefore, four grids were generated with 298320, 504186, 723451, and 904450 cell numbers (Block 1) in order to simulate a 3D Searaser for a moving wave with the height of 1.25m. As shown in Table 1, the numbers of grids were increased in mesh blocks to enhance the accuracy of the solution. In Fig.13, the volume flow rate was measured for various times in the outlet valve. By comparing the curves, it was quite obvious that the grid with 504186 cells was suitable for the present study. Thus, this grid was chosen for all simulations of this research.
|
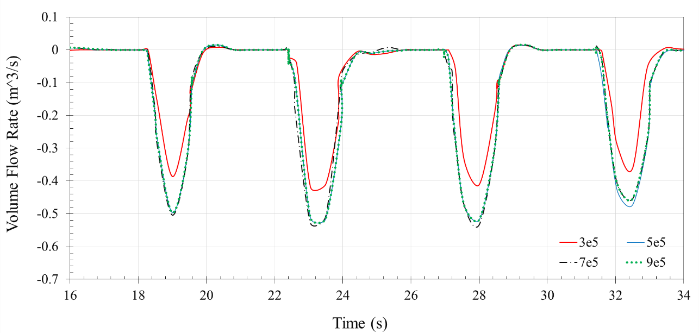 | Figure 13. Comparison of outlet volume flow rate for a wave amplitude 1.25m |
|
7. Results and Discussion
- In Fig.14, hydrostatic pressure contour was depictured in three dimensions for wave tank. As it can be seen in this figure, the wave generation starts from Xmin moving toward the Xmax after passing the Searaser. As shown, hydrostatic pressure increases linearly in the wave tank because the water depth linearly grows up.
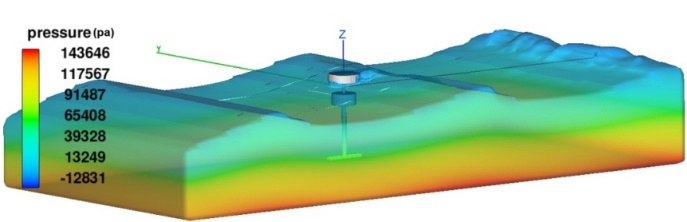 | Figure 14. Hydrostatic pressure contour in the wave tank |
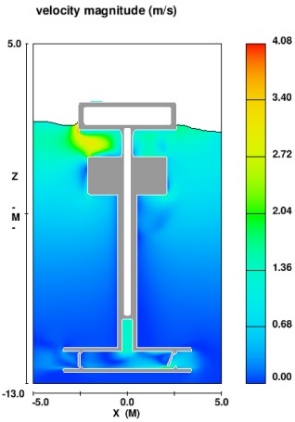 | Figure 15. Velocity contour in the suction occasion time 21s |
|
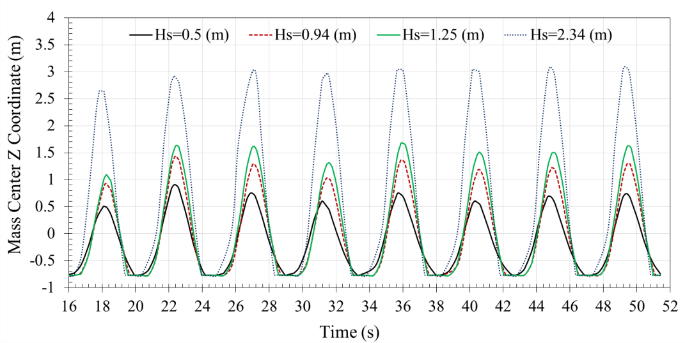 | Figure 16. Displacement of mass center for buoy in wave heights 0.5m, 0.94m, 1.25m, and 2.34m |
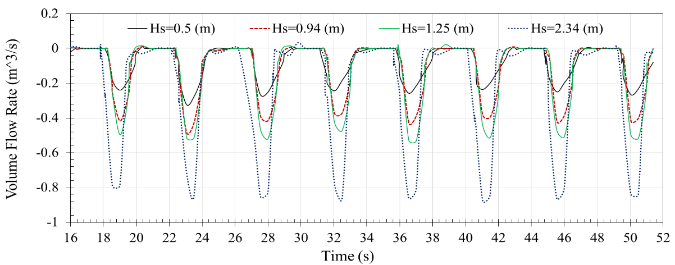 | Figure 17. Output volume flow rate from the outlet valve for various times in wave heights 0.5m, 0.94m, 1.25m, and 2.34m |
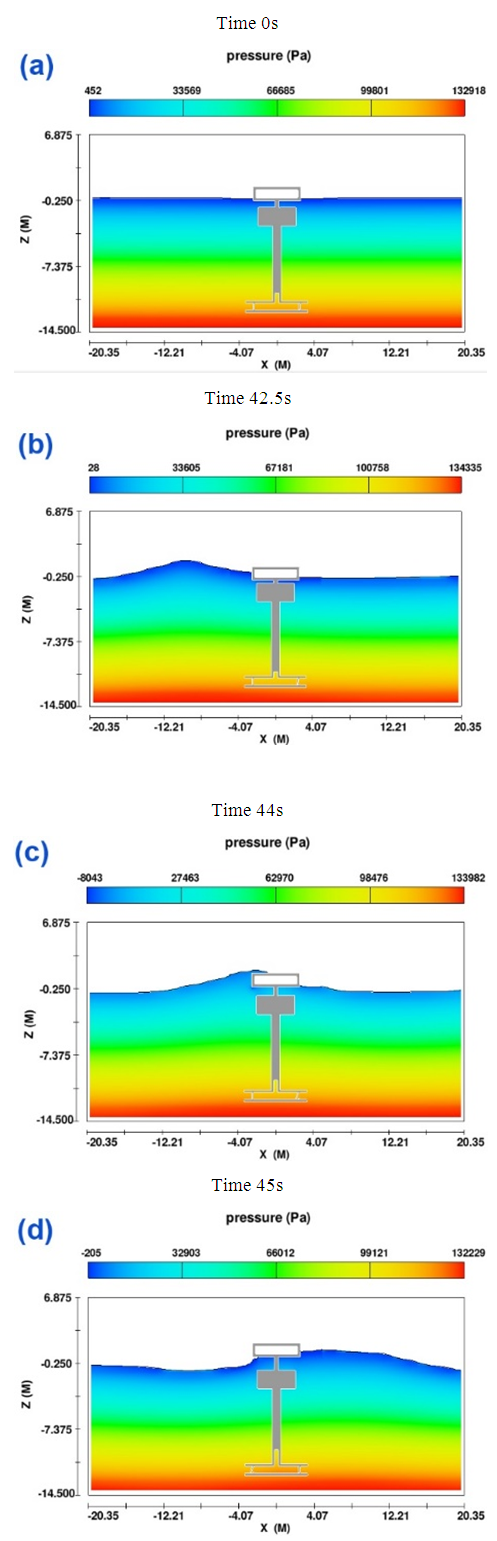 | Figure 18. Pressure contour of wave motion at different times 0s, 42.5s, 44s, and 45s |
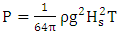
 is the output power (w) [40].
 | (11) |
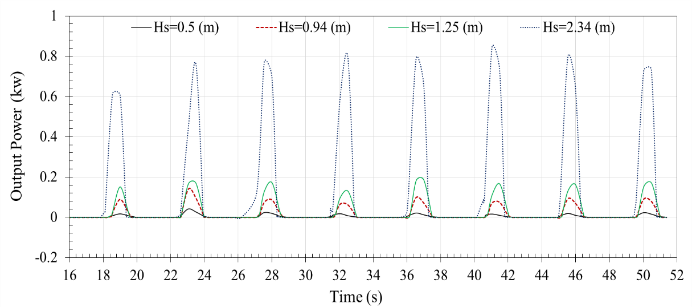 | Figure 19. Output power of Searaser for four wave heights |
 | (12) |
|
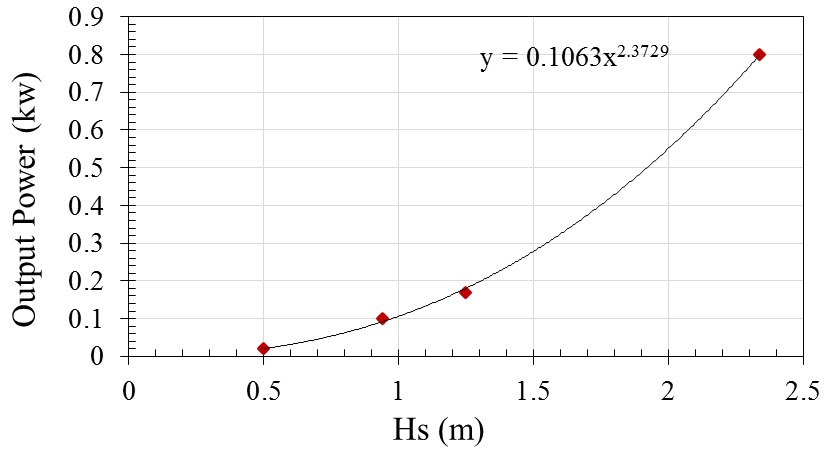 | Figure 20. Curve of output power versus Hs |
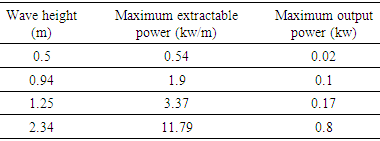
8. Conclusions
- In recent years, ocean wave energy converters have been investigated to find the most appropriate system to harvest the wave energy in Caspian Sea. Hence, the commercial software (Flow-3D) was employed to simulate a novel wave energy converter Searaser invented by Alvin Smith. In this simulation, the upper buoy of the converter was designed to move up by the ocean waves generated in a 3D numerical wave tank. Afterwards, some significant parameters of Searaser were computed to capture some parameters such as output fluid flow, extractable wave power, and output power. In fact, these parameters were calculated based on the summer and winter data when the wave heights are variable in Caspian Sea. Consequently, the extractable power and the output power values increase during the winter in comparison with the summer at the same conditions in the Caspian Sea. According to the obtained results, output power has a non-linear dependency on the wave height. Additionally, the numerical results indicate that each Searaser has excellent potential to pump the ocean water in an upper pool; therefore, this water can be utilized with a Francis turbine to produce electricity on demand.