-
Paper Information
- Paper Submission
-
Journal Information
- About This Journal
- Editorial Board
- Current Issue
- Archive
- Author Guidelines
- Contact Us
American Journal of Fluid Dynamics
p-ISSN: 2168-4707 e-ISSN: 2168-4715
2018; 8(1): 30-39
doi:10.5923/j.ajfd.20180801.04

Wave-induced Currents in the Northern Gulf of Oman: A Numerical Study for Ramin Port along the Iranian Coast
 Abstract
 Reference
 Full-Text PDF
 Full-text HTML
Ehsan Isaie Moghaddam 1, Habib Hakimzadeh 2, Mohammad Nabi Allahdadi 3, Ardalan Hamedi 4, Ali Nasrollahi 5
1Faculty of Civil Engineering, Sahand University of Technology, Tabriz, Iran,
2Faculty of Civil Engineering, Sahand University of Technology, Tabriz, Iran
3North Carolina State University, Department of Marine, Earth and Atmospheric Sciences, Raleigh North Carolina, USA
4Head of Civil and Marine Structure of Pishahangan Amayesh Consultant Engineering, Tehran, Iran
5Noandishan Fan va Tejarat Company, Tehran, Iran
Correspondence to: Mohammad Nabi Allahdadi , North Carolina State University, Department of Marine, Earth and Atmospheric Sciences, Raleigh North Carolina, USA.
| Email: |  |
Copyright © 2018 by the authors and Scientific & Academic Publishing.
This work is licensed under the Creative Commons Attribution International License (CC BY).
http://creativecommons.org/licenses/by/4.0/

The spectral wave model Mike 21-SW coupled with the hydrodynamics model HD-FM was used to study nearshore wave and wave-induced currents at Ramin Port in the north of the Gulf of Oman with the main objective of prescribing solutions for sedimentation inside the port basins. Computational meshes with triangular elements were used in regional and local scales to determine nearshore wave characteristics and their induced coastal currents. Regional model covering the offshore area and vast areas in the east and west of Ramin Port was successfully evaluated using wave data measured by buoy located at outer tip of eastern Chabahar Bay. Simulation of coastal currents for three different monsoon and non-monsoon wave events that are dominant over the study area showed that coastal currents flow to the port minor basin and form cyclonic genres that contribute in carrying and depositing coastal sediments inside the port basins. Current patterns were in good agreement with historical sedimentation maps of the port basins demonstrating the validity of current and wave simulations.
Keywords: Ramin Port, Wave-induced currents, Sedimentation, Monsoon waves, Numerical modelling
Cite this paper: Ehsan Isaie Moghaddam , Habib Hakimzadeh , Mohammad Nabi Allahdadi , Ardalan Hamedi , Ali Nasrollahi , Wave-induced Currents in the Northern Gulf of Oman: A Numerical Study for Ramin Port along the Iranian Coast, American Journal of Fluid Dynamics, Vol. 8 No. 1, 2018, pp. 30-39. doi: 10.5923/j.ajfd.20180801.04.
Article Outline
1. Introduction
- Wave action and wave-induced currents significantly contribute to the coastal sediment transport that results in coastal morphology evolution. Understanding shallow water wave characteristics, nearshore currents, and sediment transport is a major step in planning beach improvement schemes. Waves and tides mainly drive morphological evolutions of sandy coasts, winds and ocean currents play minor roles [1]. As waves propagate shoreward, they enter the transitional depth region in which the sea bottom influences wave characteristics. Wave celerity and length reduce in response to a decrease in water depth and thereby wave crests rotate so that they approach the orientation of the shoreline (refraction). Furthermore, in the shallow water, waves become steeper and steeper (shoaling) until they break by toppling onto the beach [2]. Wave breaking across the surf zone is associated with high turbulence and energy dissipation, resulting in wave-generated currents and vigorous sediment movement of beach material. Numerical models are widely used for assessment of the hydrodynamics and mechanisms governing morphological changes along the coast. Due to the major advances that have been made in understanding the physical processes and numerical modeling over the past few years, estimation of offshore wave climate, nearshore hydrodynamic data, and coastal processes can be successfully implemented [3, 4].Ramin fishery port on the northern coast of the Gulf of Oman is a clear example of wave contribution on coastal sediment transport and the consequent sedimentation and erosion. Sedimentation problem at the Ramin Port entrance was appeared a short time after the construction of the port breakwaters and frequent dredgings for providing operational depth of navigation for fishing vessels were necessary. To diagnose the sedimentation problem in Ramin Port, a detailed field study was conducted by the Iranian Fishery Organization in 1998. Water surface elevation, mid-depth current speed and direction, longshore sediment transport rate using sediment traps, and sediment grain sizes were measured. Several studies investigated coastal wave transformation and sediment transport along the Iranian coasts of the Gulf of Oman. Nearshore wave propagation, nearshore hydrodynamics, and littoral sediment transport in Iran-Bandar harbor located in outer tip of western Chabahar Bay were simulated and studied by Kamalian [5]. He used several modules of Mike 21 including PMS, BW, and Flow model and concluded that the harbor was protected against the long period swell waves propagating from southeast to south during summer monsoon, but is highly vulnerable to locally generated waves originating from western quadrant. To address the sedimentation and wave agitation problems within the harbor basin, a modified breakwater layout was proposed. Similar studies were carried out for Beris fishery port located 85 Km east of Chabahar. For simulation of wave transformation from deep water to shallow areas Mike 21 was used, and HYDROSED model was used to investigate the wave-induced currents and sediment movement [6]. Construction of a groyne at the tip of the Beris headland or westward development of the existing main breakwater were the alternatives suggested to reduce sedimentation rate induced by swell waves at the port entrance. In the present study, numerical models are used to address the sedimentation inside the port basin and along the shoreline outside of the port.
2. Study Area: Morphological and Met-Ocean Properties
- Ramin Port is located at about 12 Km east of Chabahar Bay on the northern coast of the Gulf of Oman (Figure 1). Within a short time after the port breakwaters were constructed, high amounts of sedimentation inside the port basin and over the port entrance occurred. This significantly decreased operational depths for navigation and caused serious problems for the fishing vessels to access the berthing facilities inside the port basin.
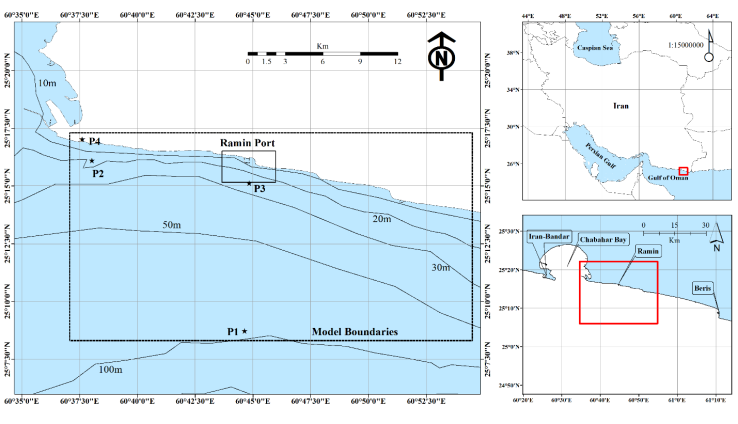 | Figure 1. Study area showing the regional and local model area used for numerical simulation. P1 shows the location of wave hindcast point that was used as the offshore boundary condition for the regional model. Chabahar wave buoy is marked as P2, model output location whose data was used as the seaward boundary condition in the local wave model is shown as P3 and P4 shows the Chabahar Synoptic station |
 = 0.15-0.35 mm, where
  is the average diameter of sediment grains). This range of sediment size along with energetic monsoon waves that are predominant over the study area, result high values of Ω when applied in the context of criterion suggested by Masselink and Short [7]. According to this criterion, high values for Ω is an indication that beach is more likely dissipative. The hydrodynamic and coastal morphology along the Iranian coasts on the Gulf of Oman are substantially affected by wave climatology of the Indian Ocean. The spatiotemporal variability of wave regime over the northern Arabian Sea and the Gulf of Oman reveals that the wave parameters and wave-induced currents of the region vary based on a seasonal manner known as monsoons [8, 9]. Annual wind climate over the Gulf of Oman includes northeasterly monsoon winds during December-March, southwesterly monsoon winds during June-September, and local westerly Oman Sea winds during the transitional period between the two monsoons. The latter is associated with northwesterly Shamal winds that normally occur during winter and summer [10, 11]. In addition to the normal annual variations, the northern Arabian Sea and the Gulf of Oman is rarely impacted by tropical storms generated over the Indian Ocean during summer. These tropical storms can cause extreme waves and influence the Iranian coasts of Oman Sea [12]. The seasonal cycle of winds leads to a seasonal cycle of wave field over the study region [13]. The sea state over the Gulf of Oman exhibits multi-peaked wave spectra resulted from a combination of high energy southerly monsoon waves from the Indian Ocean and higher frequency wind waves from west to southwest that are mainly generated during the non-monsoon periods [14].
3. Data and Method
- In this paper, an attempt is made to examine the wave conditions and nearshore hydrodynamics at the Ramin Port. Study approach mainly includes numerical simulation of nearshore waves for the port area and surrounding shorelines and determining wave-induced currents by feeding the wave generated radiation stresses into a flow model. Wave climate at the boundary of the nearshore wave model (see the local model and point P3 in Figure 1) is obtained from a larger regional model that used offshore wave data as the boundary conditions (point P1 in Figure 1). Offshore wave climate data from two different sources including ISWM (Iranian Seas Wave Modeling) and Monitoring (Monitoring and Modeling Studies of Iranian Coasts) were examined, and the appropriate data was used as the boundary condition for the regional model. Monitoring project is a 22-year study to determine wave climate on the Oman Sea and the Persian Gulf coastline of I.R. of Iran and is based on numerical hindcast data provided by the Iranian Ports and Maritime Organization (PMO). Performance of the regional wave model is evaluated using measurements at Chabahar buoy located in the northwestern corner of the model area (location P2 in Figure 1). Wind data over the study area also compared and contrasted from different sources. Although wind is not directly used as the model forcing, understanding long-term wind climatology at the study area will be useful for further interpretation of modeling results.
3.1. Wind and Offshore Wave Data
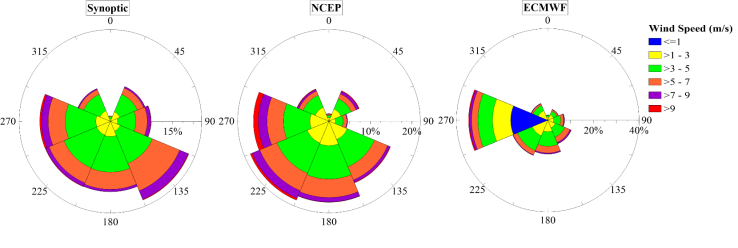
- Three different data sources including wind data measured at Chabahar synoptic station 3-hourly (1987-2010), ECMWF-ERA40 model with spatial and temporal resolutions of 0.5 deg and 6 hours (1992-2002) [15], and NCEP (The National Centers for Environmental Prediction) model (1985-2007) with 3 hours interval [16] were used to examine wind climatology over the study area. Location of Chabahar wind station is shown in Figure 1 (point P4). Wind data from ECMWF-ERA40 and NCEP models were extracted at P1 located about 18 km offshore of Ramin (see Figure 1). Comparisons between the long-term windroses from each of the above-mentioned sources show that wind climate represented by the ECMWF-ERA40 model is significantly different from those of Chabahar station and NCEP (Figure 2). While predominant wind directions for the latter two sources is from west to southeast with the relatively similar frequency of occurrence between west, southwest, south, and southeast, only one predominant direction from west is shown by ECMWF-ERA40 data. Furthermore, the frequency occurrence for wind speeds larger than 5 m/s is underestimated by this model. Data from the Chabahar synoptic station and NCEP model show similar windroses including a broad range of wind directions from southeast to west. Some of the differences between Chabahar windrose and NCEP could be due to the fact that NCEP data were extracted from an offshore location (P1, but Chabahar wind data were measured at a land station farther northwest of P1).
 | Figure 2. Windroses for the study area based on observed and modeled data |
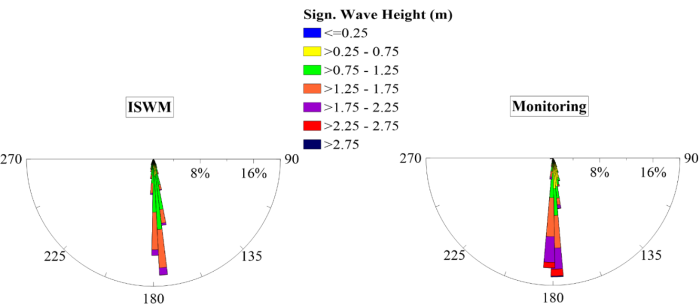
 | Figure 3. Long-term waveroses at location P1 offshore of Ramin Port based on a) Monitoring (1985-2006) and b) ISWM (1992-2002) hindcast wave data |
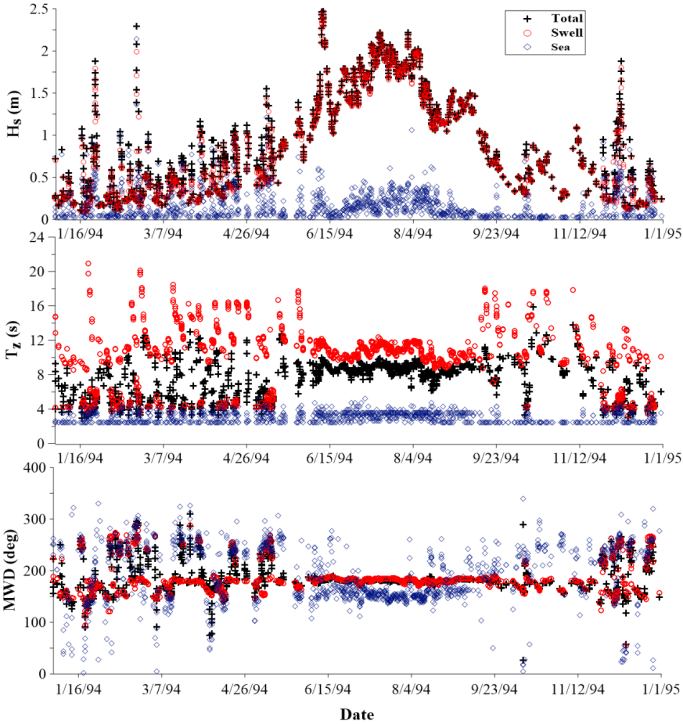 | Figure 4. Variations of significant wave height, peak wave period and mean wave direction at the location P1 in 1994 |
3.2. Numerical Model Specifications
3.2.1. Wave Propagation and Hydrodynamics Models
- The nearshore wave climate across the surf zone of Ramin is determined using Mike 21 Spectral Wave (Mike 21 SW) model developed by the Danish Hydraulic Institute [18]. The model is based on an unstructured mesh and takes into account all main phenomena governing generation and transformation of waves from deep to shallow water. Model solves the energy balance equation over a Cartesian or spherical mesh with triangular elements:
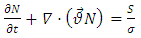 | (1) |
 . This data is required for further simulation of wave-induced currents by Flow module of Mike 21. This model is a comprehensive system based on numerical solution of incompressible and Reynolds averaged shallow water equations by assuming Boussinesq approximation and hydrostatic pressure [19, 20]:Continuity equation:
 | (2) |
 | (3) |
 | (4) |
 is water depth, x and y are horizontal Cartesian axes,
  and
and  are depth average horizontal velocity in x and y directions respectively, f is the Coriolis parameter, g is acceleration due to gravity which is 9.81 m2/s,
  is water level with respect to still water datum,
  is initial water density,
  is time-dependent density,
  is air pressure,
  and
and  are wind stress components at water surface,
  and
and  are bottom friction components, and
  are wave radiation stress components. Model equations are solved for h,
  and
and  on a mesh with triangular elements using a cell-centered finite element method.
3.2.2. Modelling Domain and Computational Mesh
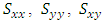
- Water depth over the study site is the main input data in numerical simulations of oceanic phenomenon. A nautical hydrographic chart with a scale of 1:100,000 combined with nearshore field survey data with scale of 1:2000 were employed in order to obtain bathymetry map. The domain for the regional model extends from Ramin coast southward to the latitude almost the same as location P1 for which wave hindcast data from both Monitoring and ISWM databases are available. In the east-west direction, model is extended from the east of Chabahar Bay in the west to the midway between Chabahar and Beris fishery port in the east. The domain for the local model extends 4.2 km along the shoreline and about 2 km across the shoreline and toward the open sea where water depth is about 25 m (Figure 1). Computational mesh for the regional model includes triangular elements with a lower resolution in the offshore area and higher resolution around the study site in Ramin Port (Figure 5a). The unstructured mesh consists of 6766 nodes and 13190 elements with triangle sides varying from 1000 m (along the offshore boundaries) to 80 m (close to shore). Bathymetry data from the above-mentioned sources were interpolated over the generated mesh. The local high-resolution mesh was considered to obtain a finer resolution for a high accuracy simulation of waves and wave-induced currents in the nearshore area. It includes 8296 nodes and 17590 elements and triangle sides vary from 100 m to 20 m (Figure 5b).
 | Figure 5. a) Computational mesh for the regional model, b) Computational mesh and bathymetry for local model comprising Ramin Port and the coastline around the port |
3.2.3. Model Setup and Verification
- The SW module was run based on directionally decoupled formulation and in quasi-stationary mode. This is a numerically optimized mode that is mainly employed for simulating wave propagation from offshore to nearshore and skips wave generation and dissipation terms including wind input, whitecapping dissipation, and quadruplet wave interaction. Model formulation takes into account the effect of bed friction and depth-induced wave breaking inside the surfzone. The source term representing bed friction dissipation is expressed as:
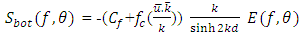 | (5) |
 is mean current speed at the bottom, fc is friction coefficient due to current, k is wave number with the spectral average of
  , E(f,θ) is spectral energy at frequency f and direction θ, and d is water depth. For calculation of bed friction coefficient, Nikuradse roughness coefficient with value of 0.065 m was selected. The rate of energy dissipation due to wave breaking within the surfzone is considered using the relationship presented by Battjes and Janssen [21]:
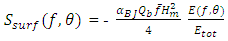 | (6) |
 | (7) |
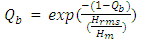 | (8) |
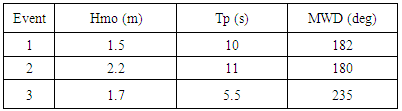
 is average frequency, Qb the portion of breaking waves in the spectrum, γ is the ratio between the wave height and water depth at the breaking point, and Hrms is the root mean square wave height in the spectrum. In the present study the default values of 1 and 0.85 were used for αBJ and γ respectively.For the purpose of the model verification, simulation results from the regional model were compared to the measured wave data at the location of Chabahar buoy (station P2 in Figure 1). Comparison results for wave height, mean zero-crossing period, and mean wave direction showed that the regional model was successful in reproducing the wave conditions at the location of the buoy (Figure 6). This is a demonstration that the approach used for wave transformation from deep water to the coastal area using a directionally decoupled model is appropriate. Detailed analysis of deep water wave information reveals the monsoon waves with characteristics presented in table 1 (events 1 and 2) have the most contributions in the annual waverose over the study area (Figure 3). In addition, storm events occurred occasionally over the Gulf of Oman during the pre and post monsoon can lead to changes in hydrodynamic pattern and beach morphology of Ramin Port (event 3 in table 1). Boundary conditions for the local model (at location P3) were extracted from the regional model and the coupled wave-flow model was run to determine the coastal flow pattern. Radiation stress field obtained from the local wave transformation model is the driving force of the flow model to simulate wave-induced flow in the nearshore area. Formulations by Smagorinsky and Manning were used to represent horizontal eddy viscosity and bed resistance. Default values were used for the constant for Smagorinsky (0.28 m2/s) formulation and Manning coefficient (0.025m1/3/s).
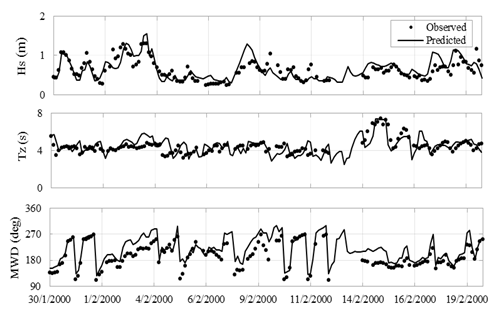 | Figure 6. Comparison between regional model results and measured waves at buoy location (P2) |
|
4. Simulation Results and Discussion
- The model was executed independently for monsoon and non-monsoon seasons. Three distinct offshore wave conditions consistent with the predominant wave conditions during the monsoon and non-monsoon times -as shown in table 1- were selected for the nearshore wave flow simulation. In this table events 1 and 2 are representative of summer monsoon condition, while event 3 with wave direction from the southwest is for considering the wave conditions during pre and post monsoon periods. Model setup for the regional model as evaluated based on observation at Chabahar buoy was used to run the wave transformation model for each wave event.Simulated wave patterns from the local model for Ramin Port and surrounding shorelines along with maps of the currents for each of events 1 to 3 are shown in Figures 7-9. Event 1 includes a long swell wave from 182 deg (south) with a height of 1.5 m and peak period of 10 s. This wave propagated to the port location without any significant change in direction or height. Along the shorelines in the east and west of the port, wave height increased to about 1.8 m due to depth-induced shoaling. Waves broke over this area and quickly approached to height of zero at the shoreline. This relatively long zone of wave shoaling and breaking along the shoreline accounts for the most significant coastal currents formed around the port area. Inside the basin in the right side of the main port basin (we call it minor basin hereafter), wave height decreased almost linearly as a result of depth-induced refraction and almost no depth-induced breaking occurred (Figure 7a). Wave breaking along the shoreline on the east and west of the port, produced relatively strong coastal currents that flowed westward regarding the shoreline orientation and the approaching angle of the incident wave. The average speed of these current was 0.3 m/s. Coastal currents along the eastern shoreline were substantially amplified at the location that shoreline changes direction from southeast-northwest to an almost south-north direction (when entering the minor basin) and reached to about 0.56 m/s (Figure 7b). This is due to small angel between the shoreline orientation and direction the incident wave at this location. Entering the minor basin, coastal currents were divided to two parts, one part continued its longshore paths and finally was dissipated in the east of the minor basin. The other part flowed toward the port entrance presumably a result of currents induced by direct wave attenuation in the minor basin. The return current at the southern tip of the main port breakwater tended to form an eddy at the port entrance. Offshore wave direction corresponding to event 2 was almost the same as event 1 (180 deg). Hence, wave propagation and coastal current patterns resulted from the simulation for this event were very similar to event 1. However, due to larger wave heights and peak period (2.2 m and 11 s, respectively), stronger coastal wave and a wider surfzone were resulted (Figures 8a and 8b). Similar to event 1, westerly coastal currents were produced at both sides of the port and eastern shoreline currents were divided into two parts. Average current speed over the minor basin and at the port entrance were about 0.4 m/s while the current speed at the entrance to the minor basin was 0.65 m/s. Currents affected a larger area inside the minor basin and were more extended toward the main basin in comparison to event 1. Furthermore, return currents at the southern tip of main port breakwater were more extended toward the open sea. Event 3 is corresponding to pre or post monsoon condition with southwesterly (235 deg) direction. In comparison to events 1 and 2, event 3 includes shorter waves with peak period of 5.5 sec. This caused less interaction with bed, and thereby in contrast to southern events, no significant shoaling zone was formed (Figure 9a). However, as a result of depth-induced wave breaking wide surfzones, especially along the shoreline in the west of the port were formed. The general direction of coastal currents under this condition was from west to east with an average speed of 0.25 m/s. At the entrance of the minor port basin, coastal currents changed direction toward north and west and entered the minor port basin as a result of abrupt change in the orientation of the eastern shoreline to almost south-north. This deflecting in coastal currents produced two cyclonic gyres including one at the entrance of the main port basin.Examining patterns of coastal currents produced by these three predominant wave events along the shorelines in the east and west of Ramin as well as inside the port basins, shows that for all cases, even during the non- monsoon southwest event, a part of coastal current ends up inside the minor port basin forming several cyclonic gyres and dissipates almost at the entrance of the main port basin. Wave breaking along the shorelines in the east and west of the port suspends bed sediments that is transported toward the port by relatively strong costal currents. The sediment-rich coastal flow loses its sediment carrying power in the minor basin and especially at the entrance of the main basin as current speed decreases. Consequently, strong sedimentations are expected in the main basin around the entrance and also inside the minor basin. This conclusion drawn based on the pattern of simulated coastal current is consistent with sedimentation and erosion rates obtained from the comparison of historical depth surveys over the port basins. A sample of sedimentation/erosion maps considering bed level changes between November 2000 and June 2009, is presented in Figure 10. This map shows the maximum sedimentation at the entrance of the main port basin and along the minor breakwater. Furthermore, there are smaller sedimentations over the seaside section of the minor basin at locations corresponding to the center of gyres with small current speeds and high potentials for sedimentation.
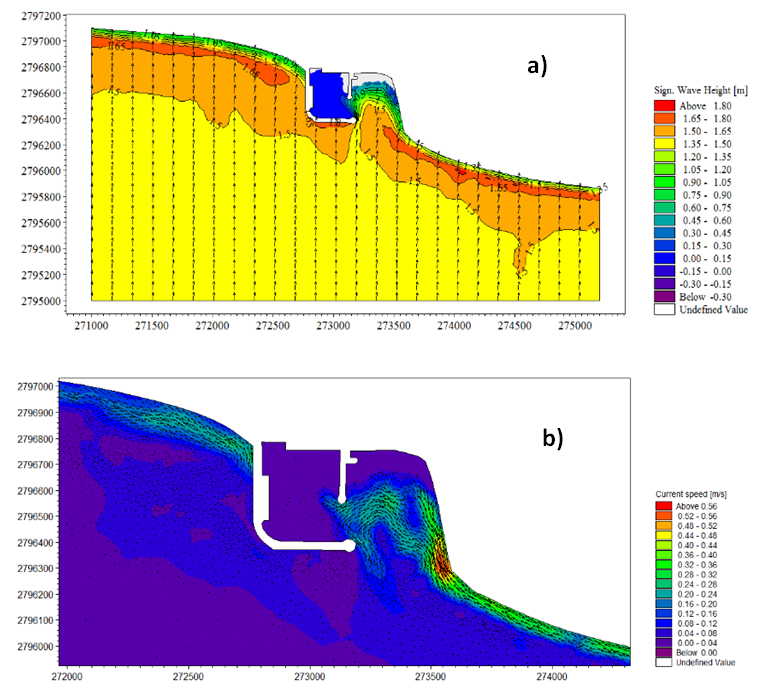 | Figure 7. Simulation results for a) nearshore waves and b) coastal currents for event 1 |
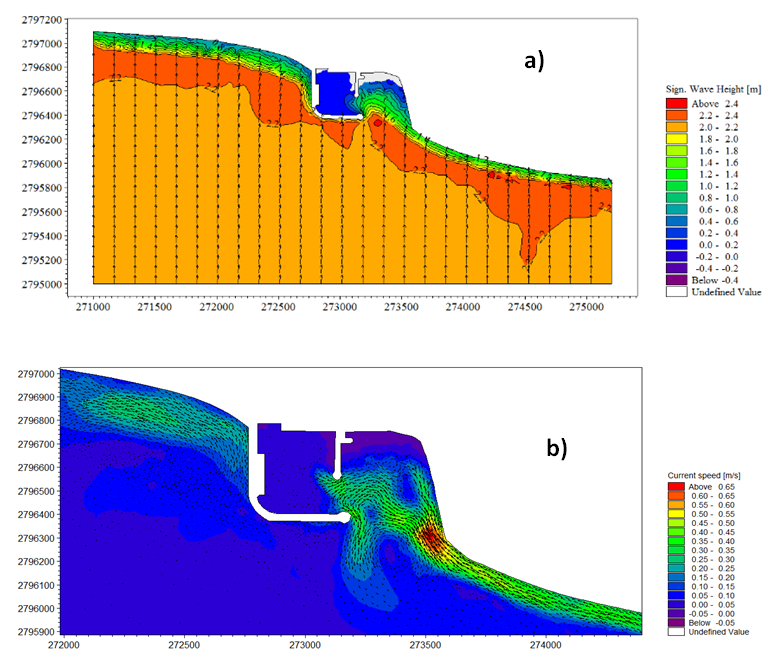 | Figure 8. Simulation results for a) nearshore waves and b) coastal currents for event 2 |
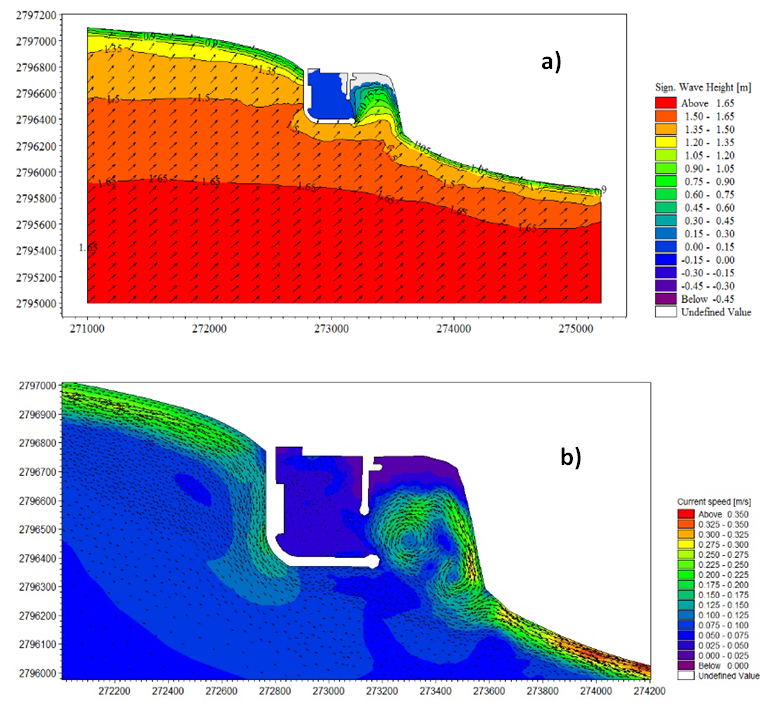 | Figure 9. Simulation results for a) nearshore waves and b) coastal currents for event 3 |
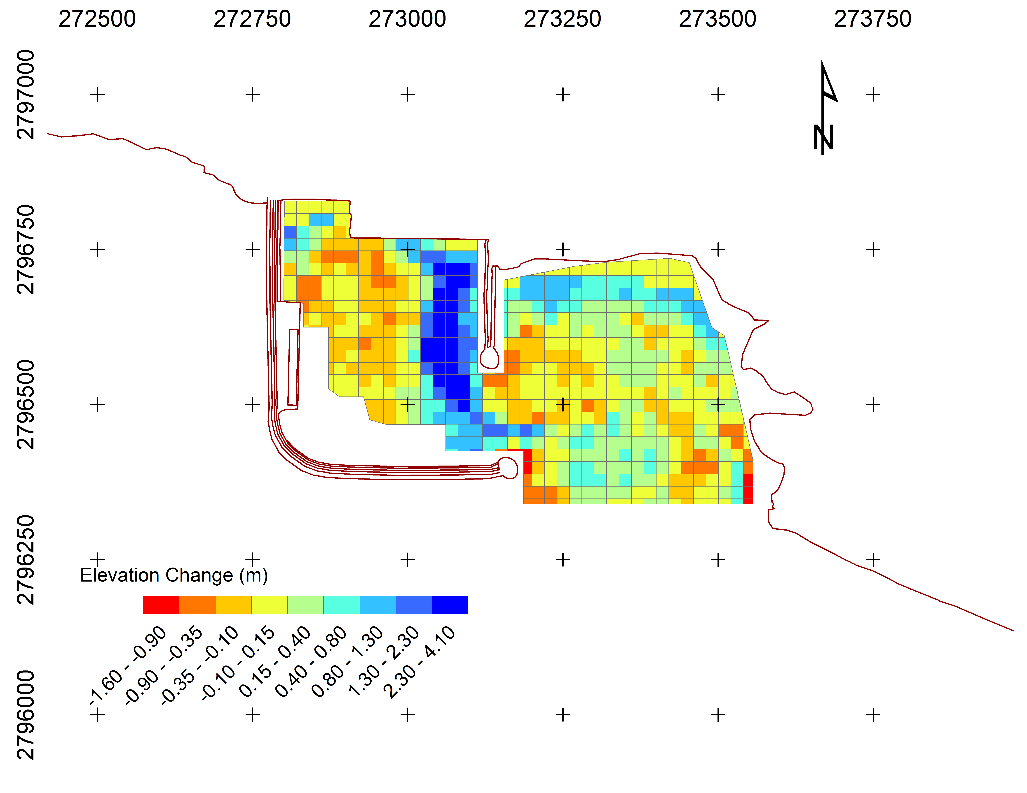 | Figure 10. Bathymetric changes of the Ramin harbor across the area covered by both the surveys of November 2000 and June 2009 (positive values indicate sediment accretion, while negative values depict erosion) |
5. Conclusions
- In this paper, patterns of neasrshore waves and coastal currents induced by waves were investigated in the vicinity of Ramin Port on the northern coast of the Gulf of Oman with the final implication on prescribing the sedimentation problem inside the port basins. The study area is characterized by dominant southerly monsoon waves, especially during summer months. Furthermore, southwesterly non-monsoon waves can be of great importance in terms of their energy and frequency of occurrence. The spectral wave model Mike 21-SW coupled with the flow model HD was used for simulation of waves and currents over the study area. A regional model with a lower spatial resolution was used to determine wave characteristic along the open boundaries of a local model that covers the port area and surrounding shorelines with finer spatial resolutions. Performance of the regional model in the simulation of wave propagation from offshore to nearshore was evaluated using measured wave data by Chabahar buoy. Running the model for three different predominant wave events showed that coastal current flow inside the minor port basin and dissipate at the entrance of the main basin after forming cyclonic gyres. This current pattern, especially locations of gyres and dissipation areas is in a good agreement with the historical sedimentation pattern inside the port basins. This shows that model successfully simulated the pattern of wave-induced currents inside and outside the port. Remedial alternative for reducing sedimentation inside the port basins can be advised according the sedimentation mechanism and pattern confirmed by the present study. Alternatives could include constructing a jetty at the entrance of the minor basin (right at the point that shoreline changes direction). This jetty can disrupt the coastal current and sediment load path from the east under the effect of southern monsoon waves. Since this alternative cannot prevent current and sediment flow generated by southwesterly non-monsoon waves, adding a small jetty at the tip of main port breakwater might be necessary. For these two alternatives and other possible alternatives, an accurate estimation of coastal sediment transport rate along with a simulation of the coastal current pattern after applying each alternative is necessary.