-
Paper Information
- Next Paper
- Previous Paper
- Paper Submission
-
Journal Information
- About This Journal
- Editorial Board
- Current Issue
- Archive
- Author Guidelines
- Contact Us
American Journal of Fluid Dynamics
p-ISSN: 2168-4707 e-ISSN: 2168-4715
2018; 8(1): 19-29
doi:10.5923/j.ajfd.20180801.03

Observed Response to Cyclone Ashobaa Along Coasts of Arabian Sea and Gulf of Oman
 Abstract
 Reference
 Full-Text PDF
 Full-text HTML
Kamran Koohestani1, Mohammad Nabi Allahdadi2, Ulrich Reza Kamalian3
1Civil Engineering Department, Iran University of Science and Technology, Tehran, Iran
2Department of Marine, Earth and Atmospheric Sciences, North Carolina State University, Raleigh, USA
3Civil Engineering Department, University of Qom, Qom, Iran
Correspondence to: Kamran Koohestani, Civil Engineering Department, Iran University of Science and Technology, Tehran, Iran.
| Email: |  |
Copyright © 2018 Scientific & Academic Publishing. All Rights Reserved.
This work is licensed under the Creative Commons Attribution International License (CC BY).
http://creativecommons.org/licenses/by/4.0/

Ocean response to cyclones has been evaluated in number of locations in the world. Low frequency oscillations are common phenomena in such conditions as reported in different studies. Another response to the cyclones in specific conditions is Kelvin-type coastal surge. In the present paper, it is aimed to evaluate oceanic response to cyclone Ashobaa, occurred in the northern Arabian Sea in June 2015 using field data analysis. Various data sets were used. The investigation was performed for water depths of 10, 25, 40 m which is unprecedented for the area. Sub-inertial oscillations in current direction, current speed, water temperature, and surface elevation were detected in Makran region along the Iranian coasts of the Gulf of Oman. Moreover, analysis of surface elevation along the coasts of Arabian Sea and Gulf of Oman revealed a Kelvin-type surge, moving with speed of 3 to 4 m/s and primary amplitude of 0.4 m in Karachi.
Keywords: Low Frequency oscillation, Cyclone Ashobaa, Wavelet Analysis, Kelvin-type surge, Makran coasts
Cite this paper: Kamran Koohestani, Mohammad Nabi Allahdadi, Ulrich Reza Kamalian, Observed Response to Cyclone Ashobaa Along Coasts of Arabian Sea and Gulf of Oman, American Journal of Fluid Dynamics, Vol. 8 No. 1, 2018, pp. 19-29. doi: 10.5923/j.ajfd.20180801.03.
Article Outline
1. Introduction
- Tropical cyclones over the Arabian Sea usually occur at the end of spring and during summer. These cyclones start almost near latitude 10˚N and seldom arrive to the Gulf of Oman. Gonu is the most powerful cyclone has ever reached to this region (Allahdadi et al. [7]. Cyclone Ashobaa was another cyclone moved toward the Gulf of Oman. However, no landfall occurred and the cyclone dissipated in the northern Arabian Sea before a specific recorded landfall.Extreme meteorological conditions such as cyclones apply gigantic energy to the water body and may cause various hydrodynamic responses. Due to the specific time scales of wind field oscillates, cyclones are a powerful source of low frequency oscillations in the ocean. Owing to long period of the response- usually longer than local inertial period- the oscillations commonly remain in the wake of cyclones. This fact has been proved by different studies for a number of storms. Such oscillations are of importance not only in the regions directly affected by the cyclone, but also in relatively remote areas due to transform of the energy and momentum and even heat thorough the low frequency waves triggered by the cyclone. Oceanic response to some cyclones, such as Allen, Fredric and Gilbert, were formerly investigated and low frequency oscillations were detected during and in the wake of these storms [1-3]. In recent years, Teague et al. [4] investigated the effect of continental slope and outer shelf in response to hurricane Ivan. They detected sub-inertial and near-inertial oscillations in hydrodynamic data. [4] In terms of Indian Ocean, Wang et al. [5] analysed the data from moored observation system of the Indian Ocean located in deep water in order to study the response to tropical cyclone Gonu; the most powerful recorded cyclone has ever reached to the Gulf of Oman. They reported sub-inertial and near-inertial oscillations in the depths ranging from 66 to 3000 m during and after the cyclone.Effects of cyclone can be tracked not only across the water depth, but also at the surface of the ocean where the water body directly interacts with the storm. Fandry et al. [14] introduced Kelvin-type coastal surge as a response to the cyclones under specific conditions. This kind of surge is triggered when alongshore component of wind stress of cyclones is in the same direction as the Kelvin wave propagation. In the northern hemisphere Kelvin waves propagate along the coastline from left to right whn facing the sea, while in the southern hemisphere the direction of propagation is from right to left, Thus, it depends on the location of the coastline on the earth- Northern or Southern hemisphere-and the orientation of the coastline. The longshore component of wind stress during cyclones rotating counter clockwise in the region along with the orientation of coastlines on the northern Gulf of Oman and western Arabian Sea are in favour of producing and propagation of Kelvin waves. Such phenomenon can transform the energy of the cyclone to the regions that were not directly affected by the cyclone. Existence of this kind of surge in the Northern Indian Ocean triggered by a Cyclone E1 in 2011 is mentioned by Mehra et al. [6] They detected a surge, propagating along the Arabian Sea coastlines with speed of ∼ 6.5 ms-1 and peak amplitude of 0.35 m. This surge is of a great importance in estimation of total local surge during and in the wake of storms. [6]In the present, paper it is aimed to investigate hydrodynamic response of Makran coasts along the Iranian coasts of the Gulf of Oman to cyclone Ashobaa using field data analysis. The paper has two parts. First, low frequency oscillations of the physical and hydrodynamic components are investigated. Wavelet analysis is employed to analyse the field data observed by Iranian Ports and Maritime Organization. Depths of investigations are far shallower than former studies, ranging from 10 to 30 meters. In the second part, sea level variations were analysed along the eastern and northern coasts of Arabian Sea to study Kelvin-type coastal surge and cyclone-induced water level oscillations in the region.
2. Cyclone Ashobaa
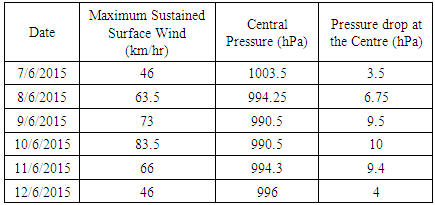
- Tropical cyclone Ashobaa was formed on 7 June 2015 in the Arabian Sea off the west coast of India and traveled northwestward toward the Sea of Oman (Figure 1). The average forward speed of Ashobaa was almost 4m/s (15 km/hr). It reached the maximum intensity on 10 June. Table 1 illustrates daily average cyclone characteristics. Ashobaa weakened into a deep depression in the night of 11 June and into a depression in the morning of 12 June. Eventually it degraded into a well-marked low pressure area over northwest of the Arabian Sea and adjoining Oman coast in the evening of 12 June. [13]
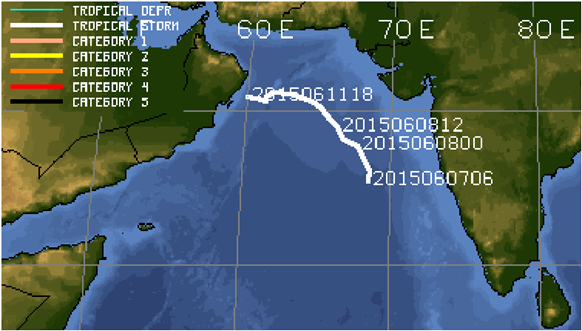 | Figure 1. Track of Ashobaa [12] |
|
3. Data
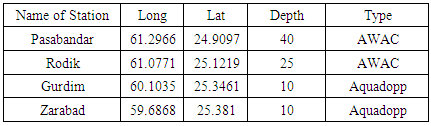
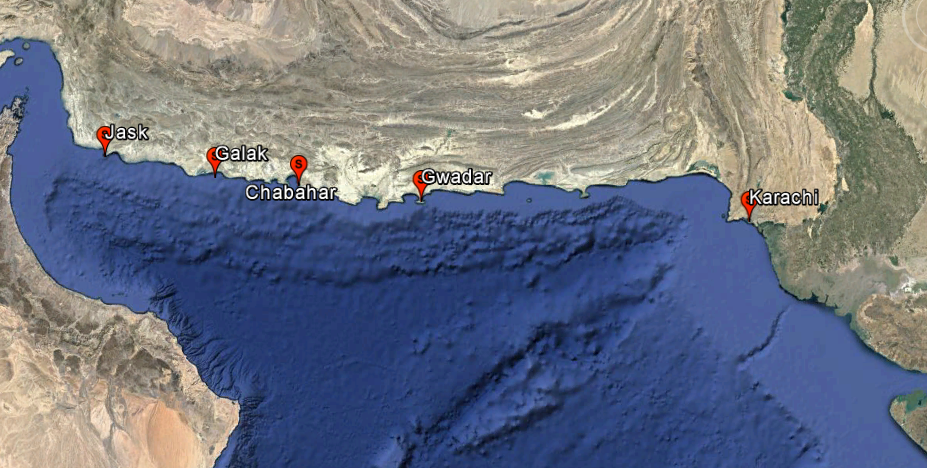
- A major part of the data was observed in the 6th phase of the Monitoring and Modeling of Iranian coasts implemented by Iranian Ports and Maritime Organization [9]. Pasabandar, Rudik, Zarabad, and Gurdim with water depths of 40, 25, 10, and 10 m respectively were selected for studying cyclone- generated oscillations (see Figure 2 for locations). ADCP and Aquadopp were the instruments used to collect the data (Table 2). Water level data from IOC sea level station monitoring facility (www.ioc-sealevelmonitoring.org) was also used for further investigation.
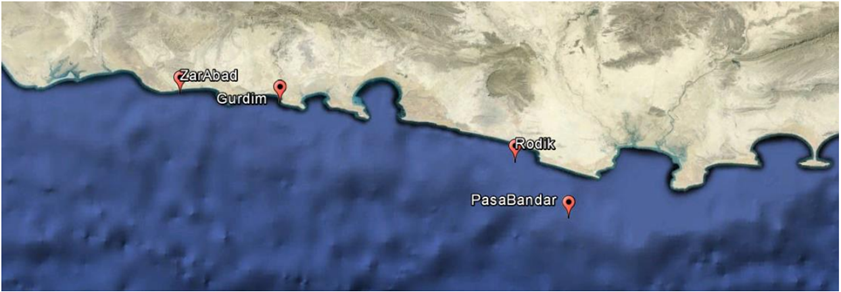 | Figure 2. Locations of Stations along the northern coast of the Gulf of Oman to study sub-inertial oscillations using WAVELET analysis |
|
4. Results and Discussion
- In order to analyze the data, Wavelet analysis was employed and executed by MATLAB code. [8] Three different depths were chosen for comparison. In order to achieve long term data, the data of Zarabad and Gurdim were combined. It was conducted by assuming that period of oscillations for these two locations are approximately the same. This is a reasonable assumption because the distance between Zarabad and Gurdim is small compared to the spatial scale of valuation. The results for Wavelet analysis at each station are presented below.
4.1. Pasabandar
- The total water depth at this station is 40 m. To avoid inaccuracies associated with surface disturbances, data from 7m depth was extracted for analysis. During the cyclone, a current direction several days was almost the same, while current velocity reached to up to 1.1 m/s. Observation started on 6 June and ended on 17 September [103 days]. Figure 3 depicts the results of analysis for current direction and speed.
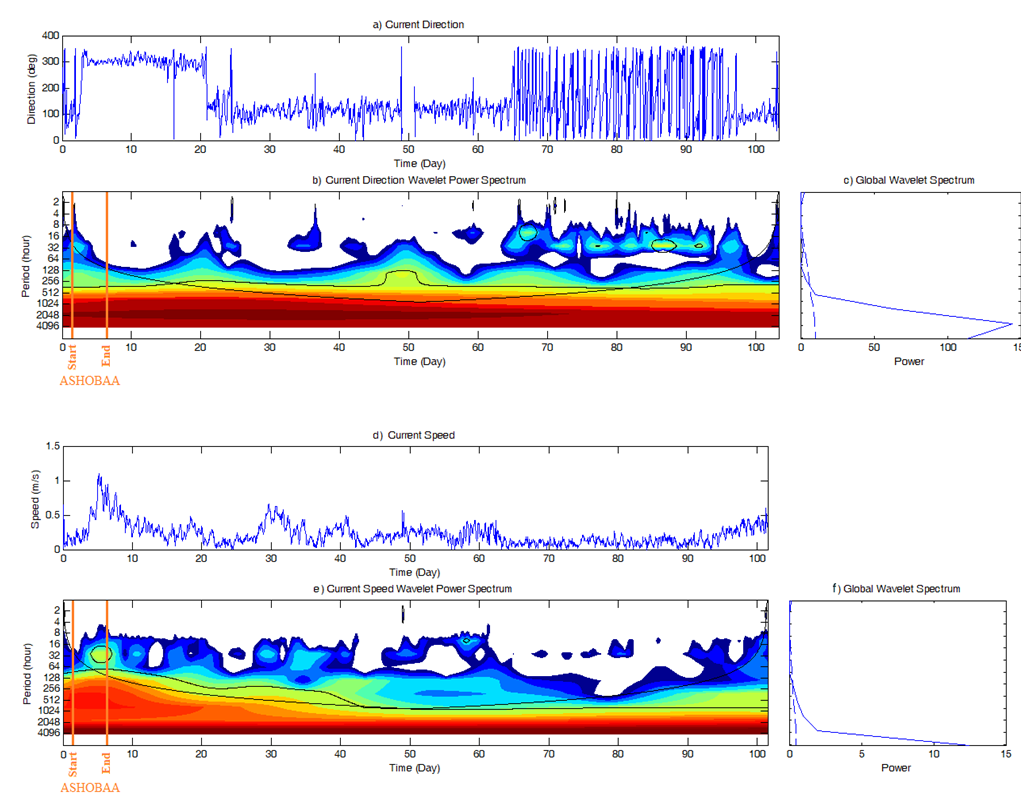 | Figure 3. Results of Wavelet analysis for Pasabandar: (a,b,c) Current direction, (d,e,f) Current speed |
4.2. Rodik
- Rodik station is located in 25 m depth off the Iranian coast of the Gulf of Oman. Data at the 10m depth was selected for analysis. The data covered the time between 9 May and 30 December 2015 (235 days) except for current direction that ended on 15 November (190 days). Figure 4 illustrates the results of Wavelet analysis of data of this station. Water temperature and surface elevation are also evaluated along with current speed and direction. Similar to Pasabandar the persistent period of 2048 hours was detected from current direction analysis (Figure 4b). This period is out of cone of uncertainty due to the fact that observation period was not long enough prior to cyclone. Thus, it can be concluded that it is not caused by Ashobaa. Two other periods were also detected at the start of Ashobaa including periods higher than 512 hours that remains for 5 weeks and a period of 128 hours that remains for one week, attenuates, and surges again. Resurgence of this oscillation is likely owing to another storm, occurred at the end of June. According to the starting time of oscillations, 128 and 512 hours can be ascribed to Ashobaa.
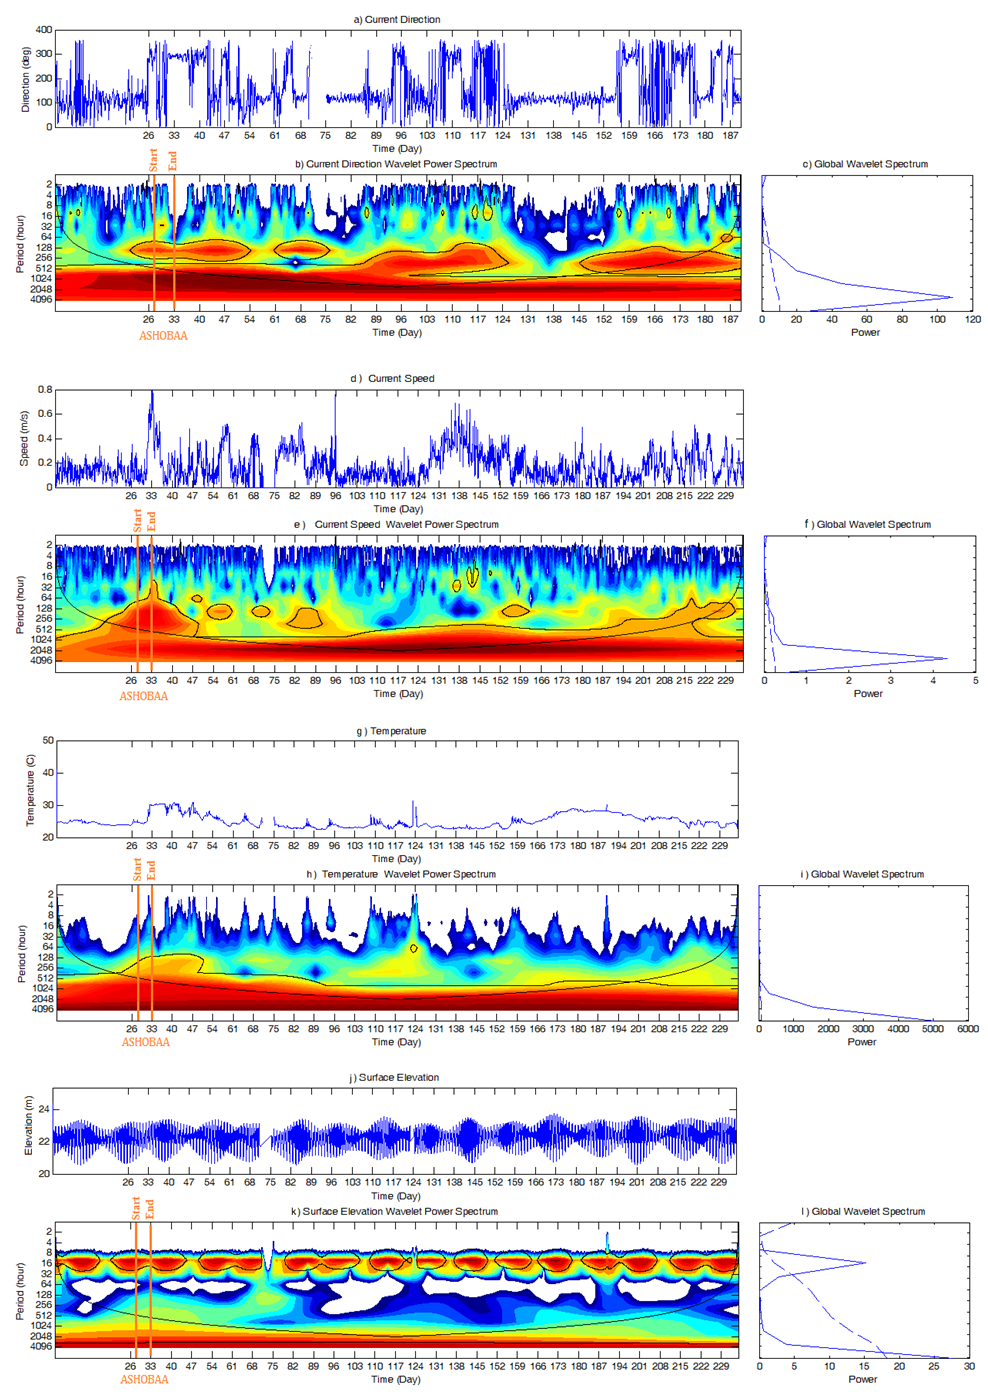 | Figure 4. Results of Wavelet analysis for Rodik: (a,b,c) Current direction, (d,e,f) Current speed, (g,h,i) Water temperature and (j,k,l) surface elevation |
4.3. Gurdim and Zarabad
- The shallowest stations in the current analysis are Gurdim and Zarabad that are located in 10m depth. The data of this depth was collected by Aquadopp. Observation started on 11 May and ended on 10 November (180 days). Data of 4m depth was chosen for analysis. Figure 5 depicts the results of Wavelet analysis of the data for these two station. As mentioned before, to achieve a longer data records, data from these two stations were combined together.The Wavelet analysis results for current direction (Figure 5b) show a energy amplification in the spectrum just after June 7th in a period between 512 and 1024 hours. These predominant periods can be also detected in the results of current speed and water temperature (Figure 5e and 5h). Although 128 hours is also detected in current direction analysis, in the current speed and temperature spectrum there is an extension to the period of 256 hours just before start of Ashobaa. This period may be caused by atmospheric disturbances prior to creation of cyclone.
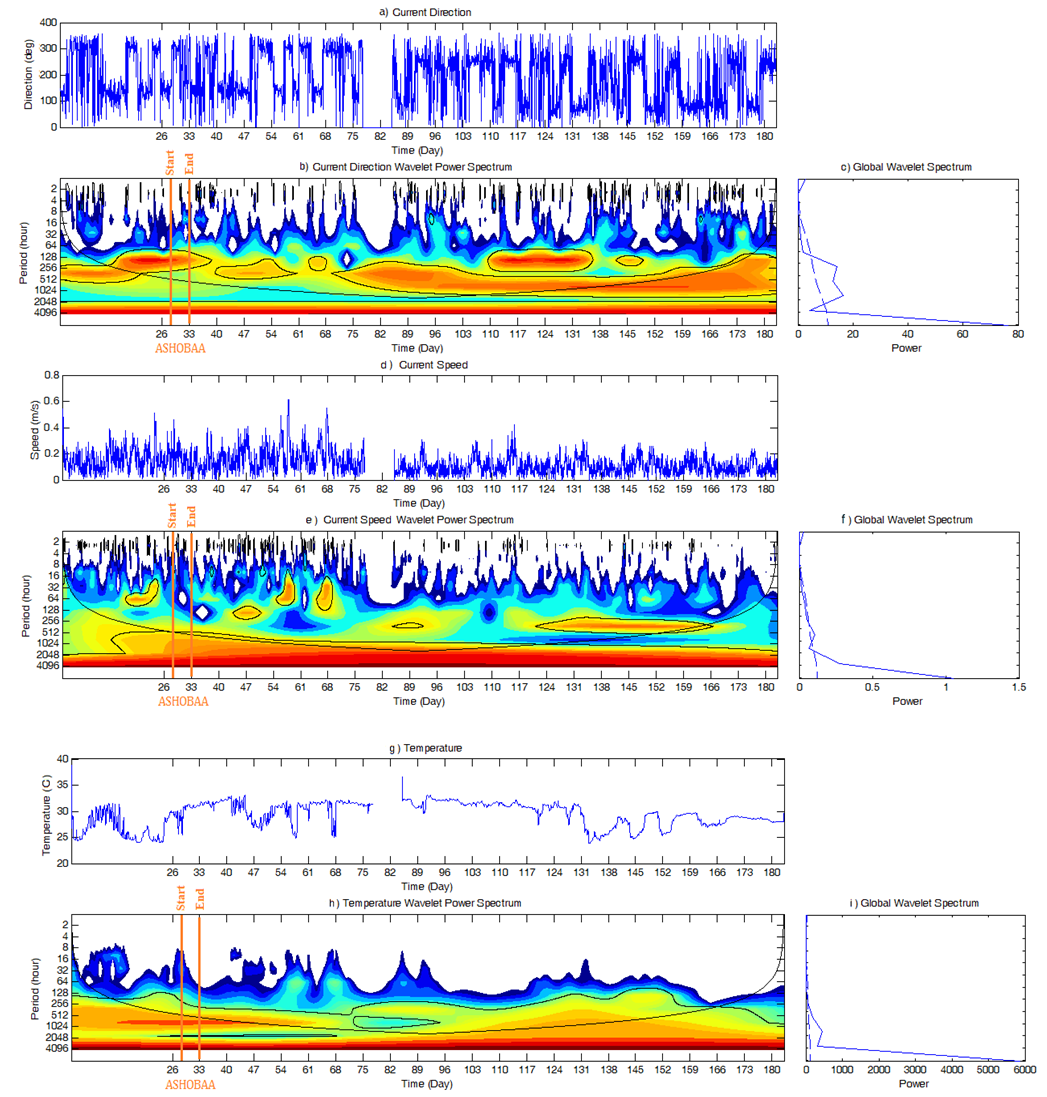 | Figure 5. Results of Wavelet analysis for Gurdim and Zarabad: (a,b,c) Current direction, (d,e,f) Current speed, (g,h,i) Water temperatureFor current speed, two bands of energy amplification are detected in 128 and 256 hours (Figure 4e), while temperature data shows two significant periods including 128 hours and a period between 512 and 1024 hours. These periods are compatible with current direction outputs. The results of surface elevation analysis are the same as temperature. |
4.4. Response of Sea Level to Ashobaa along the Coasts of Gulf of Oman and Arabian Sea
- In this part surface elevation is analyzed in 5 stations along the coasts of Arabian Sea and Gulf of Oman to study the propagation of the surge generated in the wake of the cyclone storm along the shoreline. The data were obtained from 4 stations supported by Intergovernmental Oceanographic Commission (IOC) in Karachi, Gwadar, Chabahar and Jask. Also, Galak which is one of the stations from Makran monitoring program is added to the data. Figure 6 shows the location of water level stations. Surface elevation (Figure 7) is affected by various phenomena with various frequencies, from well-known diurnal tide to low frequency atmospheric events. Tidal harmonic analysis is performed on surface elevation in order to separate high and low frequency oscillations. By eliminating diurnal and semi-diurnal oscillations, sea level residual (SLR) is determined. Thus, SLR shows sea level variations with periods higher than ~25 hours i.e. surges. Figure 8 depicts the SLR in 5 studied stations. Figure 9 also illustrates daily average of wind speed during June 2015 in Karachi, Chabahar and Jask. Since there were no specific wind data was available for other locations, maps of surface wind stress pre used over the Arabian Sea to illustrate wind variations during Ashobaa. Figure 10 shows wind stress over the Arabian Sea between 7 June and 12 June. [11]In Karachi, SLR starts rising from 7 June and reaches to a peak with ~0.4 m height on 10 June. According to the wind speed in Karachi, in this period the wind speed is between 4 to 6 m/s in average. In Gwadar, SLR increases from 9 June and the maximum water level of 0.3 m occurs on 11 June. No wind data is available for this location but according to the figure 10 wind stress is not noticeable. Surge starts from 10 June in Chabahar and reaches to the maximum of 0.3 m on 12 June. For this period, daily average of wind speed is 5 m/s. In Galak, SLR rises from 10 June and the peak of 0.4 m occurs on 13 June. Finally, the surge, in Jask, starts on 11 June and reaches to 0.15 m on 14 June. Daily average of wind speed oscillates between 3 and ~5 m/s. According to the wind speed and stress data, there is no strong forcing to generate a 0.4 m surge along the coasts of Arabian Sea, while it is observed in SLR. This could be due to the surge propagation along the western coasts of India as a result of Ashooba winds during the first days of formation.
 | Figure 6. Location of the stations for analysis of surface elevation |
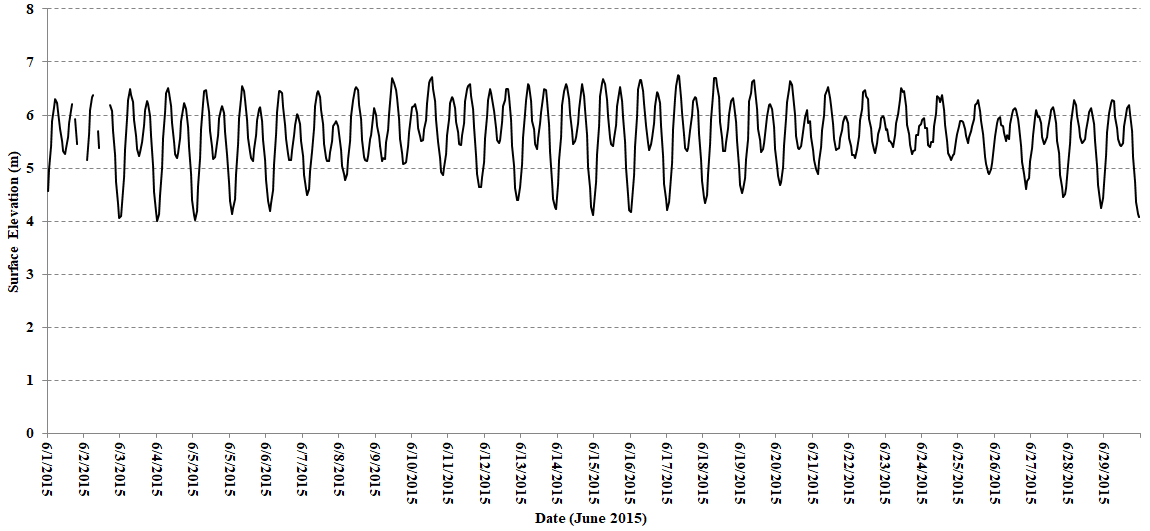 | Figure 7. Surface elevation in Gwadar station |
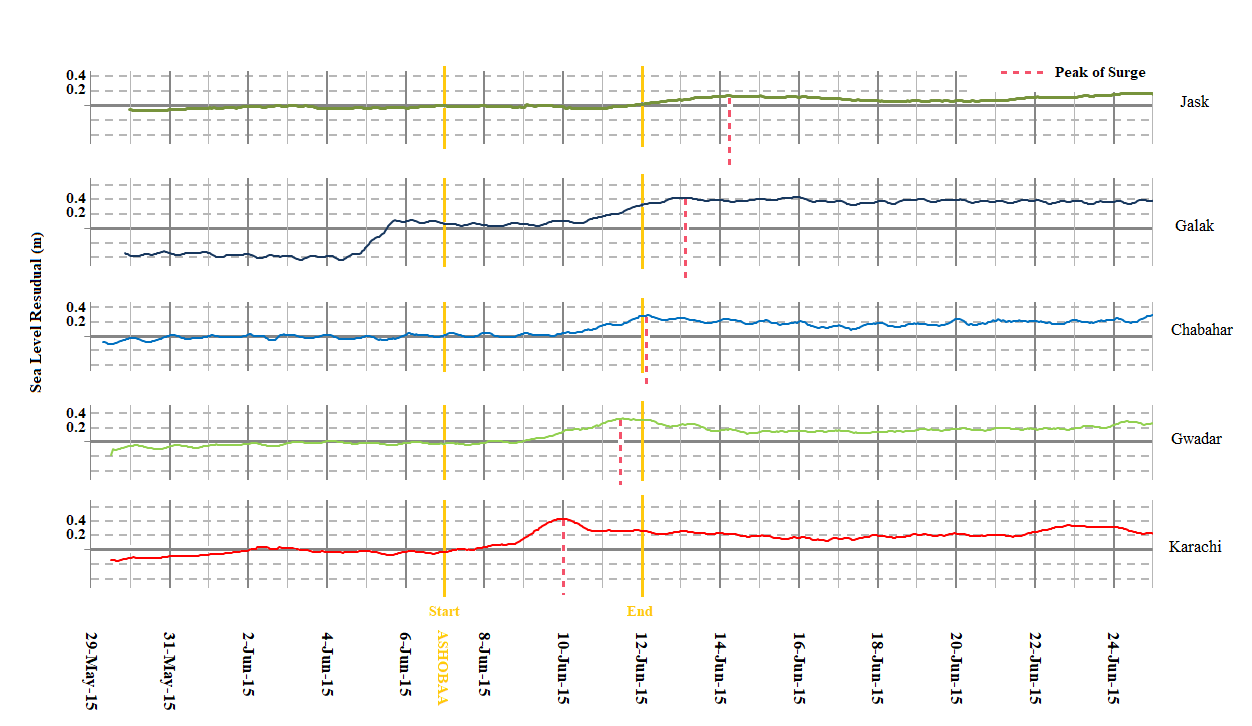 | Figure 8. Sea Level Residual of the stations: Karachi, Gwadar, Chabahar, Galak and Jask |
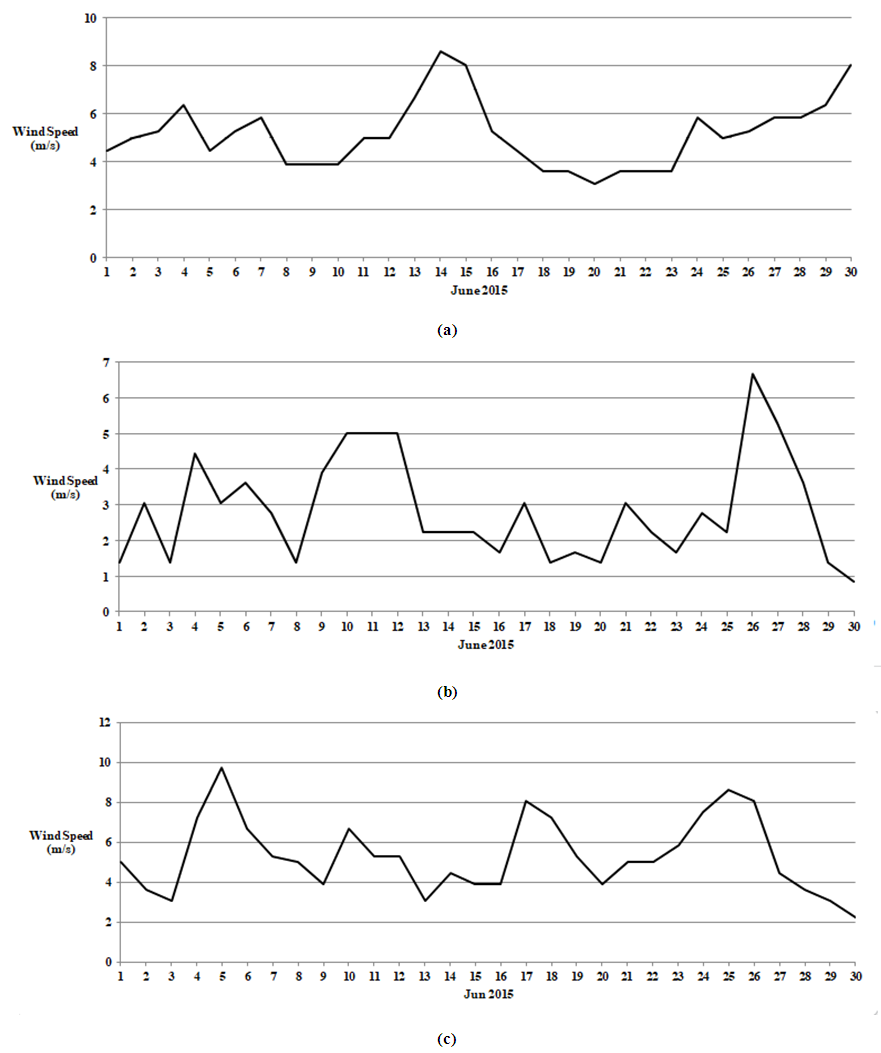 | Figure 9. Daily-averaged wind speed: (a) Karachi (b) Chabahar (c) Jask in June 2015 |
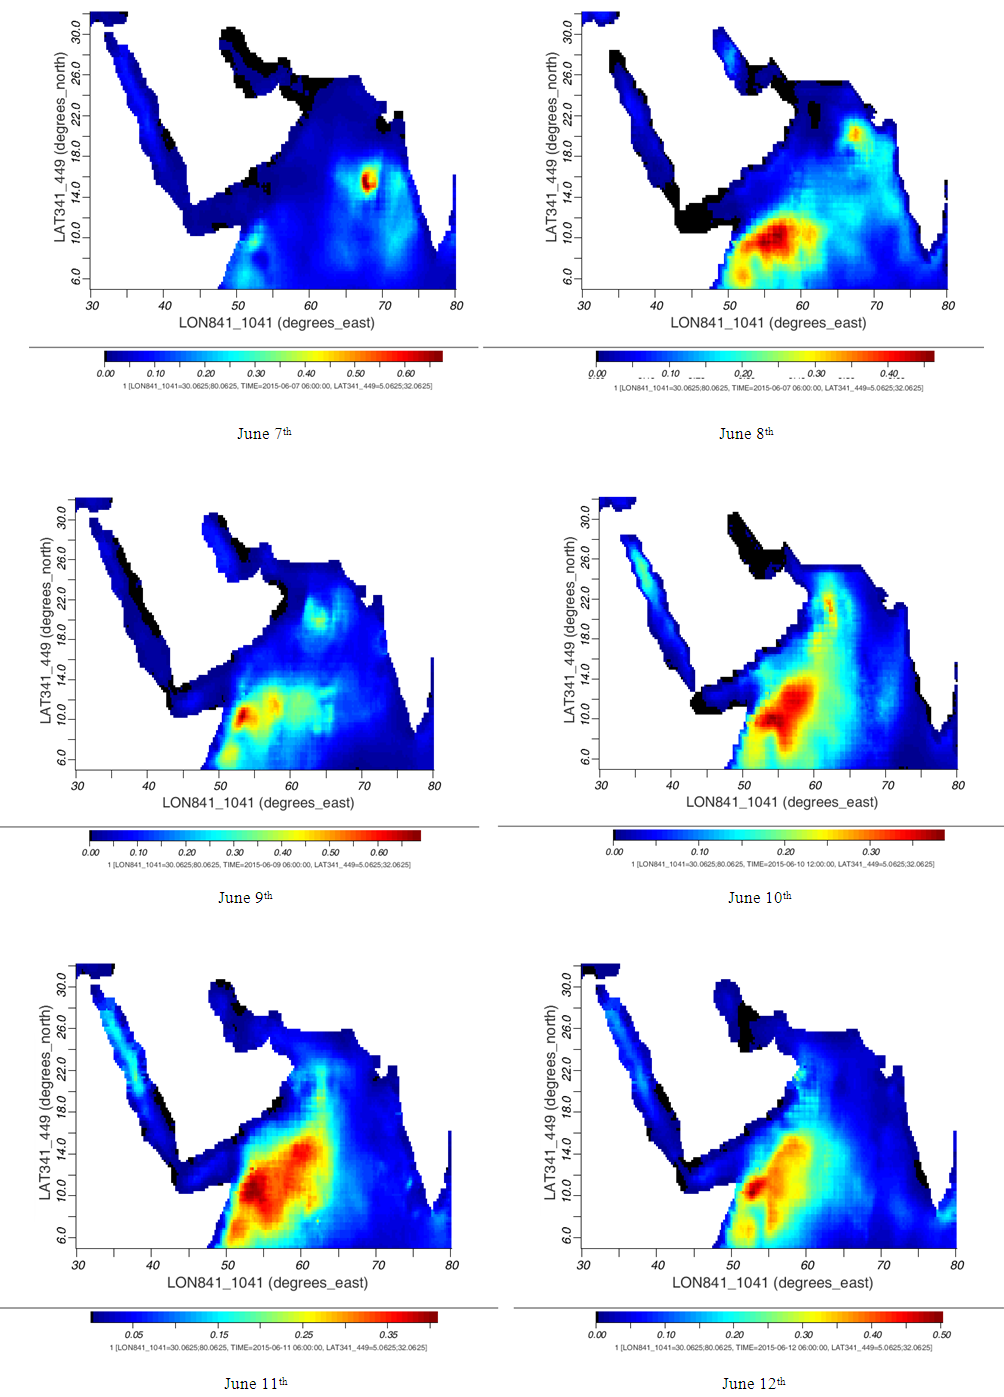 | Figure 10. Wind Stress over the Arabian Sea between June 7th and 12th |
4.4.1. Kelvin-Type Surge
- Fandry at a l [14] introduced Kelvin-type surge based on observations of several cyclones in western coasts of Australia. [14] They theorized a surge triggered by cyclone and moving in Kelvin wave direction and characterized the response to a cyclone.In the current case, as Ashobaa moves along western and northern coasts of the Arabian Sea, a peak is observed in the resulted SLR timseries with primary amplitude of 0.4 m moving in speed of 3-4 m/s. In Karachi, the surge height is ~0.4 m and the period is ~2 days. By moving along the coasts of the Arabian Sea, the amplitude decreases and reaches to 0.3 m in Gwadar and lasts ~5 days. The amplitude in Chabahar is almost the same as Gwadar but the period reaches to 7 days. The surge intensifies again in Galak and reaches to 0.35 m. The surge peak in Chabahar and Galak occur on 12 and 13 June respectively. Since Ashobaa ends on 12 June in the south of Gulf of Oman, the observed surge in these later two stations may partially be caused by the long waves of generated by low atmospheric pressure fields as well as the storm surge generated by the cyclone and propagated toward these two stations. Moreover, drop of the surge height in Gwadar and subsequent stations may be caused by reduction in shelf width that remarkably narrows along the northern shelf compared to the eastern shelf of the Arabian Sea. The arrival time of the surge peak to Rodik (9 June) is consistent with the surge speed and the distance between Gwadar and Rodik (~130 km). This peak of surge coincides with a major change in current direction and occurrence of a strong persistent current with uniform direction as recorded in Rodik. (Figure 11) This current starts on ~9 June and lasts until ~16 June. The duration of this persistent current is compatible well with the period of the surge in the location. In other words, such a surge can remarkably change the current field in the coasts along the Arabian Sea and Gulf of Oman. Regarding the magnitude of the current, it can be of great importance for other predictions i.e. sediment transport.
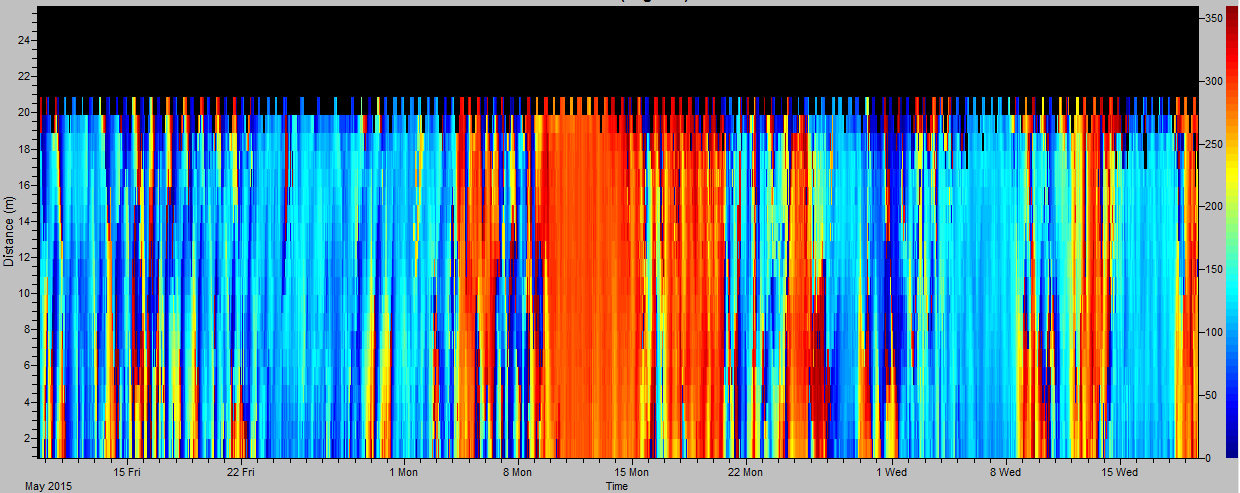 | Figure 11. Current profile in Rodik during May, June and July 2015 |
5. Conclusions
- Oceanic responses to cyclone Ashobaa were investigated in Arabian Sea and Gulf of Oman in different water depths from 10 to 40 m. Low frequency oscillations were detected during and in the wake of Ashobaa using Wavelet analysis. At water depth of 40m, two periods of energy amplification were detected including 512 and ~800 hours. In Rodik station with depth of 25 m, two periods were detected during Ashobaa which were ~512 hours and 128 hours. Detected dominant periods for current direction, water temperature and surface elevation were higher than 512 hours and for current speed it was ~256. In such a condition the period, resulted from speed analysis since current speed is more sensitive to local variations induced by low frequency waves. In the shallowest investigated depth (10 m), the only reliable detected period was between 512 and 1024 hours.To study low frequency surface elevations during Ashobaa, data from 5 stations along the coasts of Arabian Sea and Gulf of Oman were studied. A Kelvin-type surge triggered by Ashobaa moving along the coastline was detected. The primary amplitude and period of the surge were 0.4 m and ~2 days, respectively. By moving over the shelf, the surge peak decreased to 0.3 m in Chabahar but the period increased to ~7days. Finally in Jask the surge height was 0.15 m and the period was ~7.5 days. The surge not only altered surface elevation, but also affected current field in Makran coasts. A remarkable current with almost constant direction and the speed up to 1 m/s was observed in all stations of Makran. The duration of persistent current at the time of rising and diminishing, for each station was consistent with the surge.