Shubham Agarwal1, Priyank Kumar2
1Department of Mechanical Engineering, Birla Institute of Technology, Ranchi, India
2Space Engineering and Rocketry Department, Birla Institute of Technology, Ranchi, India
Correspondence to: Shubham Agarwal, Department of Mechanical Engineering, Birla Institute of Technology, Ranchi, India.
| Email: |  |
Copyright © 2016 Scientific & Academic Publishing. All Rights Reserved.
This work is licensed under the Creative Commons Attribution International License (CC BY).
http://creativecommons.org/licenses/by/4.0/

Abstract
The research involves a three-dimensional numerical investigation to analyze the effect of vortex generator installation on the lift enhancement from a wing. Study of flow field is done over NACA4412 wing with VG attached at different locations and at various angles of attacks at Re=105. It is found that at small angles of attack of the wing, the VG has insignificant effects with a small decrease in lift and a small increase in wing’s drag. However at larger angles of attack the lift increases and drag decreases significantly. With the change in the position of VG over the airfoil the effects are varied. The VG location for maximum performance enhancement changes with change in angle of attack. The optimum VG location moves upstream on the airfoil as the angle of attack increases. The numerical methodology gives insight into the flow separation control achieved and explains elaborately the mechanism behind flow separation control. The paper gives a better understanding of VG positioning for enhanced flow separation control.
Keywords:
Flow separation control, Vortex generator, VG location, Lift enhancement, Shift of separation point
Cite this paper: Shubham Agarwal, Priyank Kumar, Numerical Investigation of Flow Field and Effect of Varying Vortex Generator Location on Wing Performance, American Journal of Fluid Dynamics, Vol. 6 No. 1, 2016, pp. 11-19. doi: 10.5923/j.ajfd.20160601.02.
1. Introduction
The performance of wing is restricted at high angles of attack (AOA) due to flow separation on upper surface of the wings. This happens when the flow on the upper surface of the airfoil is not able to work against an adverse pressure gradient that develops at high angles of attack [1]. Thus the flow separates from the surface. The airfoil thus stalls and is not able to generate more lift. In practical applications the wings have to operate at high angles of attack during landing, take-off and manoeuvres. To optimize wing performance under such situations flow separation control techniques are used. Many passive devices are used for this purpose which delay stall by mixing boundary layer flow with far flow regime [2] or by generating streamwise vorticity [3]. The location of these passive devices is an important parameter to optimize their performance effects and to delay the stall.VGs are vanes on the suction side of the airfoil which prevent flow separation at high angles of attack by fostering momentum transfer from high-energy flow in free-stream away from airfoil to the fluid layer near the airfoil surface susceptible to separation. The concept of VG was first introduced by Taylor in 1947 [4]. A row of small plates was used to delay flow separation in a diffuser. It was found that the primary reason for this delay was the generation of streamwise trailing vortices which increased transfer of momentum in streamwise fluid direction. Schubaeur and Spangenberg [5] in their study analyzed the characteristics of the turbulent boundary developed over a flat plate at various adverse pressure gradients. They reported that the reason for flow separation delay in turbulent boundary layer was the enhanced fluid mixing in this thin region induced by the VGs. Various shapes of vortex generators have been experimented and put to successful use [6, 7]. The lift coefficient comparison has also been investigated for various shapes of the VG on NACA-4415 airfoil in the study by T.K. Zhen-et-al [8].The VGs are now being used not only on wings but also on sedan’s and race car wings where they enhance the flow characteristics by delaying flow separation in sedans [9] and increasing the downforce in race cars [10, 11]. The passive VGs are much cheaper and easier to employ as compared to active VGs and produce considerably good results. Even in sports, VGs are used for flow separation control such as use of bump shaped VGs in golf balls [12, 13]. In most recent scenarios Rao et al. 2010 deployed vortex generators on a wind turbine rotor blade and investigated the effects of this VG installation on rotor blade performance [14]. By delaying separation the VGs increase the operational regime of the aircrafts as reported by Gad-el-Hak et al [15]. Siauw et al. [16] elaborately explained the physics of flow separation over a NACA0015 airfoil. Lin et al. [17] investigated the effect of installation of passive vortex generators on wings in turbulent flow regime. The VGs were able to enhance the operational characteristics of wings at higher angles of attack. Bragg and Gregorek [18] performed experiments on an airfoil from the wing of Vovager aircraft with vortex generators which showed an increase in wing’s lift when VGs were put to use. Aerodynamic loses are found to be reduced by use of such devices. Lengani et al. [19] investigated effect of low-profile vortex generators in turbulent layer separation control and stated that momentum transfer by VGs suppresses flow separation. Lin J.C. [20] presented a review of use of low-profile vortex generators for boundary layer separation control and stated that the stream wise vortices generated by these vortex generators prevent flow separation.The objective of the current study is to study the effect of change in location of vortex generators on a NACA4412 airfoil for a wide range of angle of attacks and to study how the change in VG location over the surface of the airfoil affects the various aerodynamic parameters like lift and drag. In this context the numerical analysis is used and also the detailed discussion of the flow physics in details helps us to have a better understanding of the mechanisms responsible for the observed changes in wing’s performance VG installation. NACA4412 is employed at large at present in various applications such as in micro-air-vehicles and other applications and thus a detailed research is going on with this airfoil type. This study is novel in the aspect that it presents detailed analysis of effect of changing VG location over a NCA4412 wing and also gives deep insight into the physics of the flow responsible for notified changes in the flow field variables. This study defines the optimum location of VGs for different angles of attacks on a NACA 4412 wing which is not present in any existing literature.
2. Mathematical Formulation
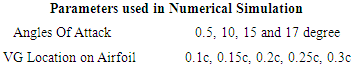
NACA4412 is used as the airfoil and the data points were used to model it on Gambit. The parameter used in our computation is shown in Table 1. Fig. 1 shows the geometry and the dimensions of the VG on the airfoil as used in our analysis. In the above figure the VG is located at 0.1c from the leading edge of the airfoil. In the other subsequent cases the VG location varies from 0.1c to 0.3c. The VG has a chord length of 0.01675c and is inclined at an angle of 30degrees from airfoil surface for our current analysis. Fig. 2(a) shows the schematic of the computational domain used in our simulations. It also shows how a dense meshing near the wing with coarser meshing far away from the wing surface is used for numerical analysis. In the upstream direction the computational domain extends by 6.5c from the airfoil’s leading edge and in the downstream direction it extends by 10c from airfoil’s trailing edge. The boundaries of the domain are extended by 7.5c above and below the airfoil.The whole computational region is discritized with structured mesh as shown in Fig. 2(b). Gambit 2.4.6 software is used for mesh generation here. The mesh is much dense near the VG to accurately capture the effects of vortex generator. The computational domain after meshing has a total 350768 control volumes for the case when VG is located at 0.1c on airfoil, which is achieved after a grid-independence study. Four different grids were used with 0.2 million, 0.3 million, 0.35 million and 0.42million cells respectively for mesh independence study. The deviation in the lift coefficient in the last two grids was within 2% and hence the final grid size was selected with 0.35 million cells. The number of cells however varies a little as the position of the VG is changed over the airfoil surface. The upstream boundary as well as the top and bottom boundaries is modelled as velocity inlets and the sides are modelled by giving them symmetry boundary condition. The wing section spreads throughout the computational domain as shown in the figure and the VG is located at the centre of the wing section. A wall boundary condition is applied on the wings and on the VG. Table 1
 |
| |
|
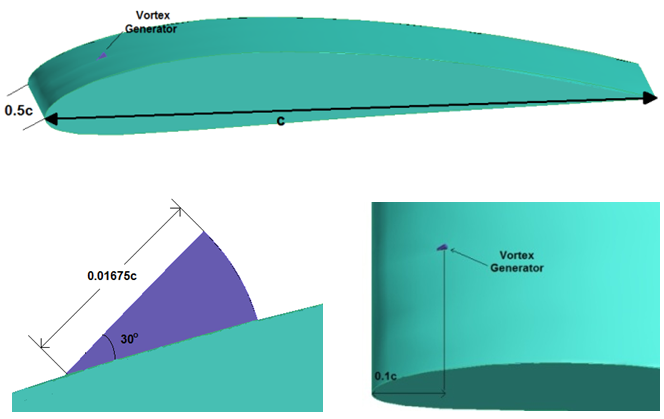 | Figure 1. Schematic of Geometry, Location and Dimensions of Vortex Generator |
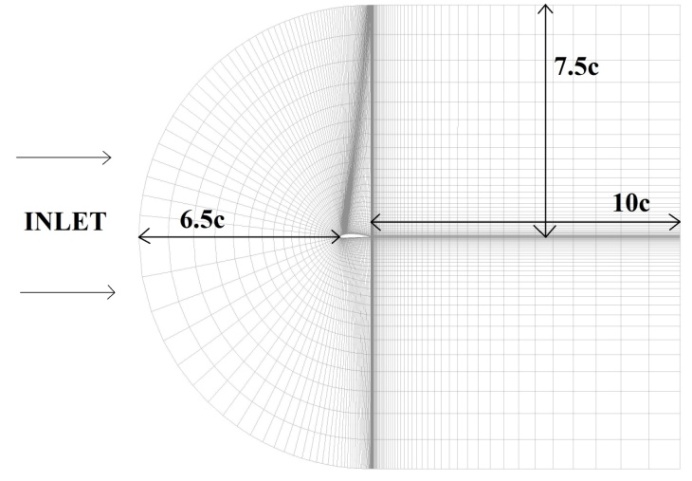 | Figure 2(a). Sketch of Computational Domain |
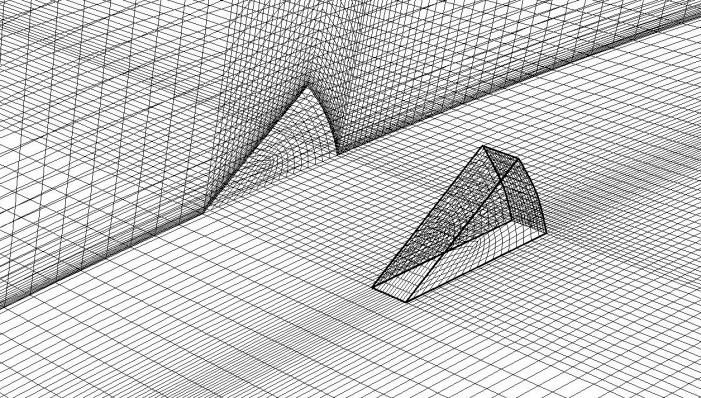 | Figure 2(b). Structured mesh around airfoil with dense mesh near the VG |
3. Numerical Method
The three dimensional Navier-Stokes equation were solved using a commercially available finite-volume based CFD code (Fluent) at a flow Reynolds number of 105. The governing equations for continuity and momentum were discritized with finite-volume formulation using a higher-order scheme. A second order implicit scheme is used for unsteady formulation and the turbulent Reynolds stress terms in the momentum equation are modelled by using the Spart-Allmaras model. The fluid is considered unsteady and the flow field properties evolve in time. A higher order discritization scheme was used which is second order accurate in space and in time. In flows with adverse pressure gradients and accompanied with flow separations SA model provides more accurate results when compared to other models [7]. The simulations were done until the residuals for continuity and x-velocity were below 10-5.
4. Validation
Pinkertson R. [21] conducted experiments to measure the pressure distribution over NACA4412 airfoil at various angles of attacks and tabulated the data of lift coifficient at varying angles of attack at Re=105. Fig. 3 shows the comparison between the experimental results obtained in above study and the numerical reulsts obtained hereby. The variation of lift coifficient with angle of attack is used as a tool for validation of the numerical code adapted. The deviation between the numerical and the experimental results is within acceptable limits. The excellent correlatin between the experimental and the numerical data proves that the numerical scheme used is apt to capture the flow feild over the airfoil in different operational environments.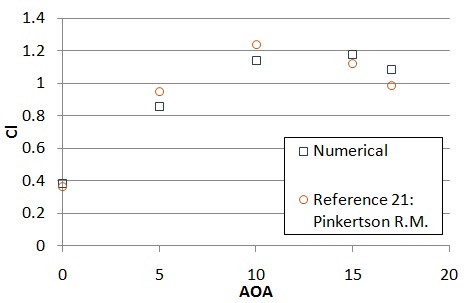 | Figure 3. Validation of numerical scheme |
5. Results and Discussion
To see the effect of VG on the surface of the airfoil first simulations were done for the case when there is no VG on the surface of the airfoil. There are two varying parameters in our current study: angle of attack and VG location on the airfoil. Firstly the angle of attack of the flow over the airfoil is held constant and the VG location is shifted aft on the airfoil surface. At each angle of attack the effect of shift of VG location on lift and pressure distribution over the airfoil surface is noted and the change in these parameters is plotted. Then the analysis is made as to how the VG effects the aerodynamics parameters at various angles of attack when the VG location is held fixed. For example VG is fixed at 0.25c and angle of attack of flow over airfoil is changed and the effects are noted down. The mechanisms attributing to the observed effects are explained in detail.
5.1. Effect on Lift Coefficient
Fig. 4 shows the effect of variable VG location over the lift produced by the airfoil at zero degree angle of attack. At this angle of attack the flow over the airfoil surface remains attached over the entire length of the airfoil. The flow is smooth over the airfoil surface and is undisturbed. The presence of the VG on the airfoil surface at this angle of attack has a harmful effect on the lift produced over the airfoil. The boundary layer flow refers to that region of flow which is very near the airfoil and where the flow interacts with the airfoil surface. The VG disturbs this smooth boundary layer flow thereby lowering the overall lift. The VG affects the entire region of the flow located on the airfoil aft of it. Thus the closer the VG to the leading edge of the airfoil the greater is the region of flow affected and thus a larger reduction in the lift is observed. As the VG is moved aft on the airfoil surface a lesser region of flow over the airfoil is affected and thus the lift is more in these cases, however still less than in the case with no VG over the airfoil surface. The highest negative pressure exists near the leading edge of the airfoil goes on becoming more and more positive as we move aft on the airfoil. Thus it can be concluded that the region of airfoil near the leading edge is more critical from the point of view of its contribution in overall lift. If the VG is located nearer to the leading edge of the airfoil more of this critical region is affected, thereby reducing more of the wing’s lift. At 0.1c location of VG the reduction in wing’s lift is more than its reduction at VG location of 0.3c.Fig. 5 shows the effect of shift in VG location on the lift produced by the wing at five degree angle of attack. As mentioned above the VG has the same effects on the flow over the airfoil and thus the wing’s lift is reduced much when VG is located at 0.1c and as the VG moves aft on the airfoil surface, the reduction in lift is reduced due to the reasons explained above.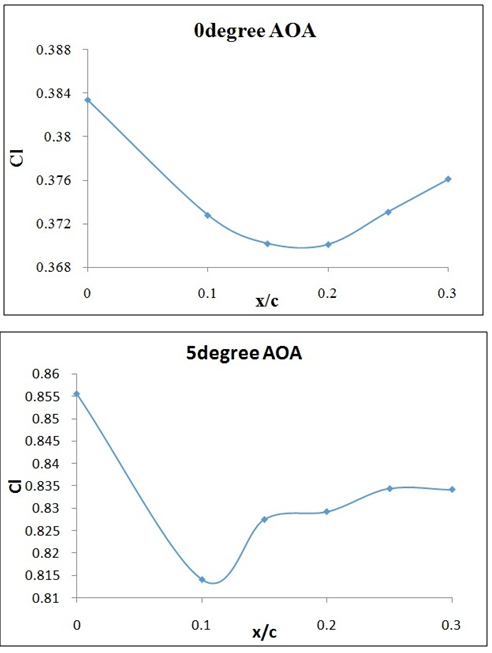 | Figure 4 & 5. Cl vs VG location x/c on Airfoil’s surface |
Fig. 6 shows the same effect for 10degree angle of attack. For the location over the airfoil of 0.25c the VG has the best output. At 0.1c the VG is not able to produce any useful effect but as it shifts aft on the airfoil a small increase in the wing’s lift is observed. The flow intermixing effect of the VG should reach the region where the flow separates so that flow separation can be controlled. Thus too upstream a position of VG is not desirable in cases where separation occurs rather a further downstream VG location is preferable.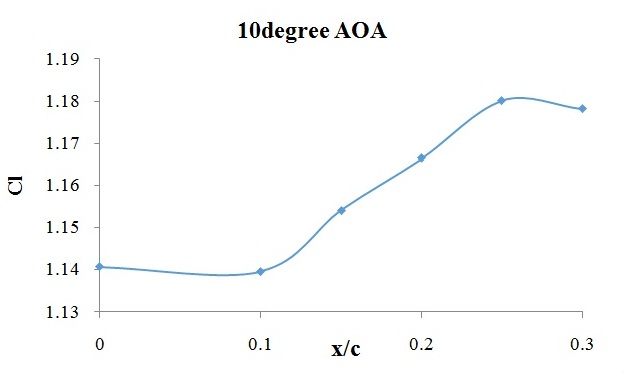 | Figure 6. Cl vs VG location x/c on Airfoil’s surface (AOA=10) |
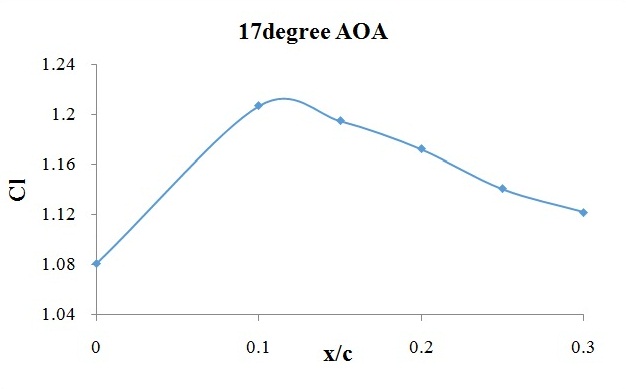
Fig.7 and Fig. 8 show the effect of shift in VG location at 15degree and 17degree angle of attack respectively. It is seen from the two plots that as the angle of attack is increased the favourable location of VG on the airfoil moves forward over the airfoil. At 15 degree the optimum location of VG is at 0.15c on airfoil’s surface and at 17degree angle of attack this optimum location moves forward to 0.1c on airfoil’s surface. At 17degree angle of attack an increase in lift coefficient from 1.05 to 1.21 is observed when VG is at 0.1c on the airfoil.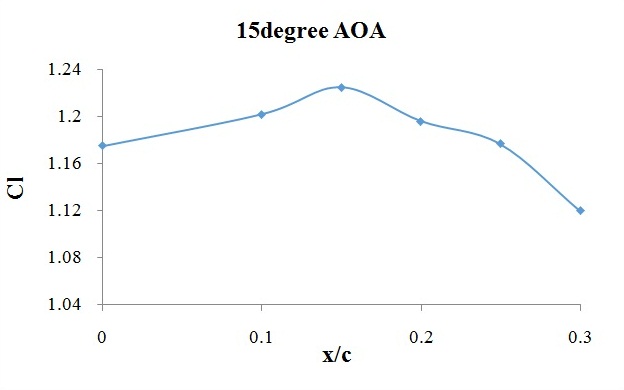 | Figure 7. Cl vs VG location x/c on Airfoil’s surface (AOA=15) |
 | Figure 8. Cl vs VG location x/c on Airfoil’s surface (AOA=17) |
5.2. Overall Effect on Lift and Lift-to-Drag Ration
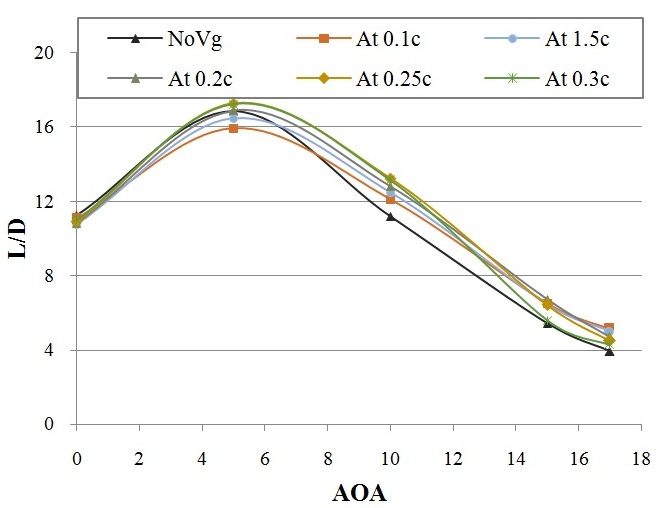
The overall effect of the VG with its changing location on the airfoil is summarized in the following two plots. Fig. 9 is a plot of the lift coefficient of the airfoil at different angles of attack and VG locations while fig. 10 is a plot of L/D of the airfoil at different angles of attack and VG locations. From the first plot it is evident that at 17 degree angle of attack the VG when located at 0.1c (red plot) produces the best performance results. From fig. 10 it is seen that at higher angles of attack the L/D of the case with no VG is lesser than the other cases when VG is present. An increase of L/D of around 31% is observed when the VG is located at 0.1c for 17 degree angle of attack. However the VG shows its maximum harmful effect at this very same location of 0.1c at lower angles of attack as can be seen from the plot of L/D. 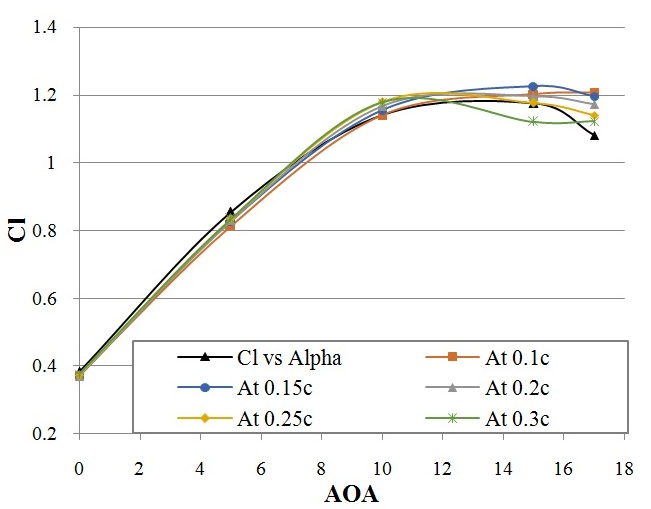 | Figure 9. Cl vs Angle Of Attack at various VG locations |
 | Figure 10. L/D vs Angle of Attack at various VG locations |
5.3. Effect on Pressure Coefficient
In clean airfoil the Cp reaches a minimum value near the airfoil’s leading edge because of high fluid flow acceleration near this region. Just after this in downstream direction Cp increases strongly and creates a strong adverse pressure gradient which results in separation of the boundary layer from the top surface of the airfoil. The addition of the VG reduces this adverse pressure gradient by reducing the rate of increase of Cp on the airfoil surface thereby delaying the boundary layer separation point on airfoil. At smaller angles of attack the VG does not affect the pressure distribution on the airfoil’s surface significantly and hence the Cp plots for various VG locations vary very less from the original case with no VG on airfoil. This explains the minor decrease in the lift at these small angles of attack.Fig. 11 shows the pressure distributions at 17degree angle of attack for various VG locations over the airfoil’s surface. There are significant deviations from the base curve with no VG than in cases with VG. These deviations clearly indicate that the pressure forces have changed after VG is placed on airfoil ant thus the overall lift and the drag produced by the airfoil at high angles of attack change significantly with the introduction of the VG. Much information can be derived from the two plots. It is very interesting to note the order in which the plots of Cp at various VG locations are arranged in the figure. In fig. 11, for the case when the angle of attack is 17degree, the plot of VG at 0.1c deviated the most from the curve for clean airfoil with no VG. Thus for 17degree angle of attack the maximum deviation in pressure distribution over the airfoil’s surface is when the VG is located at 0.1c on airfoil’s surface. This is also confirmed by the analysis of the lift coefficient at this angle of attack for various VG locations. The lift coefficient was maximum for the VG location of 0.1c. At other VG locations the lift coefficient, though higher than the clean airfoil case, was still lesser than that at 0.1c VG location. As the VG is moved back on airfoil’s surface percentage of lift coefficient enhancement goes on decreasing. It is noted that the same is the pattern followed by the Cp plots with maximum deviation showed by the plot when VG is at 0.1c and this deviation from the clean airfoil’s case goes on decreasing as the VG is shifted aft on the airfoil’s surface.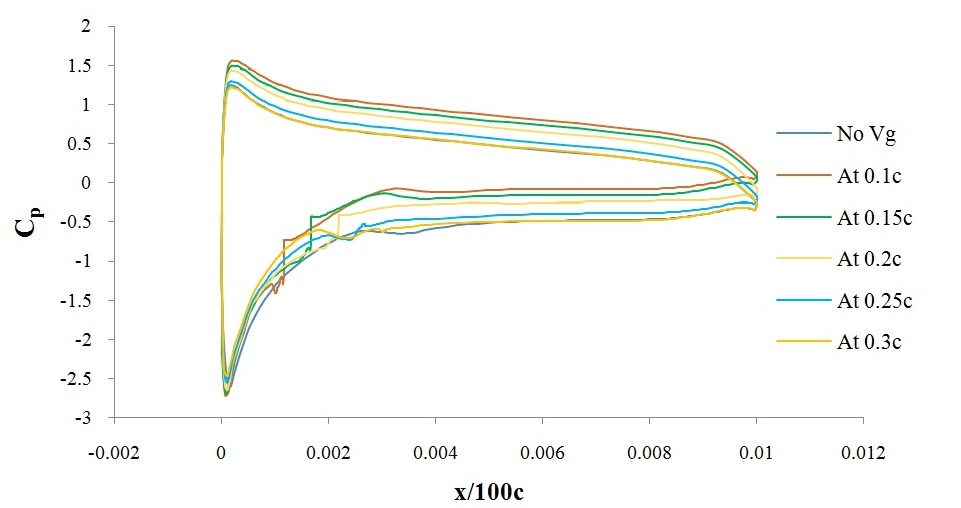 | Figure 11. Cp vs (x/100c) on airfoil’s surface at various VG locations (c=0.01 units): 17degree |
5.4. Effect on Separation Point
When the fluid flow over the surface of the airfoil stagnates then at that point the shear stress acting on the fluid flow goes to zero. Thus a plot of skin-friction coefficient in x-direction with chord length tells us about the separation point of the flow on the airfoil. When flow separation occurs, the fluid flow x-velocity just above the surface of the airfoil goes to zero and hence the skin-friction goes to zero. Fig. 12a and Fig. 12b show the plot of x-velocity vectors on the wing mid-plane oriented along the flow direction. The x-velocity vectors show the prominent shift in separation point on the upper airfoil surface at 15 degree angle of attack with the VG at 0.1c on the airfoil’s surface. The separation point is marked in the figure where the x-velocity vector is perpendicular to the airfoil’s surface. The separation point moved much aft the airfoil’s surface under the presence of VG. The selected points are separation points after observing that the x-velocity vectors change direction beyond the point, representing a reversed flow on the downstream side.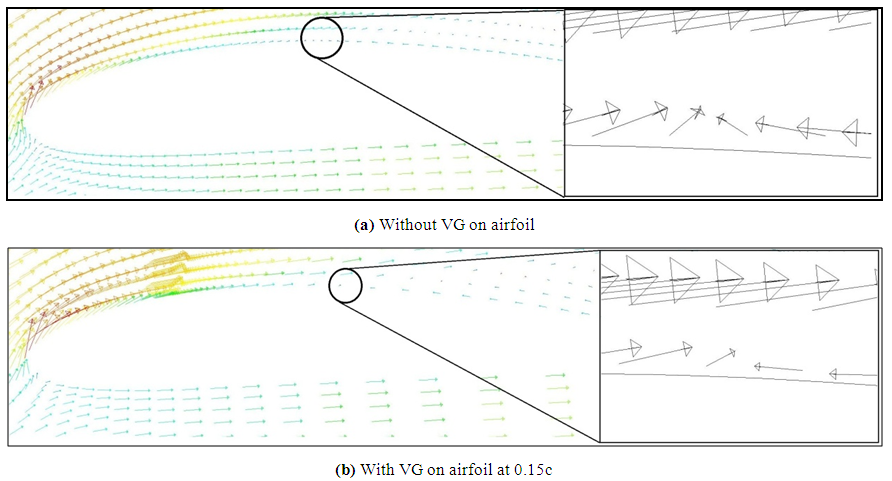 | Figure 12. Velocity vectors showing shift in separation point at 15degree angle of attack |
Fig.13 shows the detailed results of the flow separation locations over the surface of the airfoil. The point where skin friction coefficient drops to zero over the airfoil surface is the flow separation point. Thus the data of the spread of skin friction coefficient over the airfoil’s surface is used to determine the exact flow separation point in all cases with and without the vortex generator. The separation point in the case with no VG (dark blue curve) is at 31% of the chord but with the introduction of VG this moves further downstream. When VG is located at 0.1c (red curve) the separation point shifts to 38% of the chord. The shift in separation point is much more when VG is at 0.15c (purple curve) as was concluded from the results mentioned earlier. From this plot we can conclude that separation point shifts to 42% of the chord at this location of the VG. Thus a 35.5% shift in separation point of the airfoil from the previous point is observed owing to the presence of VG at 0.15c. At 0.2c, 0.25c and 0.3c location of the VG the shift in separation point is minor in the downstream direction from its original position and hence the effect of VG is not much pronounced in these cases. These curves are thus not bold outlined in the Fig. 13 as these VG locations do not promise a better flow separation control. It is also worth noting the coherence which is established between the data of lift coefficient, pressure coefficient plots and separation point locations over the airfoils with different VG locations.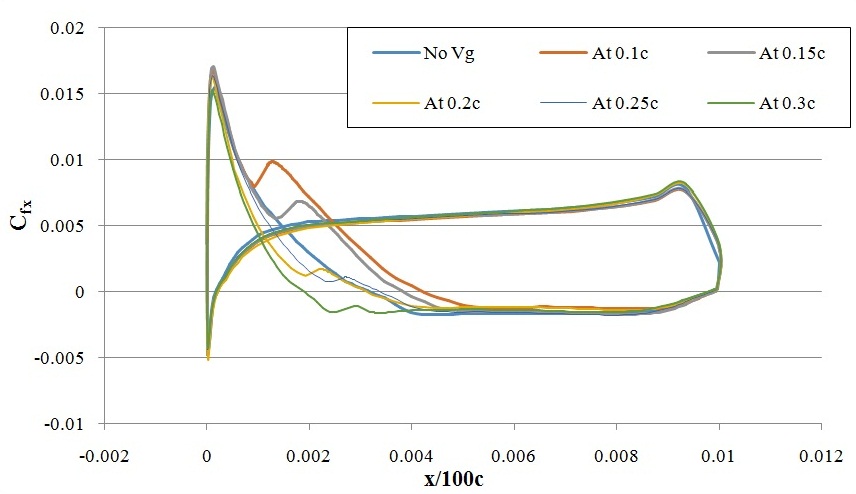 | Figure 13. Skin-Friction Coefficient Vs x/c on airfoil surface at 15degree AOA |
Fig. 14a to Fig. 14d are plots of x-velocity vectors in the flow field at different locations of the VG at 17deg angle of attack showing the shift in separation point at these locations. Figure 15 is a plot of x-direction skin-friction coefficient which reflects the separation point on the airfoil as the curve cuts the x=0 line (when flow separation occurs Cfx = 0). The curves corresponding to no VG case and when VG is at 0.1 and 0.15c are bold outlined for comparison while the rest curves are less significant as the separation point remains nearly the same with those VG locations. From the plot of skin-friction coefficient (fig. 15), the separation point in the case with no VG (dark blue curve) on airfoil’s surface is at 19% of the airfoil’s chord. When the VG is located at 0.1c on airfoil’s surface (red curve) this separation point shift downstream on the airfoil to 33% of the chord. Thus a 71% shift in separation point of the airfoil from the previous point is observed owing to the presence of VG at 0.1c on the airfoil. A positive shift in separation point is observed only when VG is located at 0.1c and 0.15c which is confirmed by the velocity vector plots. At advanced locations of the VG more than 0.2c on the airfoil, the VG is not able to delay separation. As the angle of attack is increased the separation point on airfoil’s surface moves upstream. Thus a more advanced location of VG is desired. The VG is rendered of no use if it is located after the flow has separated on the airfoil; in the case shown in fig. 14d the VG is in reversed flow region and cannot delay separation, rather it aggravates the harmful situation over the airfoil. Thus at higher angles of attack the VG should not be located at larger distances from the airfoil’s leading edge.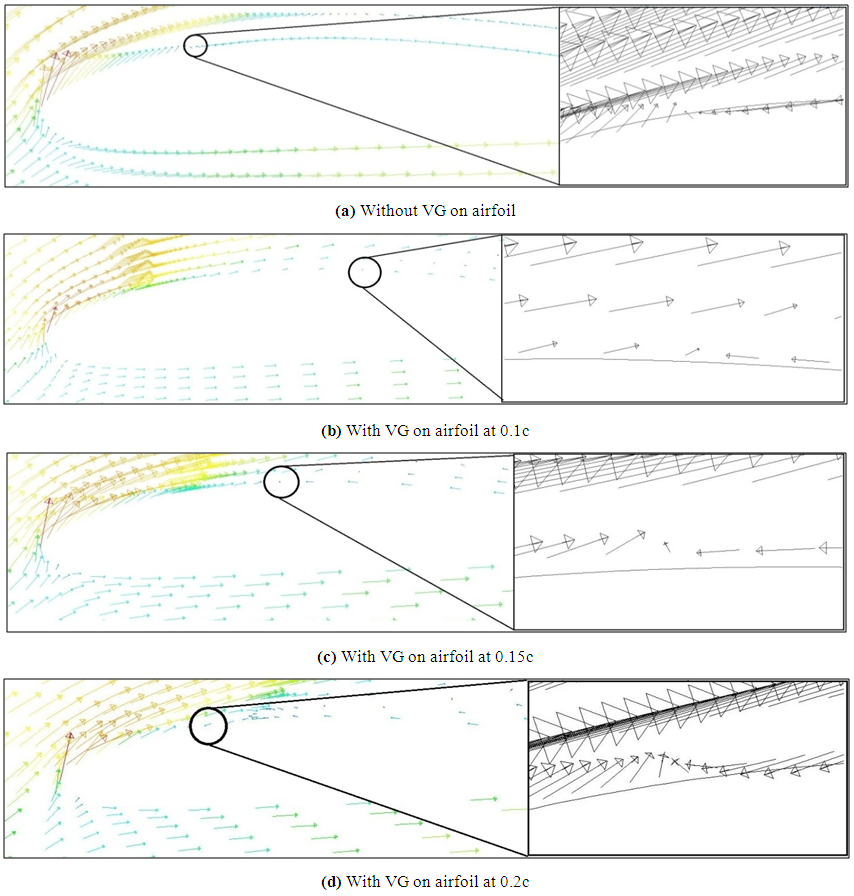 | Figure 14. Velocity vectors showing shift in separation point at 17degree angle of attack |
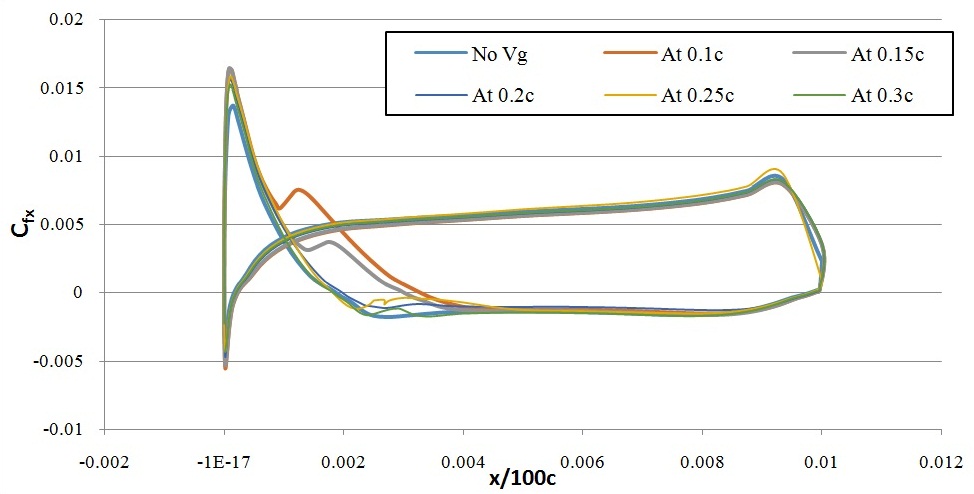 | Figure 15. Skin-Friction Coefficient Vs x/c on airfoil surface at 17degree AOA |
6. Conclusions
Flow simulation using the FLUENT package is carried out over NACA4412 airfoil and different locations of the VG. The influence of the VG at various locations over the airfoil on various aerodynamic parameters like lift coefficient, pressure distribution and separation point is discussed. • At low angles of attack the VG does not enhance wing’s performance but rather has a harmful effect at all locations on the airfoil. • At high angles of attack the VG improves the angle of attack by increasing the lift coefficient and delaying the stall on the airfoil. There is an overall increase in lift-to-drag ration at higher angles of attack but it also varies with the location of VG at these angles of attack. • For different angles of attack of the wing the VG produces the best results at different locations over the wing. At 10degree angles of attack the VG produces best results at 0.25c on airfoil, at 15degree angle of attack the VG does so when located at 0.15c on airfoil and at 17degree angle of attack the VG enhances the properties of wing to the maximum when located at 0.1c on airfoil.• The VG delays the stall and the separation point of the flow on airfoil suction side moves downstream on the airfoil due to the VG however the effect is most prominent when VG is at its optimum location for that angle of attack as discussed above. Thus the presence of VG enhances the performance of the wing at high angles of attack with negligible decrease in wing’s performance at low angles of attack. The location of the VG is very important parameter to optimize its efficiency in improving the wing’s performance and this parameter should be kept in mind while installing VGs for flow separation control.
Nomenclature
References
| [1] | Yaras, M.I. and Grosvenor, A.D. (2003) ‘The elimination of diffuser separation by vortex generators’, United Corporation Report No. R-4012-3. |
| [2] | Lin, J.C., Selby, G.V. and Howard, F.G. (1991) ‘Turbulent flow separation control’, AIAA paper 91-0042. |
| [3] | Babinsky H., Loth E. and Lee S. (2010) ‘Vortex generators to control boundary later interactions’, The Board of Trustee of The University of Illinois, US8656957 B2. |
| [4] | Taylor, H.D. (1947) ‘The elimination of diffuser separation by vortex generators’, United Aircraft Corporation Report No.R-4012-3. |
| [5] | Schubauer, G.B. and Spangenberg, W.G. (1960) ‘Forced mixing in boundary layers’, Journal of Fluid Mechanics 8, 10-12. |
| [6] | Akcayoglu A. (2011) ‘Flow past confined delta-wing type vortex generators’, Experimental Thermal and Fluid Science 35 (2011) 112-120. |
| [7] | Gary O. Wheeler. Low Drag Vortex Generators, 1989; US 5058837 A. |
| [8] | Zhen, T.K., Zubair, M. and Ahmad K.A. (2011) ‘Experimental and numerical investigation of the effects of passive vortex generators on Aludra UAV performance’, Chinese Journal of Aeronautics, 24 577-583. |
| [9] | Koike M., Nagayoshi T. and Hamamoto N. (2004) ‘Research on Aerodynamic drag Reduction by Vortex Generators’, Mitsubishi Motors, Technical Review No. 16. |
| [10] | Kuya Y., Takeda K., Zhang X., Beeton S. and Pandaleon T. (2009) ‘Flow separation control on a racecar wing with vortex generators’, Journal of Fluids Engineering 131 , 121103. |
| [11] | Kuya, Y, Takeda K., Zhang X., Beeton S. and Pandaleon T. (2009) ‘Flow physics of a racecar wing with vortex generators in ground effect’, Journal of Fluids Engineering 131, 121103. |
| [12] | Alam F., Chowdhary H., Moria H., Mazumdar H. and Subic A. (2012) ‘An experimental Study of Golf Ball Aerodynamics’, 13th Asian Congress of Fluid Mechanics. |
| [13] | Aoki K., Muto K. and Okanaga H. (2010) ‘Aerodynamic characteristics and flow pattern of a golf ball with rotation’, Procedia Engineering, Volume 2, Issue 2, Pages 2431-243. |
| [14] | Rao E., Anjuri V.S.J., Nanukuttan B., Loganathan J. and Herr S. (2010) ‘Vortex Generators assembly for use with a wind turbine rotor blade and method for assembling a wind turbine rotor blade’, General Electric Company, US8038396 B2. |
| [15] | Gad-el-Hak and Brushnell, D.M. (1991) ‘Separation control: review’, Journal of Fluids Engineering 113, 5-30.’ |
| [16] | Siauw, W.L., Bonnet, J.P., Tensi, J. and Cattafesta L. (2009) ‘Physics of separated flow over a NACA 0015 Airfoil and Detection of Flow Separation’, AIAA paper 2009-144. |
| [17] | Lin, J.C., Howard F.G. and Brushnell (1990) ‘Investigation of several passive and active methods for turbulent flow separation control’, AIAA paper 90-1598. |
| [18] | Bragg, M.B. and Gregorek G.M. (1987) ‘Experimental study of airfoil performance with vortex generators’, Journal of Aircraft 24, 305-309. |
| [19] | Lengani D., Simoni D., Ubaldi M., Zunino P. and Bertini F. (2011) ‘Turbulent separation and loss evaluation of low profile vortex generators’, Experimental Thermal and Fluid Science. |
| [20] | Lin J.C. (2002) ‘Review of research on low profile vortex generators to control boundary layer separation’, Progress in Aerospace Sciences 38 (2002) 389-420. |
| [21] | Pinkerton R.M. (1937) ‘The variation with Reynolds number of pressure distribution over an airfoil section’, Report No.-613, National Advisory Committee for Aeronautics. |

 Abstract
 Reference
 Full-Text PDF
 Full-text HTML