-
Paper Information
- Paper Submission
-
Journal Information
- About This Journal
- Editorial Board
- Current Issue
- Archive
- Author Guidelines
- Contact Us
American Journal of Fluid Dynamics
p-ISSN: 2168-4707 e-ISSN: 2168-4715
2014; 4(2): 49-55
doi:10.5923/j.ajfd.20140402.01
Thought Provoking Applications of Fluid Mechanics to Non-fluid Systems
 Abstract
 Reference
 Full-Text PDF
 Full-text HTML
Pushpendra K. Jain
Department of Physics, University of Botswana, Private Bag UB 00704, Gaborone, Botswana
Correspondence to: Pushpendra K. Jain, Department of Physics, University of Botswana, Private Bag UB 00704, Gaborone, Botswana.
| Email: |  |
Copyright © 2014 Scientific & Academic Publishing. All Rights Reserved.
Study of liquids and gases at rest or in motion comprise the most common and majority of applications of fluid mechanics. To a lesser extent principles of fluid mechanics have also been applied to non-fluid systems which can be modeled to mimic fluids. Examples of such systems include avalanche, land and debris slide, mudflow, hurricane, sand dune, airborne sand transport, microbial locomotion, and volcanic lava flow to name a few. Such systems are not commonly studied by fluid mechanists in natural sciences, i.e., mathematicians and physicists. This paper describes few applications of fluid mechanics to non-fluid systems in order to stimulate dialogue and discussion amongst pure fluid mechanists with a possibility of opening up new windows on fluid mechanics for research and teaching.
Keywords: Fluid mechanics, Non-fluid systems, Avalanche, Landslide, Mudflow, Hurricane, Sand dune
Cite this paper: Pushpendra K. Jain, Thought Provoking Applications of Fluid Mechanics to Non-fluid Systems, American Journal of Fluid Dynamics, Vol. 4 No. 2, 2014, pp. 49-55. doi: 10.5923/j.ajfd.20140402.01.
Article Outline
1. Introduction
- Fluid mechanics principally deals with liquids and gases at rest or in motion referred to as fluid statics and fluid dynamics respectively. When applied to water these are termed as hydrostatics and hydrodynamics respectively. Fluid statics deals with designing of dam walls, dykes, flood gates, fluid storage tanks etc. Fluid dynamics has a much wider range of applications. The most common ones are the pipe flow problems with applications to chemical industry, crude oil pipe lines, oil refinery, water distribution network, sewerage disposal system and blood flow through arteries and capillaries to name a few. Width and length of pipes may vary over a broad range from few micron diameter and short length for application to blood flow to over one meter wide pipes and several hundred kilometers in length in case of a crude oil pipe line. The pipe line could be a single or multiple pipe system of varying widths. Other applications of fluid dynamics include open channel flow, ground water circulation and seepage, fluid discharge from underflow and sluice gates, river and harbour engineering, windmill and turbine engineering, atmospheric and water pollution transport, radiation transport from nuclear accidents, atmospherics dynamics, designing of streamlined automobiles, high speed trains, airplanes, and ocean liners to minimize drag and fuel consumption, etc. These applications involveonly either liquids or gases under varying initial and boundary conditions, and constitute the bulk of work by fluid mechanists in natural sciences.Principles of fluid mechanics have also been applied, mostly by researchers in other disciplines of sciences and engineering, to non-fluid systems which are modeled to mimic fluids. For examples, land and debris slide and mudflow are of interest to civil engineers, understanding of avalanches are of paramount importance for skiers and mountaineers and for the protection of hill communities in northern latitudes, modeling and predicting hurricanes is pursued by meteorologists, sand dunes dynamics and desert mechanics are a challenge for desert ecologists. Such systems are generally not studied by fluid mechanists in natural sciences, although they have one thing in common. They can be modeled, studied and understood using the principles of fluid mechanics. This paper presents some applications of fluid mechanics to non-fluid systems to stimulate dialogue and discussion among fluid mechanists in physical and mathematical sciences with the possibility of opening up new windows on research and teaching in these areas.
2. Avalanche
- Avalanches are most common during winter when the snow accumulates, and in spring when the ice and snow begins to thaw. They could be triggered either by natural events such as loading from new uncompacted snow, thawing of older snow, rain, earth quake, or could be artificially triggered by snow mobiles, explosives, gunshots, movement of animals, skiers etc. Avalanches are persistent threat to life and property in snow covered hill regions. Skiers and mountaineers are at particular risk. Avalanches kill 100 to 200 people per year, destroy settlements and forest, and damage roads, railway, power infrastructure and communication network. Avalanches are classified by the type of snow involved, namely loose snow avalanche or a slab avalanche, and both could be either dry snow or wet snow avalanche. Avalanches can carry large volumes of snow and ice over distances of up to 15 km, reaching velocities of up to 300 km h-1, could deliver a pressure of 50 tons per square meter on impact, and can mix air and water with the descending snow and ice. Large ones could carry rocks, and trees with them. In term of their size and destructive power, avalanches are graded in 5 categories in Canada and USA and in 4 categories in Europe on a logarithmic scale. Size 1 avalanche is relatively harmless to people only with possible risk of injury, and a size 5 avalanche could destroy a village or up to 40 hectares of forest [1].Scientists have been studying avalanches to improve their prediction and to minimize loss to life and property by building defense systems against them. Aim of avalanche research is to develop and validate models that can describe the evolution of the seasonal snowpack. Some countries, that are highly prone to avalanches, have established avalanche research bodies, for example the Swiss Federal Institute for Snow and Avalanche Research (SLF), the Center of Snow Studies in France, University of Calgary and University of British Columbia Avalanche Research Groups, and Colorado Avalanche Information Center. Conventional research structures are also involved in avalanche research such as the universities based academic and applied research groups, National Research Council of Canada, and the US Forest Service.The avalanche dynamics is governed by a driving force F which is the component of the weight of the avalanche parallel to the slope, and an opposing resistance force R [2]. The opposing resistance force R itself is composed of five components [2, 3]: ● Sliding friction between the avalanche and the underlying snow or ground.● Internal dynamic shear resistance due to collisions and momentum exchange between snow particles and blocks.● Turbulent friction within the snow/ air suspension.● Shear between the avalanche and the surrounding air.● Fluid-dynamic drag at the front of the avalanche.Latter three components of R are fluid dynamic forces, and are predominant in soft snow avalanches. The avalanche track can be divided in to three segments [2]. In the starting zone, F>R causing the avalanche to accelerate to a maximum terminal velocity, in the track zone, F= R and the avalanche travels with the constant terminal velocity, and the last segment of the track is the runout zone in which F < R causing the avalanche to slow down and stop [2, 3]. Avalanche models are based on limited measured data of avalanche velocity, dynamic pressures, densities, flow dimension, and travel distance or runout distance. The first theoretical basis of avalanche dynamics was given in 1995 by the Voellmy’s fluid dynamics model of avalanche movement [4]. It is still the most commonly used tool of avalanche analysis in Europe and North America. The model predicts the maximum velocity of an avalanche in terms of the flow height, coefficient of turbulent friction, coefficient of sliding friction, and the slope angle. For the avalanche confined to a channel, the flow height is replaced with the hydraulic radius, R. The runout zonedistance travelled by the avalanche during the deceleration phase, and the impact pressure on objects in the avalanche path can also be determined from the model.Most commonly used avalanche simulation models are the depth-averaged hydraulic models. The mass and momentum conservation equations are similar to equations for the motion of waves in shallow water modified to account for the solid nature of snow [5]. Also, avalanches usually collect snow as they slide down the slope. The entrainment of snow is treated as a drag force that reduces acceleration of the avalanche as it travels down the slope [5].Real measured or simulated-experimental data is necessary to develop advanced avalanche models, for their computer simulation, and to make accurate predictions. Techniques and devices have been developed to collect data from real avalanches, artificially triggered avalanches, and avalanches simulated in laboratory and outdoor. Some experimental approaches used in avalanche data collection include:● The avalanches are artificially triggered using explosives which then flow past measuring instruments placed along the avalanche path [5]. ● Useful information on the shape and velocity is obtained by processing video images of a moving avalanche [6].● Researchers at Ecole Polytechnique Fédérale de Lausanne (EPFL), Switzerland have developed egg-sized sensors (Figure 1[6]). Twenty to thirty such sensors are dropped by helicopter on snow covered mountain slope to collect data on velocity etc. from an advancing avalanche. The collected data is relayed to a central computer [6].
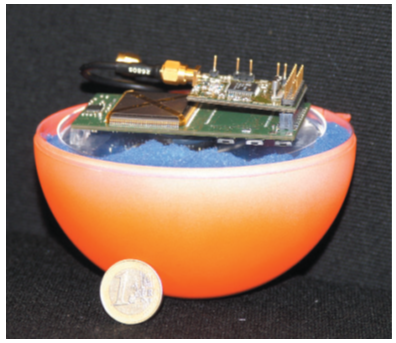 | Figure 1. Sensor developed at the EPFL, Switzerland to record real data of an advancingavalanche moving down a mountain slope [6] |
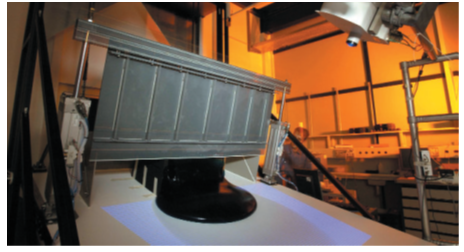 | Figure 2. Experimental set-up for laboratory simulation of an avalanche using Carbopol gel to mimic snow flowing down a slope [6] |
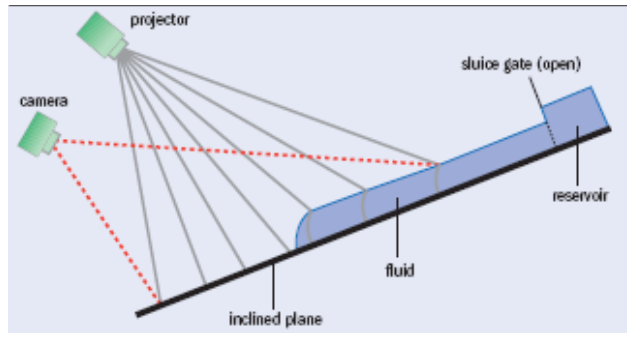 | Figure 3. Schematic of the optical set-up for taking measurements on the avalanching Carbopol gel in the laboratory simulation of an avalanche shown in Figure 2 [6] |
3. Landslide
- Landslide is ground movement under gravity on a slope when it changes from stable to unstable. Hill regions with heavy rain or snow fall are more prone to land slide. Depending on the geology of the land mass, landslide could be fine grained earth, or debris with or without water content, rock fall or large boulders movement. The different types of landslides are [7]:● Movement of the land mass.● Debris flow.● Earth flow.● Debris avalanche.● Shallow landslide.● Deep-seated landslide.● Sturzstrom. It is a rare, often very large and a very mobile landslide with a long run-out over low angle, flat and even slightly uphill terrain.● Undersea landsides. These can generate tsunamis.Landslides can be caused by natural as well as manmade causes. Natural causes of landslide include [7]:● Groundwater pressure acting to destabilize the slope.● Loss or absence of vertical vegetative structure, soil nutrients and soil structure which hold and bind the soil together. This could happen following wild fire or could result from human activities.● Erosion of the toe of a slope by the action of water from adjacent river or ocean.● Weakening of the slope through saturation by snowmelt, glacier melting, heavy rains.● Earthquakes.● Volcanic activity.● The manmade causes of landslide are [7]:● Deforestation, cultivation and construction that destabalize slopes.● Blasting.● Earthwork which cahanges the shape of slope, or imposes new load on the slope.● Construction, forestry (logging) and agriculture activities that change the amount of water that infiltrates the soil.Landslides not only cause damage to the environment and ecology of the affected area, large ones can result in loss of life, some times upto several hundered, extensive damage to property and infrastructure by uprooting or burrying them under debris that could run in to millions of US$. Aftermaths of landslide are the failure of water and sewerage services from damage to supply network and pipe lines, disruption of transport, power, and communication services affecting the relief and rescue operations. As an example, in the 2005 La Conchitaland slide, California, USA, the land volume displaced was estimated to be approximately 200,000 cubic meters with a surface 350 meters long and 80–100 meters wide. There were 10 confirmed fatalities, 13 houses were destoryed and 23 others were severely damaged [8].Landslide hazard analysis and understanding can help to minimize loss and disruption, to implement safety measures and for sustainable land use planning. Here we cite few examples of work on landslide modeling and simulation using fluid dynamics. These will lead interested researchers to further and current literature.Hunt’s [9] work on Newtonian fluid mechanics treatment of debris flow and avalanches models debris flow as viscous laminar flow on a slope. Singular perturbation techniques are used to obtain first-order solution for non-uniform flow from a point source on a steep slope. Solutions for both laminar and turbulent flow are obtained. The laminar flow model is found to give the best description of the laboratory data. However,, the differences in the solutions for the laminar and turbulent flow suggest that not all debris flow and avalanches can be modeled as laminar flow.Quisca et.al. [10] used numerical techniques to obtain approximate solutions assuming shallow-water theory, and concluded that debris flows, mud flows, and avalanches may be considered in regimes with predominent viscous stresses as Newtonian laminar flow.Trunk et.al. [11] apply computer simulation to model large rock slides. Three models: (i) incompressible linear viscous flow, (ii) single viscosity model, and (iii) two viscosity model approaching Binghal material are used to calculate slide runout, debris distribution and speed of flow. Biviscous model is found to depict the measured physical characteristic of a debris flow.In conclusion modeling and simulation of landslides is an important research discipline to understand, predict, and map them to protect life, property and environment for which fluid mechanics has been used. There is need for more field data to refine the models.
4. Mudflow
- Mudflow or mudslideis landslide mixed with high water content, imparting consistency of mud to the earth debris. It is triggered by heavy rain on hill or mountain slope, sudden thaw (snowmelt), and high level of ground water flowing through cracked bedrock. A mudslide can reach rapid velocities of upto 80 km h-1 [12]Mudslides are classified in terms of their water content, solid rock and debris content, total mass, velocity, and the travel distance. A fast moving, rapid mudflow can instantly uproot and bury houses, flood townsand streets, and cause extensive loss of life and damage to property. Amongst large mudflows in recent decades is the mudflow in Vargas, Venezuela in 1999 which caused a damage of an estimated 1.8 to 3.5 billion US$, the death toll was between 10,000 to 30,000, and 85, 000 people were evacuated. Guatemala mudflow in 2010 affected 50,000 people killing 45 with an estimated damage of 375 to 500 million US$. Also in 2010, mudslide in Gansu province of China left at least 1467 people dead and over 300 missing. [12].Fluid dynamic models of mudflow have been developed to predict velocity and volume of mud flow, and thereby to estimate the resulting potential damage to property. Julien [13] has tested models to predict mudflow and debris flow velocities against 350 field and laboratory measurements. Overall the turbulant model is found to perform best; while the dispersive stress approach compares well only when flow depth h is less than 50 times the median particle diameter.Hungr [14] has modeled debris flow surges using the theory of uniformly progressive flow incorporating zoned longitudinal variation in rheology. It is shown that the shape of the surge flow profiles is determined not only by the rheology of the retained material, but by the longitudinal variation of material characteristics. Typically, a steep, bouldery front is followed by an accumulation of liquid slurry, which in turn decays into a dilute tail [14].
5. Hurricane Dynamics
- Hurricanes are fast moving, rotating, low-pressure weather systems, with a central eye (Figure 4 [15]). They can reach speeds of over 120 km h-1 at 10 m above the sea surface, and can cause devastating loss of life and property. The 2005 Hurricane Katrina over New Orleans, USA resulted in the loss of over 1300 lives and estimated US$125 billion damage to property and infrastructure [16].
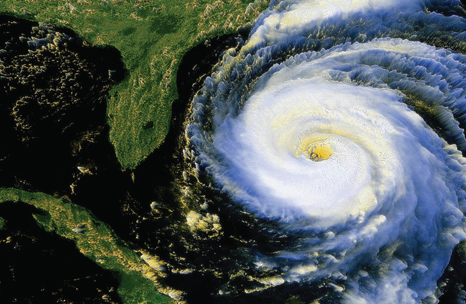 | Figure 4. A satellite picture of a hurricane as a rotating weather system with a central eye [15] |
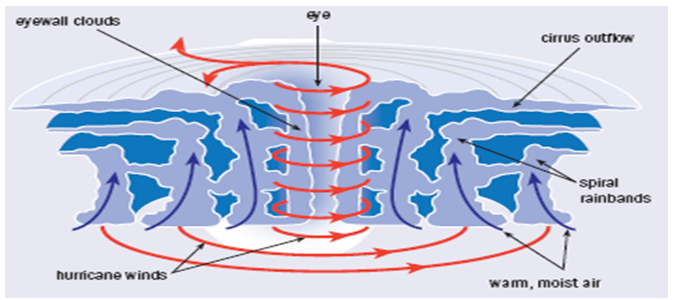 | Figure 5. Dynamics of air flow in hurricane [16] |
6. Desert Mechanics and Sand Dunes
- An erodible bed sheared by fluid flow, gas or liquid, is unstable resulting in the formation of bed forms, the river bed sand dunes and the desert sand dunes. Principles of fluid dynamics have been applied to study the formation of riverbed as well as the desert sand dunes.Niemann et.al. [17] have studied the development of sand dunes in an erodible bed exposed to flowing water using a numerical flow model. The flow model is based on a k-ω turbulance closure. The sedimnt transport is assumed to be bed-load only with avalanche-like movement on the steep dune front. Results of dune development are presented for different initial wavelength. It is demonstrated that an equilibrium shape is developed if wavelength – depth ratio is sufficiently small.Sand dunes have linear, crescent shaped or star like forms. Using a combination of field measurements and aerodynamic calculations, Andreotti et. al. [18] conclude that the desert dunes are governed by a process similar to that of riverbed dunes. The growth of the dunes is limited by the confinement of the flow within the atmospheric boundary layer. The atmospheric layer above plays a central stabilizing role in limiting the size of sand dunes in the same way as water flow does for the reverbed dunes.Charru et. al. [19] have studied bedform growth governing both the sand dunes and the riverbed dunes. Questions they raiseand the issues considered include: (i) Relevant dynamical mechanisms controlling the emergence of the bedforms. (ii) Differences between aeolian and subaquious patterns. (iii) Do the linear instability or the non-linear processes play a role? (iv) What determines their time and length scales that are vastly different in air and water? (v) What role does the mode of transport play, if any? and (vi) Emergence of bedformsunder laminar and turbulent hydrodynamical regime. Guided by these questions, a unified description of bedform growth and saturation is proposed, with emphasis on the hydrodynamical regime in the innerlayer and the relaxation phenomenon associated with particle transport.
7. Microbial Locomotion
- Microbial organism, from gut-inhibiting bacteria to sea-dwelling algae, show coordinated movement in fluid. Non-linear dynamics and fluid mechanics have been used to explain their coordinated locomotion [20]. When the organism moves it produces a flow field that depends on its swimming pattern. Swimming pushes and pulls the surrounding fluid which in turn exerts a stress on other organisms. Over the scale of micro-organism, the fluid appears very viscous, and the hydrodynamic forces can extend over long distances. As a result hydrodynamic interaction between micro-organisms is long ranged resulting in coordinated locomotion [20].
8. Sahara Dust Fertalizes Amazon
- About (240 ± 80)million tons of dust is transported annually from Africa to the Atlantic Ocean of which(50 ± 15) million tons reaches and gets deposited in the Amazon rain forest basin [21]. The soil of Amazon rainforest is poor in nutreants and minerals due to washout from the rains, and a regular supply of minerals and nutreants is needed to sustain the rainforest [22]. It is the dust blown from Sahara that fertalizes the Amazon and is responsible for the health and productivity of the rain forest. If it was not for the soil nutrients supplied by the dust from Sahara, Amazon shall not be able to sustain itself, and would turn in to a wet desert [21].The origin of the dust reaching Amazonhas been established from the analysis of the ground soils along the transport path where some of the dust settles down, and it is found to match the soil from the source of origin in Sahara, Africa [21]. The dust transport from Africa to the Amazon can be seen from the satellite images [23]. The dust transport is governed by the wind pattern involving applications of the aspects of fluid dynamics in the study and analysis of the satellite data.
9. Other Systems
- Non-fluid systems and processes presented here are not the only ones that are studies using fluid mechanics. There are many more systems and processes that can be analyzed and understood using principles of fluid mechanics. Volcanic lava flow, traffic flow at intersections and traffic exchanges, transport of atmospheric and waterborne pollution, progression of oil spills in the sea, transport of nuclear radiation from nuclear events and accidents are some other systems and processes that can also be understood using fluid mechanics. Pollution and radiation transport perhaps can then be related to possible outbreak of pollution and radiation related diseases in areas far from their source of origin.
10. Conclusions
- In recent decades, applications of fluid mechanics to non-fluid systems and non-conventional fluid systems have been developed to model related processes and to forecast related events. In this paper we have presented applications of fluid mechanics to seven such systems. Amongst these avalanches, landslide, mud flow and hurricanes result in a large number of lives lost and huge damage to property, infrastructure and ecology of the region amounting to billions of dollars annually worldwide. Modeling of such events and predicting of their occurrence and intensity could reduce the losses suffered. The desert mechanics and Sahara sand transport to Amazon rain forest play a defining role in the ecology of these regions, and microbial locomotion has applications in bio-medical sciences which helps us understand the spread of bacteria through blood stream and contamination of fluid bodies through the dispersion of microbes. These are just a few examples of the applications in the understanding of non-fluid systems which can be modeled as fluid. Many more can be named or found in literature to which also principles of fluid mechanics can be applied for their understanding, analysis and modeling. It is hoped that this short review can inspire some of the traditional fluid mechanists to diversify their research areas and the new graduate students to venture in to the study of new and more challenging systems. At the same time, most text books on fluid mechanics present only conventional applications to liquids and gases which deal with fluid containment and fluid flow problems. This presentation can also inspire inclusion of non-fluid systems such as those presented here in the teaching curricula. The article is not to be treated as a comprehensive review of any of the systems presented, and should only be used as a source of thought provocation which will lead readers to further search in specific area for the required purpose. Likewise, the short list of references which includes three to four references for each of the systems discussed here shall lead interested readers to further literature search for systems of interest.