-
Paper Information
- Paper Submission
-
Journal Information
- About This Journal
- Editorial Board
- Current Issue
- Archive
- Author Guidelines
- Contact Us
American Journal of Environmental Engineering
p-ISSN: 2166-4633 e-ISSN: 2166-465X
2025; 15(1): 21-34
doi:10.5923/j.ajee.20251501.03
Received: Nov. 10, 2025; Accepted: Nov. 29, 2025; Published: Dec. 13, 2025

The Emerging Landscape of Green Construction Finance in Kenya: Adoption and Determinants
 Abstract
 Reference
 Full-Text PDF
 Full-text HTML
Dorcas Mutheu Musingi1, Shadrack Mutungi Simon2
1Department of Building and Civil Engineering, Technical University of Mombasa, Kenya
2Department of Construction Management, Jomo Kenyatta University of Agriculture and Technology, Kenya
Correspondence to: Dorcas Mutheu Musingi, Department of Building and Civil Engineering, Technical University of Mombasa, Kenya.
| Email: |  |
Copyright © 2025 The Author(s). Published by Scientific & Academic Publishing.
This work is licensed under the Creative Commons Attribution International License (CC BY).
http://creativecommons.org/licenses/by/4.0/

This study investigates the adoption of Green Construction Finance (GCF) and its determinants within Kenya’s construction industry, focusing on architects and developers as key stakeholders. Using a survey research design, data were collected from 163 architects and 55 developers, examining the extent of GCF uptake and the perceived importance of eight determinants including environmental, financial, technological, regulatory, and social factors. Findings reveal that GCF adoption remains minimal, with only about 1% of building projects financed through green financial instruments. Environmental factors were identified as the most critical determinant, followed by technological capacity and financial considerations. However, statistical analysis shows no significant correlation between these determinants and actual GCF adoption, highlighting a disconnect between positive stakeholder perceptions and market realities. The Kenyan GCF market is still in an emergent phase, characterized by fragmented frameworks and considerable barriers to finance accessibility and deployment. Despite limited uptake, developers express a strong willingness to recommend green finance, indicating a receptive base for expansion. The study recommends targeted capacity-building, regulatory reforms, and development of tailored financial products to catalyze broader GCF adoption. This research contributes empirical insights into the challenges and opportunities of financing green construction in emerging markets, informing policy and market strategies for sustainable development.
Keywords: Adoption, Determinants, Green Construction Finance, Kenya
Cite this paper: Dorcas Mutheu Musingi, Shadrack Mutungi Simon, The Emerging Landscape of Green Construction Finance in Kenya: Adoption and Determinants, American Journal of Environmental Engineering, Vol. 15 No. 1, 2025, pp. 21-34. doi: 10.5923/j.ajee.20251501.03.
Article Outline
1. Introduction
1.1. Concept of Green Finance
- The debate surrounding green financing is very active currently. ‘Financing green’ and ‘greening finance’ are two other terminologies that are currently being used in reference to this concept. The former refers to the financing of projects that contribute or intend to contribute to the conservation, restoration, and sustainable use of biodiversity and its services to people [1]. Meanwhile, ‘greening finance’ is focused on directing financial flows away from projects with a negative impact on biodiversity and ecosystems, and towards projects that mitigate the negative impact or pursue positive environmental impact as a co-benefit. However, these concepts are two sides of the same coin, and they enable a response to the climatic challenge by providing an opportunity for improved coherence and depth in efforts to achieve restoration of ecosystems [2].
1.2. Defining Green Finance
- There is no precise and commonly agreed-upon definition for green finance. Either most articles on the subject do not attempt to define it, or the definitions provided vary greatly [3]. According to [4], green finance is a broad term that can be used to describe financial investments for sustainable development initiatives, projects, products, and policies. [5] argued that green finance and green investment can be used interchangeably, though the former is wider in scope as it includes operational costs associated with green investments. In the banking sector, green finance can be defined as financial products and services that consider environmental factors during lending decision-making, ex-post monitoring, and risk management processes, provided to encourage ecologically responsible investments and support low-carbon technologies, industries, projects, and businesses [6]. Green finance is that which promotes better environmental and sustainable outcomes, using various financial instruments such as loans, debt structures, and different investments [7]. Simply put, green finance is an investment or loan that promotes environmentally positive activities, such as the purchase of ecologically friendly goods and services or the construction of green infrastructure [8], [9]. From the foregoing, green finance could be described as having three components; (i) the financing of private and public green investments, (ii) the financing of public policies that encourage the implementation of environmentally conscious projects and initiatives, and (iii) components of the financial system that deal specifically with green investments, including their specific legal, economic, and institutional framework conditions.
1.3. Rationale for Green Finance
- Climate change has emerged as the predominant political and economic issue of this century and is expected to stay so in the foreseeable future. Governments, businesses, investors, and private individuals worldwide are initiating steps and measures to address the climate crisis, with a particular focus on implementing decarbonization techniques [9]. Transitioning to a low-carbon or green economy requires significant amounts of fresh capital investment, notably in the form of green financing [8]. Such investment would be used to support initiatives that reduce greenhouse gas emissions and assist firms in adapting to the impacts of climate change.Green finance provides both economic and environmental benefits to everybody. It widens access to environmentally-friendly products for individuals and firms, equalizing the shift to a low-carbon society, leading to greater social inclusivity and economic growth [9]. This results in a ‘great green multiplier’ effect whereby both the economy and the environment gain, making it a win-win situation for everyone. Increased demand for green goods leads to the creation of more jobs, leading to more economic activity. This is therefore not only good for the planet, but also the economy.
1.4. Green Construction Project Financing
1.4.1. Global Perspective
- Despite the good accounts of green buildings, the construction research community has yet to holistically develop, investigate, and promote the ideal financing models that align with this innovative building model [10]. The authors further assert that green construction is still funded by traditional project financing models, which are out of touch with the core principles of green building, coupled with numerous regulatory and practical limitations [11]. Moreover, the green building model is still in its developmental stages in many parts of the world, and research on it remains limited, including the identification of suitable financing models such as green finance tailored for green buildings [12]. According to [13], between 2012 and 2021, green financing grew more than 100-fold from $5.4 billion to $540 billion globally. This growth is partly attributed to the growing recognition of various environmental crises, and specifically, the climate crisis. Foreign and domestic private finance is increasingly flowing into green construction globally. In the years between 2017 and 2021, green debt financing had a twentyfold increase, from about $10 billion to a record high of $230 billion [14]. Green bonds accounted for about 70 percent of that financing; however, some emerging debt instruments, such as green sustainability bonds and loans, have been experiencing faster growth. Equity instruments are infrequently used, though Real Estate Investment Trusts (REITs) have the potential to scale the financing of green construction and operations [15]. Other innovative tools of green finance, such as carbon retirement portfolios and transition bonds, are almost non-existent in developing countries [16]. These countries are mostly missing out on these growing flows of private green finance for greening construction. Since 2017, they have issued only 10 percent of the total global green debt financing [17]. However, there is still hope. According to [18], private green debt finance for green construction has been growing faster in Sub-Saharan Africa, even though such finance is still extremely low. About 90 percent of this green construction financing in 2021 globally was channelled to green buildings rather than to “hard-to-abate” construction materials such as cement and steel, which account for approximately 19 percent of global carbon emissions [19]. According to the [20], out of the total private green debt finance for green building issued in developing countries, about 54 percent was issued in the Caribbean and Latin America, followed by the Pacific and East Asia (19 percent), and Central Asia and Europe (12 percent). The Middle East, South Asia, North Africa, and Sub-Saharan Africa together issued only 15 percent [21]. Within Sub-Saharan Africa, South Africa accounts for about 75 percent of this financing [20]. In 2021, green construction project financing registered an unprecedented high of about $27 billion globally, with 70 percent of that going to the decarbonization of construction materials. Steel and cement each received about 50 percent of the total green finance for construction materials, with the share of steel growing more rapidly since 2019 [14]. Green loans are the most preferred instruments for financing the decarbonization of construction materials, representing about 86 percent of total financing; however, green bond issuance increased sevenfold between 2019–2021.208 [19].
1.4.2. Kenyan Perspective
- Kenya’s green building market development has progressed steadily. The certified green building market was 3 percent of new buildings in 2020 [22]. Most of these certified buildings were offices and high-income housing. As of 2020, there were several Real Estate Investment Trusts (REITs), but the market did not record any green building construction loans or mortgage products. Although the government has a green economy strategy, the implementation and impact of these green building targets on market development are yet to be seen [22]. In Kenya, sources of green finance are primarily external grants and loans from international public institutions; however, the national government also disburses billions of shillings from its revenue to climate and green-related projects [23]. Analysis of national budget data shows that for the fiscal years 2017/18 and 2019/20, the government disbursed KShs 414.23 ($3.19) billion and KShs 427.24 ($3.29) billion, respectively, to climate change sectors. On average, 40% of these funds were raised domestically, and 60% came from international sources. Out of these funds, the actual investment in green projects was KShs 103 ($0.79) billion in 2017/2018 and KShs 120 ($0.92) billion in 2018/2019. The extent of private sector contributions to green finance is not exactly known but is conservatively estimated at an average of KShs 100 ($0.77) billion per year. Out of this investment, it is estimated that KShs 30 ($0.23) billion is sourced domestically and KShs 70 ($0.54) billion is from international organizations. Acorn Holding Limited was the first private entity to benefit from the green bond issue in 2019, where it was able to raise KShs. 4.3 billion ($40.5 million) to construct and develop affordable, environmentally friendly student hostels [24]. The Qwetu Hostels are built using climate-resilient designs, are green and resource-efficient, and adhere to the EDGE requirements. The IFC, in collaboration with International Housing Solutions (IHS), established the IHS Green Housing Fund, whose aim is to provide financial support to investors of green affordable houses [24]. The houses must meet the IFC’s EDGE standards, which advocate for the efficient use of energy, water, and construction materials. The fund seeks to invest in 5,000 newly developed, green, affordable properties with an initial focus on Nairobi County and other selected counties in Kenya.
1.5. Challenges Facing Green Construction Finance Adoption
- The low levels of foreign and domestic private capital for green construction in developing countries could be partly explained by market failures within green finance and construction value chains [14]. These failures are often more prominent and widespread in low-income countries. For example, the fragmented structure of the construction industry, the presence of informational imbalances between the segments of the industry and policymakers, extremely localized regulations, and the prevalence of small and medium-sized construction companies hinder finance for green construction [16]. Financial decisions mostly involve multiple stakeholders such as developers and owners, investors, construction professionals, and materials producers, with conflicting interests. Further, in the absence of green codes, regulations, and standards, investors face difficulty in identifying investment opportunities in green construction [25]. Small and medium-sized developers, particularly in economies characterized by high levels of informality, also face financial constraints for green construction. Additionally, the lack of skilled workers in green construction techniques further constrains the potential for investments in green construction [20].Green construction alternatives may also appear to be more expensive than they ought to be due to the current market prices failing to reflect the social costs imposed by emissions from conventional construction methods and materials, thereby reducing expected returns for green construction projects [26]. Consumers and investors may be reluctant or unable to pay an initial extra cost of 1 to 5 percent for green buildings compared to traditional ones, especially in affordable housing intended for lower-income households. This is even more challenging in low-income countries that have a few commercially viable green construction investments [17]. Further, the lack of comprehensive data on default rates and the monetary benefits of green construction investment portfolios also plays a role in reduced investment in green construction [25]. Financial markets also tend to underprice climate risk, which includes issues such as economic losses resulting from climate hazards [27]. For instance, residential property values frequently fail to consider the risks of extreme climatic events, even in cases when such information is public [28]. This increases the capital costs for green buildings relative to traditional alternatives. This problem can be more severe in developing countries, geographically exposed to frequent catastrophic disasters and lack well-structured financial and insurance markets [20].Private investors may encounter high costs associated with measuring and monitoring environmental performance in green construction projects, especially in “hard-to-abate” materials such as cement and steel [29]. These costs are usually high in developing economies due to lower transparency, inadequate governance and disclosure standards, weaker regulations, and insufficient technical capabilities for the issuance and regulation of green financial instruments [30]. Developing countries may also face constraints in supply. There is often a limited number of viable green construction projects to finance in these markets [31]. This could be attributed to the absence of innovation, lack of economies of scale, limited green technical capacity for implementation, and limited concessional finance resources [32]. Regulatory, currency, macroeconomic, and political risks, coupled with volatility, can also increase costs, hence reducing the profitability of green construction investments [33].
2. Methodology
2.1. Research Design
- This research adopted the survey research design. This entails the collection of quantitative or quantifiable data on more than one case, and at a single point in time, in connection with two or more variables, which are then examined to detect patterns of association, among other relationships [34]. Once the target population had been identified, an appropriate sample was drawn for data collection. Once the extent of adoption of GCF and its determinants had been established based on the sample, a generalization was made about the entire population.
2.2. Target Population and Sampling Procedures
- The target population included architects and developers. The research first surveyed registered architects in Kenya. This is because, in Kenyan practice, the architect is, in most cases, the lead consultant and is engaged by the client early on. Further, the architect is a present figure in all registered construction projects in Kenya. Given that the number of registered developers was expected to be small, the inclusion of architects enabled access to a much wider sample for the researcher to accurately determine the extent of GCF uptake. The architect was required to provide data regarding the green construction projects he/she has been involved in, including details of the developers. According to the online register published by the Board of Registration of Architects and Quantity Surveyors of Kenya (BORAQS), the number of registered Architects as of March 16th, 2025, was 1,321 [35]. For the first survey, a sample size of 307 Architects was calculated using the following formula developed by [36].
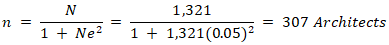 Where; n = sample size N = total population (1,321 architects) e = margin of error (0.05) The sample was selected from the target population using simple random sampling. This was achieved by reproducing the register as it appears on the BORAQS website and then numbering it from 1 to 1,321. A random number generator was then used to select the 307 architects. The Lead Architect or the next available architect from each of these selected firms was relied upon as the respondent for the survey. The sample size for the second phase of the study was the number of green-financed construction projects identified during the first phase. The second survey involved developers. According to the online register published by the Kenya Property Developers Association (KPDA), the number of registered developers as of March 12th 2025 was 69 [37]. Due to the small population, the sample in this survey was based on a census of the 69 Registered Developer Firms. This number was also adjusted based on the suggestions of individual private developers suggested by Architects in the first survey.
2.3. Data Collection
- Data were collected in two phases. In the first phase, questionnaires were administered to the established sample of 307 Architects. This survey aimed to evaluate the overall extent of the adoption of green finance in construction projects in Kenya. The Architects were required to provide the number of green-financed construction projects they had been involved with in their portfolio within a span of five years. The second survey involved the administration of another questionnaire to the registered developers. This survey went further to determine the specific GCF instruments adopted.
2.4. Data Analysis
- Statistical Package for Social Scientists (SPSS v.25) was used to analyze quantitative data. At the initial stages, descriptive statistics were used to describe and understand the underlying features of the dataset. The overall extent of GCF uptake was calculated as a percentage of the green-financed construction projects within the portfolio of the participating architects. The extent of uptake of various GCF tools and instruments was calculated based on the responses provided by the developers.
3. Findings
- In the first survey, out of a total of 307 Architects, 163 responded, representing a response rate of 53.1%. This rate is moderate, representing just over half of the targeted Architect population. The relatively low response rate could be attributed to professional demands and survey fatigue, limiting participation. In the second survey, out of a total of 72 Developers, 55 responded, representing a response rate of 76.4%, which was deemed adequate. The results from these respondents have been presented and discussed as follows.
3.1. Demographic Data
3.1.1. Experience in the Construction Industry
- Figure 1 presents the professional working experience of the Architects involved in the first phase of data collection. The work experience profile of the Architect respondents is well-balanced but leans toward those in mid-career stages. A majority of Architects (73.6%) reported between 6 and 20 years of professional experience, with the largest cohort being those with 11–15 years (28.2%), followed by those with 6–10 years (25.8%) and 16–20 years (19.6%). Early-career architects (1–5 years) accounted for 15.3% of the sample, while those with greater than 20 years of experience (21–25 years and above 30 years) collectively accounted for 11.1%. The data indicates that the sample is predominantly composed of mid-career professionals who are likely to have accumulated substantial practical experience, project exposures, and industry awareness, which could influence their perceptions towards adopting innovative financing mechanisms such as GCF. Such informed and nuanced perspectives help bolster the reliability of the study findings.
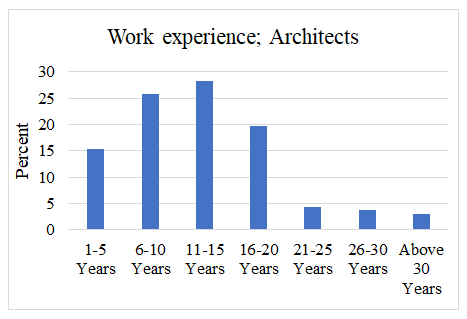 | Figure 1. Architects’ Professional Experience (Fieldwork, 2025) |
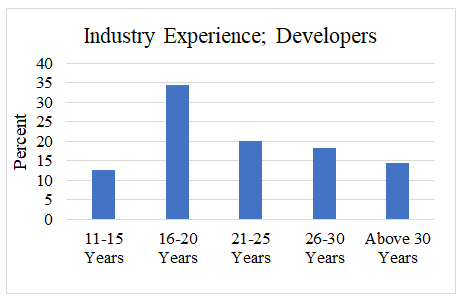 | Figure 2. Developer Firms’ Professional Experience (Fieldwork, 2025) |
3.1.2. Type of Projects
- In the first survey, Architect respondents were asked about the types of construction projects they primarily specialize in. They were given the option of selecting multiple choices. The responses shown in Figure 3 indicate a diversity of specialization areas, with the distribution as follows. Residential projects accounted for the largest share, with 31.6% of responses. Mixed-use developments followed closely at 27.9%. Commercial projects constituted 16.9%. Offices made up 14.0% of the specializations. The remaining categories included Institutional (5.5%) and Industrial projects (4.0%). The predominance of residential and mixed-use development specializations among Architects suggests that these types of projects form the core focus of Kenya’s construction industry professionals engaged in this study.
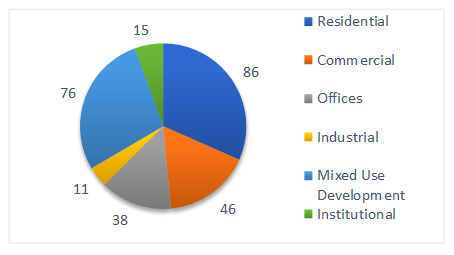 | Figure 3. Type of Projects being handled by Architects (Fieldwork, 2025) |
3.1.3. Number of Projects Undertaken
- In the first survey, Architects were asked to report the total number of construction projects they had undertaken in the last five years. The responses, shown in Figure 4, indicate a distribution of project experience across the sample. A small portion (2.5%) completed up to 5 projects. Approximately 8.7% (n=14) handled between 6-10 projects. Those managing 11-15 projects constituted about 13.7% (n=22). Architects who completed 16-20 projects accounted for 14.3% (n=23). The largest groups were those with 21-25 projects (20.5%), 26-30 projects (19.9%), and above 30 projects (20.5%), respectively. Two respondents (1.2%) did not respond to this question. Approximately, a total of 3,488 projects were handled by the 161 Architects in a span of five years, representing a mean of 21.7 projects per Architect. This means that on average, an Architect handles 4.3 projects in a single year. The data highlights a respondent group with substantial hands-on experience. This enhances the validity of findings related to GCF uptake and suggests that the framework developed will resonate well with industry realities. Moreover, the total number of projects was useful in estimating the extent of GCF adoption in later sections.
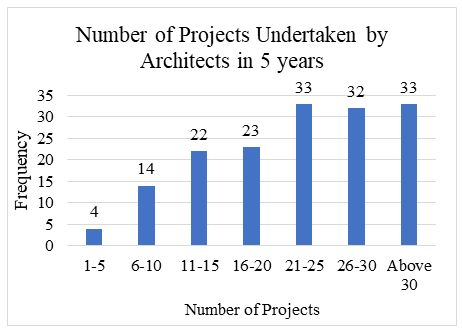 | Figure 4. Total Number of Projects Undertaken by Architects (Fieldwork, 2025) |
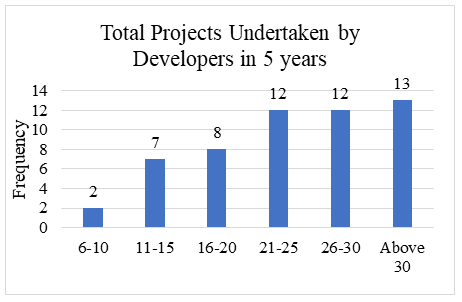 | Figure 5. Total Number of Projects Undertaken by Developers (Fieldwork, 2025) |
3.1.4. Number of Projects Undertaken
- Architect respondents were asked to indicate the total number of building projects with green certification they had undertaken in the last five years. The results presented in Figure 6 showed that 63.8% (n=104) of architects had not undertaken any green-certified projects, 33.1% (n=54) had completed one such project, and only 2.5% (n=4) had undertaken two certified projects within that timeframe.
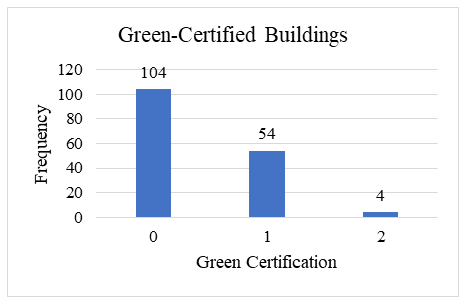 | Figure 6. Total Number of Green-Certified Projects Undertaken by Architects (Fieldwork, 2025) |
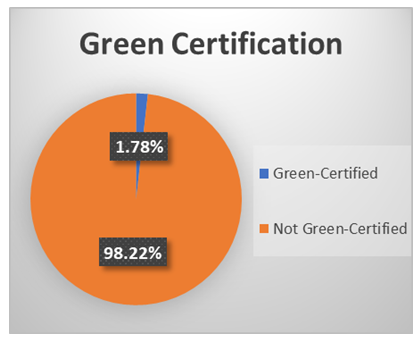 | Figure 7. Proportion of Green Certified Building Projects Undertaken by Architects (Fieldwork, 2025) |
3.2. Adoption of Green Construction Finance in Kenya
3.2.1. Number of Green Financed Construction Projects
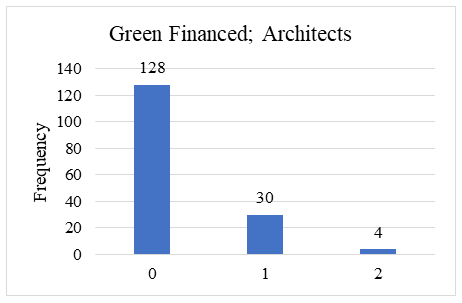
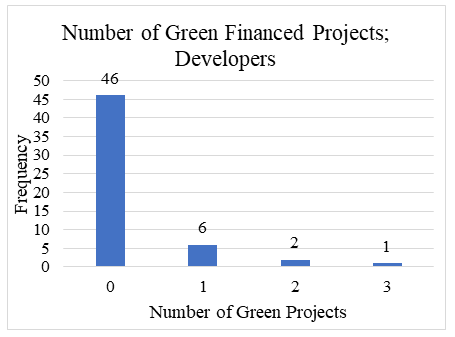
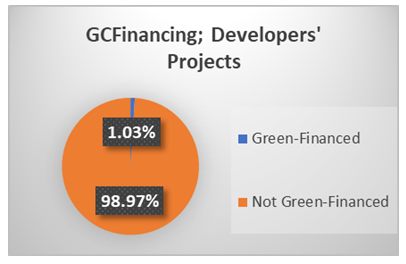
- In this section, Architects and Developers were asked to indicate the total number of building projects that had been green-financed in the last five years. The Architects’ results presented in Figure 8 showed that 79.0% (n=128) of architects had not undertaken any green-financed projects, 18.5% (n=54) had completed one such project, and only 2.5% (n=4) had undertaken two green-financed projects within that timeframe. Therefore, in total, the respondents had undertaken 38 green-financed building projects in the last five years. It is evident from these findings that an overwhelming majority of developers have not been involved in green-financed projects. As shown in Figure 9, the number of green-certified buildings as a proportion of the total number of projects (n=3,488) undertaken by Architects is 1.09%.
 | Figure 8. Total Number of Green-Financed Projects Undertaken by Architects (Fieldwork, 2025) |
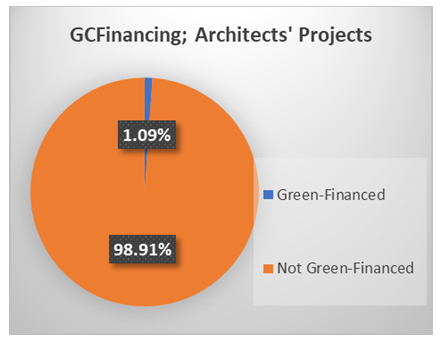 | Figure 9. Proportion of Green Financed Building Projects Undertaken by Architects (Fieldwork, 2025) |
 | Figure 10. Total Number of Green-Financed Projects Undertaken by Developers (Fieldwork, 2025) |
 | Figure 11. Proportion of Green Financed Building Projects Undertaken by Developers (Fieldwork, 2025) |
3.2.2. Perceptions on the Overall Adoption of GCF in Kenya
- Architects and Developers were asked to rate the overall adoption of green finance in construction projects in Kenya. A 7-point Likert scale was used to measure these perceptions. The results ranged between very low and slightly below average, as presented in Figure 12. No responses were recorded in moderate, slightly above average, high, and very high. 72.2% (n=156) of the respondents rated the uptake of GCF in Kenya as very low, while 19.0% (n=41) and 8.8% (n=19) rated it as low and slightly below average, respectively. The mean rating of these responses was established to be 1.4, indicating a very low adoption rate of GCF. Even though subjective, this finding supports the earlier calculated uptake of 1.06% based on the number of GFCPs as a proportion of the total number of projects undertaken by architects and developers.
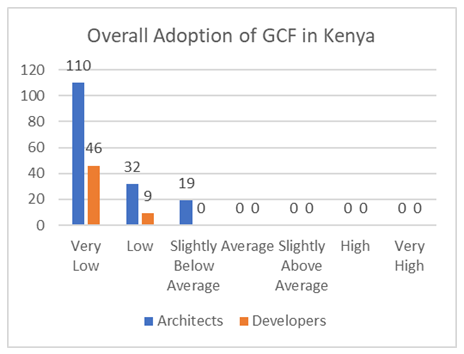 | Figure 12. Overall Adoption of GCF in Kenya (Perception) (Fieldwork, 2025) |
3.2.3. Likelihood of Recommending Adoption of GCF to other Developers
- Developers were asked to rate the likelihood that they would recommend green financing options to others in the construction industry using a 7-point Likert scale from "extremely unlikely" to "extremely likely." In contrast to the results reported on the extent of GCF uptake, the obtained responses demonstrated overwhelmingly positive sentiment toward recommending green finance. With only a single (1.8%) respondent indicating neutral, all the others (98.2%) selected between likely and extremely likely, as shown in Figure 13.
 | Figure 13. Likelihood of Recommending Adoption of GCF (Fieldwork, 2025) |
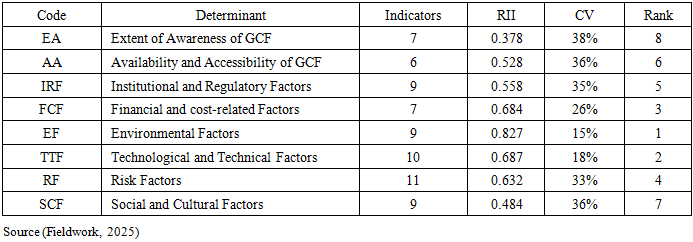
3.3. Determinants of GCF Uptake in Kenya
- This study considered eight (8) determinants of GCF uptake in Kenya. The descriptive analysis of the results has been presented in the following Table 1.
|
3.4. Bivariate Relationships Among GCF Adoption and Its Determinants
- Kendall's tau_b correlation coefficients were used to measure the strength and direction of association between pairs of variables. The results have been presented in two sections, one for the effect of the determinants on the adoption of GCF, and the other on the interrelationships among the determinants.
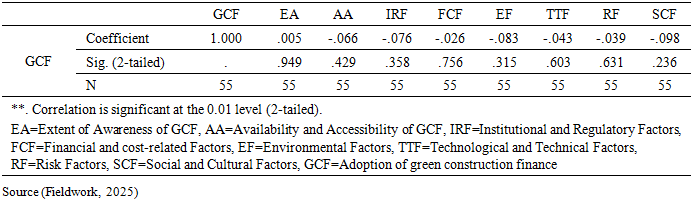
3.4.1. Correlation with GCF Adoption
- The most critical row is "GCF," which shows its relationship with each of the eight determinant variables. All eight independent variables (EA, AA, IRF, FCF, EF, TTF, RF, SCF) show extremely weak, and in most cases, negative correlations with "GCF." The correlation coefficients presented on Table 2 range from -0.098 (for SCF) to 0.005 (for EA). Crucially, none of these correlations are statistically significant (p-values > 0.05). The p-values for all correlations are high, ranging from 0.236 to 0.949, indicating that there is no statistically significant relationship between any of the proposed determinants and the adoption of GCF in Kenya.
|
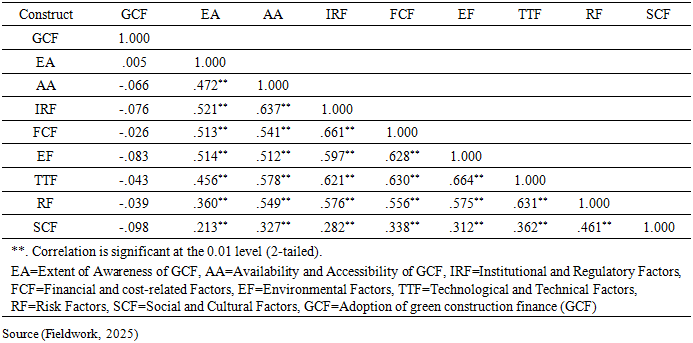
3.4.2. Correlations Among Determinants
- Based on the bivariate correlation analysis in Table 3, the interrelationships among the determinants of green construction finance are a critical finding that warrants a deeper look. While the previous analysis focused on the weak relationship between these determinants and GCF adoption itself, the correlations among the determinants offer significant insights into the nature of the green finance market in Kenya. The correlation matrix reveals a striking pattern: the proposed determinants of GCF are not independent of one another; rather, they are highly and significantly correlated. This is evident from the Kendall's tau_b coefficients among the independent variables, almost all of which are statistically significant at the 0.01 level.
|
4. Strategic Implications
- The survey results provide a clear picture of the perceived landscape of GCF uptake in Kenya, characterized by both strong consensus on primary drivers and significant variability on perceived barriers. Though the early adopters of GCF are evidently rare, they're significant, and their experiences may help drive broader market acceptance. The presence of even a few green-financed projects indicates that market structures, however limited, do exist and can be leveraged with further support. Early adopters can showcase feasibility and help reduce perceived risk among peer firms, supporting the “demonstration effect” described in adoption literature. To enhance uptake, concerted efforts are needed to address informational, financial, and regulatory barriers. These findings have several implications. First, there is a need for capacity building. The high proportion of developers with no experience in green finance underscores the need for targeted awareness, capacity-building, and technical support. Second, the government needs to develop policy incentives. To catalyze wider adoption, policies such as concessional interest rates, tax incentives, and streamlined certification processes may be necessary, as suggested in the literature [10], [24], [55]. Third, the findings reinforce the importance of scaling up and promoting accessible green financial products, tailored to the needs and capabilities of local developers.There is a need to focus on drivers, not just awareness. The low RII for Awareness (EA) suggests that policies and interventions should shift focus from general awareness campaigns to addressing the higher-ranked determinants. Developers already know they should go green (high RII for EF), but they need practical solutions for how to go green. Environment, Technology, and Finance emerge as the critical trio. The top three determinants, Environmental Factors, Technological Factors, and Financial/Cost-related Factors, form a critical and interconnected cluster. To boost GCF uptake, efforts must simultaneously: (i) Reinforce environmental policy through solidifying and simplify green building compliance (addressing EF Rank 1), (ii) Develop Technical Capacity through investing in training and technology transfer (addressing TTF Rank 2), (iii) Improve Financial Viability by providing strong financial incentives, such as tax breaks or lower interest rates, to mitigate the perceived high costs (addressing FCF Rank 3). Variability in Accessibility emerges as a major issue. The high CV for Availability and Accessibility (AA) is a key takeaway. This indicates that while GCF might exist in Kenya, the application processes, eligibility criteria, and ease of access are inconsistent. Efforts to standardize and streamline GCF product offerings across financial institutions could help reduce this high variability and uncertainty for developers. Lastly, there is the issue of regulatory review. Institutional and Regulatory Factors (Rank 5), while not in the top three, are still moderately important. Regulators should review existing policies to ensure they do not unintentionally create bottlenecks, focusing on clear, predictable, and supportive regulatory frameworks for green construction. A statistical correlation was impossible to find because GCF adoption clustered at one end of the scale, while the determinants spread out across the middle. The data points did not move together, so the analysis correctly reports no significant relationship. This is an empirical fact, regardless of whether the theoretical relationship is expected to exist. This paradox, that the determinants are "conceptually correct" but empirically disconnected from adoption, is a key finding of the study. It means that the theoretical model, while logically sound, does not accurately represent the reality of a nascent, undeveloped market. That is, positive perceptions are not equivalent to action. The high scores for the determinants (e.g., awareness, availability) indicate a high level of readiness in the market. Stakeholders may be highly aware of the benefits of green construction finance and believe that some access and policy frameworks are in place. However, this readiness has not yet been converted into action (adoption). The relationships between institutional and regulatory factors (IRF), financial and cost-related factors (FCF), and risk factors (RF) are particularly strong. For instance, the correlation between IRF and FCF is 0.661, and between IRF and RF is 0.576. This suggests that a lack of clear institutional and regulatory frameworks is strongly associated with increased financial costs and higher perceived risks for stakeholders. In a developing market, the absence of a stable policy environment directly translates into investment uncertainty and a reluctance to commit capital.There is a notable correlation between environmental factors (EF) and technological and technical factors (TTF), with a coefficient of 0.664. This indicates that environmental concerns are tightly linked to the availability of technological solutions. In the context of green construction, a push for environmental sustainability often requires the adoption of new, often unproven, technologies, suggesting that the two are perceived as a single challenge.The extent of awareness (EA) of GCF also shows a strong correlation with almost every other determinant, including AA (0.472), IRF (0.521), FCF (0.513), and TTF (0.456). This implies that as awareness of green finance increases, so does the perception and understanding of the other related factors. This finding is particularly interesting, as it supports the idea of a comprehensive understanding of the market, where awareness is not just about a single concept but about the entire ecosystem of barriers and opportunities.
5. Conclusions
- The paper concludes that the adoption of Green Construction Finance (GCF) in Kenya's construction sector is extremely low, with an average uptake rate of about 1.06% of projects. Despite a relatively high level of awareness and readiness among stakeholders, actual implementation remains limited. The most critical determinants influencing GCF adoption are environmental factors, technological and technical capacity, and financial and cost-related factors. However, these determinants show no statistically significant correlation with actual GCF uptake, indicating a gap between perception and action. This suggests that the Kenyan green finance market for construction is still nascent and fragmented, with structural, financial, and regulatory challenges hindering greater adoption. Strong interrelationships among determinants point to a complex barrier ecosystem rather than isolated obstacles. The findings also reveal that early adopters of GCF exhibit positive attitudes, offering a foundation for broader market penetration. The government, financial institutions, and developers must collaborate to create enabling environments and address bottlenecks to accelerate GCF uptake.
6. Recommendations
- The paper makes the following recommendations, indicating the respective actors responsible for each action regarding GCF adoption in Kenya:• Government: Strengthen and enforce clear, supportive regulatory frameworks and policies that incentivize GCF adoption, including tax incentives, concessional interest rates, streamlined green certification processes, and the establishment of enabling institutional mechanisms.• Financial Institutions: Develop, scale up, and diversify accessible green financing products tailored to the specific needs and financial capacities of local developers, ensuring transparency and ease of application. Embed green screening criteria in loan underwriting and create internal verification mechanisms aligned with green finance standards.• Developers and Industry Associations: Engage proactively in capacity-building initiatives to enhance technical knowledge and practical skills necessary for the design, development, and implementation of green construction projects. Leverage positive experiences to promote peer-to-peer advocacy and expand adoption.• Development Finance Institutions (DFIs) and Donor Agencies: Provide risk mitigation tools, credit guarantees, financial backing, and technical assistance to de-risk green construction investments and build developer confidence in green financing options.• Technical Service Providers and Training Institutions: Deliver specialized training and advisory services focused on green building technologies, environmental compliance, and financial viability to strengthen the technical and technological capacity of construction professionals.• Civil Society and Green Finance Advocates: Promote awareness campaigns focused on practical benefits and successful case studies of GCF, addressing misconceptions about complexity and cost, and fostering a green finance culture within the construction industry and among consumers.• Public-Private Partnerships: Facilitate collaborations between government agencies, financial institutions, developers, and technical experts to create integrated platforms that support the development, financing, and monitoring of green construction projects.
ACKNOWLEDGEMENTS
- The author hereby acknowledges and takes full responsibility for any errors contained in this research article.