-
Paper Information
- Paper Submission
-
Journal Information
- About This Journal
- Editorial Board
- Current Issue
- Archive
- Author Guidelines
- Contact Us
American Journal of Environmental Engineering
p-ISSN: 2166-4633 e-ISSN: 2166-465X
2024; 14(1): 21-29
doi:10.5923/j.ajee.20241401.02
Received: Aug. 23, 2024; Accepted: Sep. 10, 2024; Published: Sep. 11, 2024

Evaluating Flood Risk Vulnerability in Bangladesh's Old Brahmaputra River Basin Through Hydro-Morphometric Analysis
 Abstract
 Reference
 Full-Text PDF
 Full-text HTML
S. M. Druvo Rahman1, Sayed Abul Monsur Anachh1, Shams-Al-Hannan1, Md. Abul Kalam Tutul1, Rituparna Sarker2
1Department of Civil Engineering, Mymensingh Engineering College, Mymensingh, Bangladesh
2Department of Civil Engineering, Daffodil International University, Dhaka, Bangladesh
Correspondence to: Sayed Abul Monsur Anachh, Department of Civil Engineering, Mymensingh Engineering College, Mymensingh, Bangladesh.
| Email: |  |
Copyright © 2024 The Author(s). Published by Scientific & Academic Publishing.
This work is licensed under the Creative Commons Attribution International License (CC BY).
http://creativecommons.org/licenses/by/4.0/

Understanding flood vulnerability is crucial for identifying and mitigating high-risk regions. This research employs hydro-morphometric modeling to assess flood risk within the Old Brahmaputra River Basin, Bangladesh. Utilizing GIS-based techniques, the study evaluates flood vulnerability through advanced spatial analysis, focusing on six key parameters: river basin characteristics, flow direction, stream length, stream order, stream density, and drainage density. The analysis applies Horton’s and Strahler’s methods to assess drainage and stream densities, revealing that higher channel densities correlate with increased flood susceptibility. The basin is segmented into 5 sub-basins (namely A, B, C, D and E), with stream densities of 0.40 km2, 0.36 km2, 0.37 km², 0.34 km2, and 0.38 km² and drainage densities of 0.71 km-1, 0.66 km-1, 0.69 km-1, 0.61 km-1, and 0.63 km-1, respectively. Thus, identifying sub-basin A as the most flood-prone due to its dense stream network. Conversely, sub-basins B and D exhibit lower flood risks. The study highlights substantial impacts on 2,355.34 km2 of agricultural land and 1,295 km2 of built-up areas, particularly in the northeastern region. This research underscores the importance of hydro-morphometric modeling in flood risk management, offering a valuable framework for long-term planning and early warning systems. The findings contribute significantly to the understanding of flood hazards and provide a practical approach for flood risk identification and mitigation.
Keywords: Hydro-morphometric modelling, Old Brahmaputra River Basin, Stream density, Stream order, Geographic information system (GIS), Flood hazard vulnerability, Flooding
Cite this paper: S. M. Druvo Rahman, Sayed Abul Monsur Anachh, Shams-Al-Hannan, Md. Abul Kalam Tutul, Rituparna Sarker, Evaluating Flood Risk Vulnerability in Bangladesh's Old Brahmaputra River Basin Through Hydro-Morphometric Analysis, American Journal of Environmental Engineering, Vol. 14 No. 1, 2024, pp. 21-29. doi: 10.5923/j.ajee.20241401.02.
Article Outline
1. Introduction
- Bangladesh, a country in South Asia, is one of the most vulnerable countries in this region, as it is perpetually confronted with flooding [1]. This country also has around 6.67% of total water bodies within its 1,47,570 km2 area [2]. This vulnerability is the result of a combination of factors, including a high population density, pervasive poverty, a geographical location in a flood-prone region, and a heavy reliance on sectors that are susceptible to flooding [3] [4]. The danger for flood is mostly divided into 3 categories: Severe River Flooding, Moderate River Flooding, and Low River Flooding.Maps that compare the relative levels of food hazards in the region are used to illustrate these categories [5]. The Ganges-Padma, Brahmaputra-Jamuna, and Meghna River basins are subject to floods during the monsoon season, which is characterized by intense rainfall [6]. Bangladesh, despite occupying only a minor portion of the basins' catchment area, is responsible for draining 92% of the water into the Bay of Bengal [1], [7]. This surplus of water threatens agricultural security by disrupting lives and livelihoods.Bangladesh has experienced numerous catastrophic cyclones since gaining independence. In 1984, 1987, 1988, 2004, and 2007, there were particularly destructive events [8]. Despite the fact that the 1988 deluge inundated 61% of the landmass, 2-6.5k person dying, millions were displaced, and significant economic losses were incurred, the event remains etched in the nation's memory [8], [9]. Floods are a persistent hazard, as evidenced by the two significant events that occurred in 2017: an early flash flood in the Haor region and a monsoon season flood that affected the northern regions of the country [10]. Consequently, floods are the most severe and frequent natural hazard that affects Bangladesh, with more than 20 million individuals living in flood susceptible areas [11]. The geological makeup, heavy monsoon rainfall, river sedimentation, and geographic location of the Old Brahmaputra River Basin render it particularly vulnerable. This river starts from left banked side of the Brahmaputra on the north of Bahadurabad [12]. Owning a general south-east direction this is flows more or less parallel to this river and passing Jamalpur and Mymensingh and drops into the Meghna River at Bhairab-Bazar [13]. Sometimes they are part of Brahmaputra and lower Ganges channels as seen from some maps made centuries earlier. James Rennell was one of the men who created the most accurate map way back 1760 [14] [15]. Planning from this map it is identified that the course of the Brahmaputra was a little towards east of the Madhupur tract; which is referred today as the Old Brahmaputra. A part of the channel of Brahmaputra River below Dhaka shifted to the river and then curving towards Mymensingh loop was silted up and thus the old Brahmaputra shifted its course of flow to Shitalakshya and lastly to the Megna. The Old Brahmaputra adopted its present course between the Madhupur Tract and the Barind tract in 1787. During the same year, the river shifted its course and was called Jamuna. This shift occurred after a significant flood that occurred in the same year. This in the classical pattern that could be attributed to several factors including the severe earthquake reported from Mymensingh area in 1782 [15].Indigenous coping mechanisms have been developed by communities over generations, despite the hazards. Furthermore, government and non-governmental organizations exert themselves ceaselessly to provide assistance to flood-affected communities [9], [16]. The goal is to reduce the repercussions of prospective flood events, expedite response efforts, and provide timely alerts [5], [16], [17]. A more effective method of managing flood hazards and risks in the historic Brahmaputra River Basin is to employ hydro-morphometric modeling, flood hazard zoning, and flood risk assessment.
2. Materials and Methods
2.1. Study Area
- This study concentrates on the Old Brahmaputra River Basin in Bangladesh as a target area for rapid flood mapping and potential damage evaluation. The basin encompasses a significant portion of the country, including key districts such as Gazipur, Mymensingh, Netrokona, Kishoreganj, Sherpur, Jamalpur, Tangail, Brahmanbaria, Narsingdi and. Our study area focuses on Gazipur, Kishorganj, Mymensingh, and Narshingdi. For this study, we have selected catchment areas including Gazipur, Kishoreganj, Mymensingh, and Narshingdi (Figure 1). To accurately depict the terrain, a Digital Elevation Model (DEM) was generated using satellite imagery from the USGS, revealing elevations ranging from -25 m to 46 m (Figure 2).
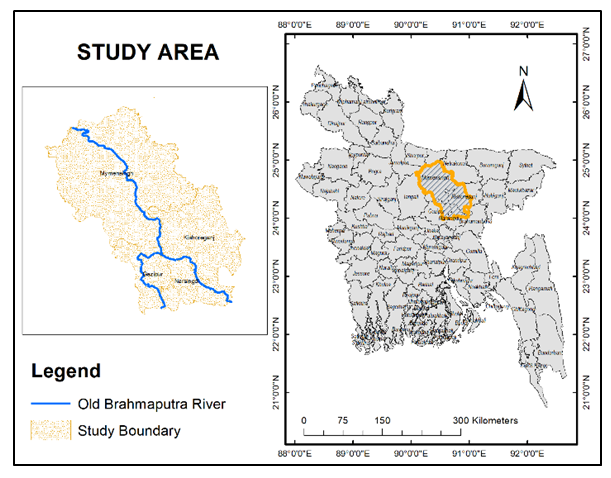 | Figure 1. Study area with main river channel |
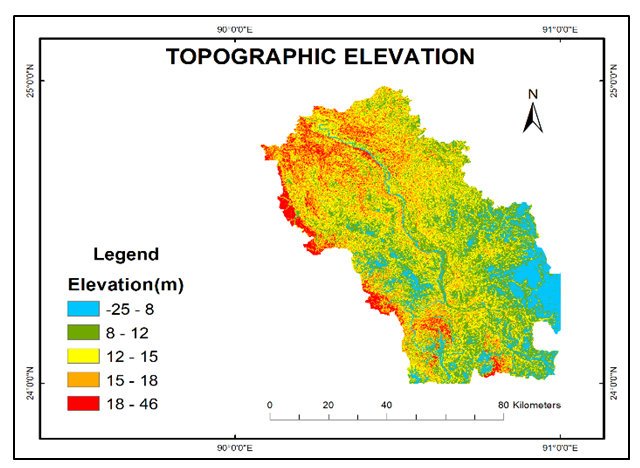 | Figure 2. Topographic Elevation of the studied river basin |
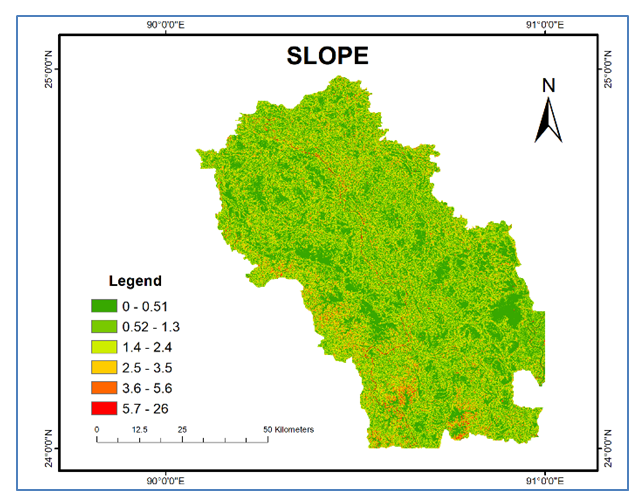 | Figure 3. Slope of the proposed study area |
2.2. Methodology
- Regarding sources of data to conduct this study, the USGS (United States Geological Survey) used a composite satellite image (DEM) to assess the stream channels and flood frequencies in the Old Brahmaputra River basin. The streams are arranged employing a stream ordering methodology in GIS setting, proposed by Strahler [25]. An analysis of flood depth grids was also made using the spatial analyst tools particularly hydrological model tools were utilized. The outcome of the study was therefore undertaking of a flood zoning map which integrated flood zoning data obtained from the WDBB. Downloading satellite image data (Landsat TM) from the USGS was essential in establishing the capacity of this community to the food vulnerability in this river basin. These analyses allowed one to detect pre-to-medium vulnerability levels among the sector, component, and resource types. Sophisticated techniques and equipment were employed to classify the land use and land cover to determine the degree of vulnerability of the community to flood. For this study, out of several fundamental parameters including drainage density, soil type, TWI, river network density, LU/LC, distance, main priority has been given on drainage density, LU/LC. Using the ArcGIS software, the "line density" function was utilized to calculate and visualize the density of the drainage network in kilometers per square kilometer. Understanding the behavior of water in different types of formations is crucial in managing the risk of flooding. A permeable formation plays a vital role in facilitating the absorption of precipitation, helping to mitigate the potential for flooding. The elements of hydrological processes, such as infiltration, surface runoff, evaporation, and evapo-transpiration, are affected by the parameters of Land Use/Land Cover dynamics. The factors that most strongly influence flooding in a particular area are land use and land cover dynamics, elevation, and slope, which has been employed in this article. Understanding the principles of physics can help comprehend how forest and vegetation cover can enhance infiltration and reduce the depth of runoff, thus mitigating the risk of floods.While analyzing the ability of vegetation to act as barrier useful for reduction of runoff and moderation of floods, the most effective tool is the normalized differential vegetation index (NDVI). Large population is gradually encroaching on the agricultural and grassland region which absorbs the flood water naturally. These are new dynamics that call for new dynamics in managing floods in urban regions.
2.3. Stream Channel
- The stream network in the research area is then derived using geoprocessing methods. According to Strahler (1957), the technique yields a grid of stream networks and offers stream classification as its output. Source locations are often known as upstream and the point, where one tributary channel joins with other is said to be downstream or node [25]. While interior connections create link between two nodes or link between node and out, exterior connections are segments which connect source and node. Typically, every link in the stream possesses a different length and different contributing area. The length is measured along its downstream direction, and the contributing area includes all the area that drains through the link. IT streams are designed as network segments that contain connected, continuous links, which are in the same order.
2.4. Stream Order
- In order to analyze and expedite the drainage basin, stream orders are needed to be determined. This spatial positioning approaches were originally designed by geo- morphologists to know the location of a stream in the branching channel system and not the stream ordering based on its size. For this study, Strahler's stream ordering system has been employed. “Strahler order, the most generally used ordering method, defines streams without tributaries as first-order; streams with ≥ 2 first order tributaries as second-order; streams with ≥ 2 second order tributaries as third order, and so on.” [25], [26]
2.5. Stream Length
- This From the Horton law, this research determined the stream length (Lu) of the Old Brahmaputra basin. As stream length is one of the most vital hydro mauri to assess vulnerability to flood hazard, since it measures the river basin’s surface runoff. Chorley 1995 citing Horton pointed out that in a river basin the stream length is most important in the first order and reduces in the subsequent orders [27]. The number and length of the streams in a stream order may be identified with the help of GIS analysis in hydrologic conditions.
2.6. Stream and Drainage Density
- Calculating flood risk involves considering two main factors: drainage and stream density. This study investigated the susceptibility of floods in the Old Brahmaputra River basin by utilizing Horton's drainage and stream density model. According to Al-Hurban, these models operate on the assumption that a region's vulnerability to flooding decreases as the density of its drainage systems along with streams increases. In other words, a basin in which stream density and drainage are high is more susceptible to flooding. To calculate the drainage density, GIS tools and techniques are used to estimate the length of the stream and then divided the total area of the basin by the length of the stream. However, the stream density is obtained through a process of counting the number of streams and then dividing it by the surface area of the basin.
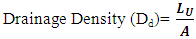 | (1) |
 | (2) |
3. Results and Discussion
3.1. Hydro-Morphometric Modelling for Flood Vulnerability
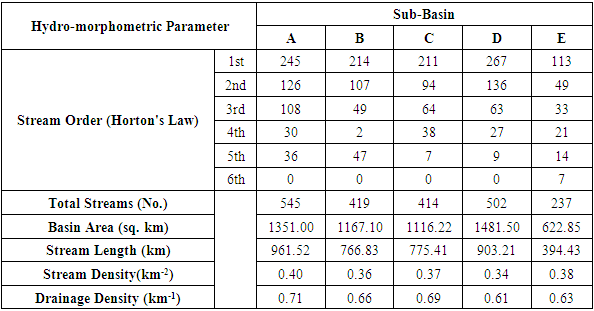
- Based on Horton's analysis, the stream density and drainage density of a basin provide valuable information of its runoff and discharge patterns. It has been observed that basins with high stream density and drainage density are more susceptible to flooding. The Brahmaputra River Basin is divided into 5 sub-basins, A, B, C, D, and E (Figure 4). The stream density of these sub-basins is 0.40 km-2, 0.36 km-2, 0.37 km-2, 0.34 km-2, and 0.38 km-2 respectively. The drainage density of the basins is 0.71 km-1, 0.66 km-1, 0.69 km-1, 0.61 km-1, and 0.63 km-1 respectively (Figure 5) and (Table 1). Out of the 5 sub-basins in this river basin, sub-basin A has a high stream, and drainage density, making it closer to flooding. On the other hand, sub-basin C is less susceptible to flooding due to its low stream. and low drainage density.
|
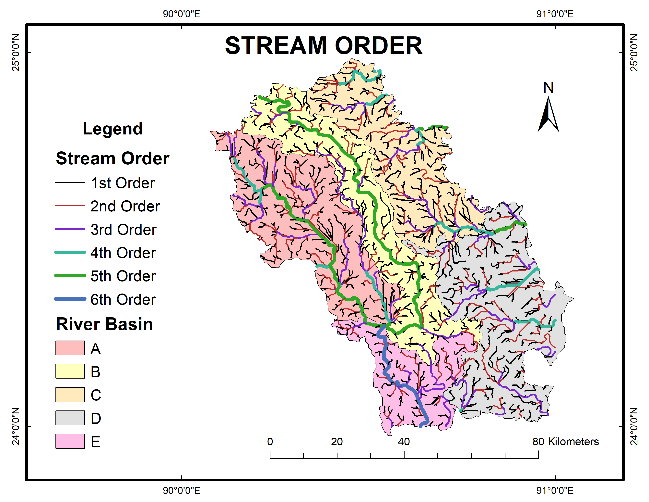 | Figure 4. Stream Order with basin and sub-basin distribution on the catchment area |
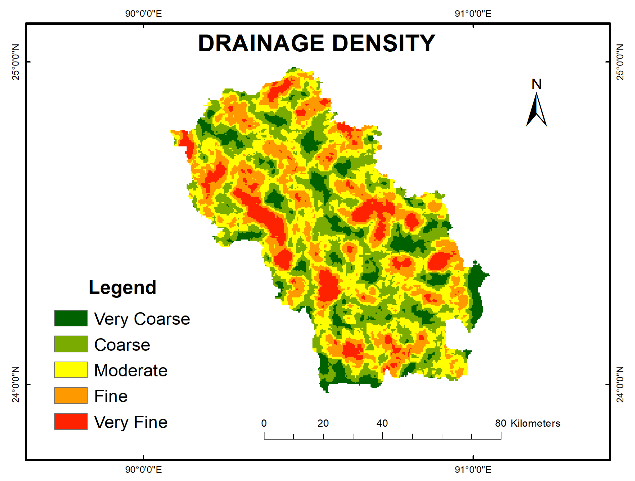 | Figure 5. Drainage density on the catchment area |
3.2. Community Flood Vulnerability of Old Brahmaputra River Basin
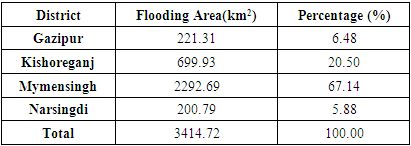
- In this river basin, the total area that has been impacted by floods is 3414.43 km2. The several regions that fall within this category, including Gazipur (221.11 km2), Kishoreganj (699.93 km2), Mymensingh (2292.69 km2), and Narsingdi (200.79 km2). More than 65% of the land in Mymensingh is vulnerable to flooding, which is a substantial proportion compared to the other districts that were examined in this river basin (Table 2).
|
3.3. Vulnerability to River Basin Resources
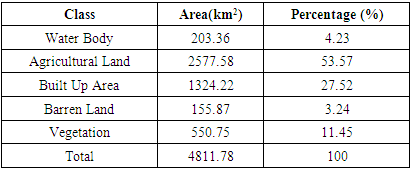
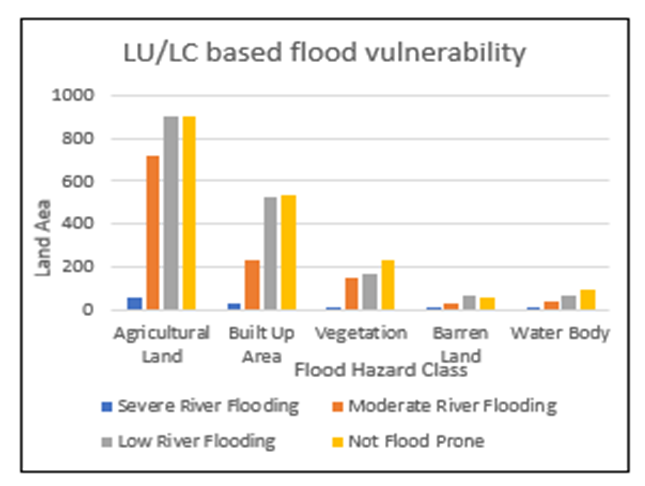
- According to the classification of the Old Brahmaputra River Basin’s land use and land cover, the land is sub-divided into 5 major categories: Agricultural land, Barren land, Built-up area, Vegetation, and Water bodies. Agricultural land refers to areas primarily used for farming. This includes land for growing crops, raising livestock, and cultivating fruits and other plants. Barren land refers to areas with little or no vegetation. This includes land that is exposed rock, sand, or clay, as well as areas with very sparse or no plant cover. Built-up area represents the extent of urbanization and development by human-made structures. This includes areas occupied by residential, commercial, industrial, and transportation infrastructure. Essentially, it represents the extent of urbanization and development. Vegetation areas are covered by plant life. This can range from dense forests to grasslands, wetlands, and even sparse vegetation like shrubs. And, lastly water bodies represent the areas covered by water, such as rivers, lakes, oceans, and reservoirs.The cumulative inundated region analyzed in this study is approximately 4900 km2. According to Table 3 and Figure 6, nearly 54% of this area is designated as agricultural land, encompassing over 2577.58 km2. Following this, urbanized zones represent about 28% of the total area, translating to slightly more than 1324 km2, where significant urban development is primarily concentrated in metropolitan areas. Additionally, the area classified as vegetation occupies 550.75 km2, constituting 11.44% of the overall expanse. Barren lands account for 155.87 km2, or 3.24%, while aquatic ecosystems are represented by 203.36 km2, corresponding to 4.23% of the total area.
|
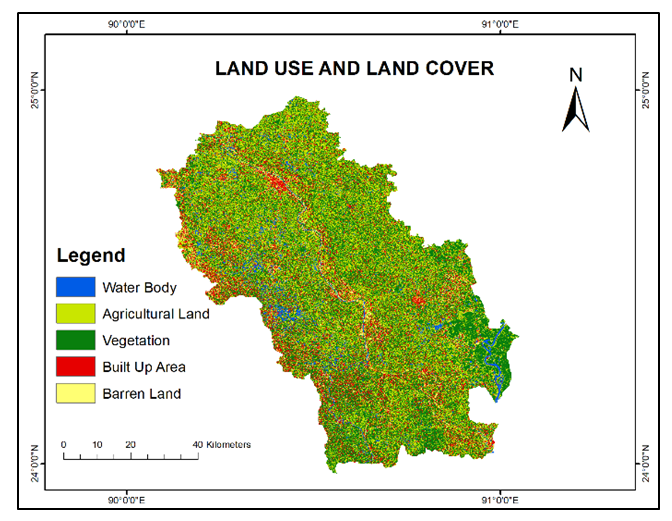 | Figure 6. Land use and Land cover data on the catchment area |
|
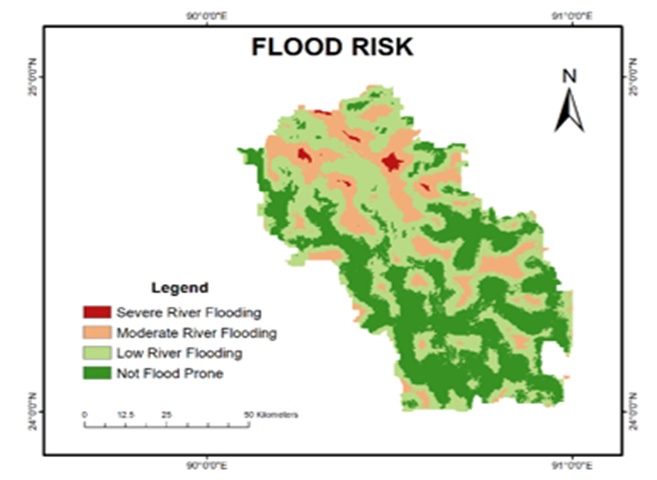 | Figure 7. Flood Risk on the catchment area |
 | Figure 8. Land User and Land Cover Data Table |
|
3.4. Comparative Study of Flood History of the Old Brahmaputra River Basin
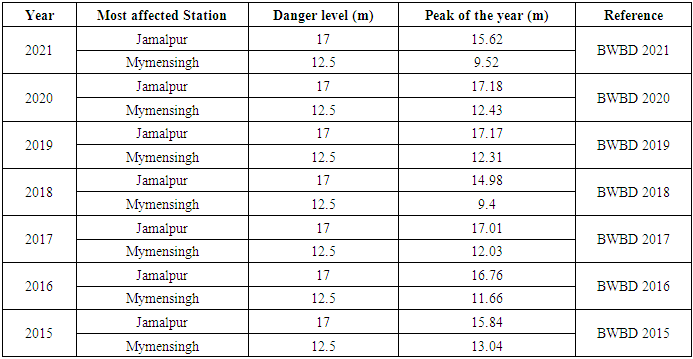
- According to Flood Forecasting and Warning Centre (FFWC) under the Bangladesh Water Development Board (BWDB)’s annual food 2021, “Out of 30 Water Level (WL) monitoring stations in Brahmaputra basin, at 16 stations, river WL crossed their respective Danger Levels (DL). As a result, low-lying areas of Kurigram, Nilphamari, Bogra, Serajgonj, Manikganj, Jamalpur and Tangail districts were mostly flooded for short to medium duration” [28]. Similarly, in 2020, “Out of 31 stations, 25 stations crossed their respective Danger Levels (DLs). Thus caused a severe flood situation in July which lasted up to 63 days at low lying places such as Kurigram, Lalmonirhat, Nilphamari, Rangpur, Gaibandha, Bogra, Sirajganj, Natore, Pabna, Jamalpur, Tangail, Manikganj, Dhaka and Narayanganj” [29]. Also in 2019, “Out of 30 monitoring stations, 16 stations crossed their respective Danger Levels (DL). During this period, low-lying areas of Kurigram, Lalmonirhat, Nilphamari, Gaibandha, Bogra, Sirajganj, Jamalpur, Tangail and Manikganj districts were mostly flooded” [30]. These data show the whole Brahmaputra basin but our study area focuses on Old Brahmaputra, which passes by Jamalpur and Mymensingh towns and falls into the Meghna river at Bhairab Bazar. Detailed of the data ranging from 2015 to 2021 is given in the data Table 6 below [29], [31], [32], [33], [34], [35], [36], [37].
|
3.5. Discussion
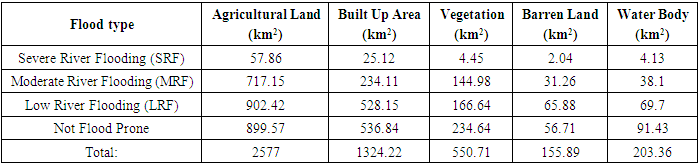
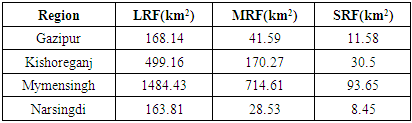
- This study aims to provide more understanding about the method of food risk assessment particularly in the Old Brahmaputra River Basin employing integrative method and GIS. The following vulnerability factors were identified by the re-search; land use, slope, and elevation of the river. The north-eastern portion of the Old Brahmaputra basin-area is in the highest vulnerability stage, thereby leaving it at a higher risk than the easter portion, which is influenced by its elevation and the number of high-order streams that take a lot of water.The zoning of flood risk indicates that Mymensingh exhibits the highest risk for Low River Flooding (LRF), with an area of 1484.43 km2, while Narshindi presents the lowest risk at 163.81 km2. This pattern remains consistent across Moderate River Flooding (MRF) and Severe River Flooding (SRF), with Mymensingh again showing the highest risks at 714.61 km2 and 93.65 km2 respectively, whereas Narshindi retains the lowest risk in these categories, with 28.53 km2 for MRF and 8.45 km2 for SRF. The findings highlight that the agricultural lands and resources within the Old Brahmaputra River Basin are particularly sensitive to flooding, representing a significant risk to local communities. This sensitivity poses the potential for substantial economic losses, emphasizing the urgent need for an early mitigation action plan to address these vulnerabilities. If left unaddressed, the costs associated with such a plan may escalate dramatically. The application of Horton’s and Strahler’s methods for assessing drainage and stream densities reveals a direct correlation between higher channel densities and increased flood susceptibility. The basin is divided into five sub-basins (A, B, C, D, and E), with respective stream densities of 0.40 km2, 0.36 km2, 0.37 km2, 0.34 km2, and 0.38 km2, and drainage densities of 0.71 km-1, 0.66 km-1, 0.69 km-1, 0.61 km-1, and 0.63 km-1. Notably, sub-basin A is identified as the most flood-prone due to its dense stream network, while sub-basins B and D exhibit comparatively lower flood risks. This research emphasizes the critical role of hydro-morphometric modeling in flood risk management, providing a robust framework for long-term planning and the development of effective early warning systems. The findings significantly contribute to the understanding of flood hazards and offer practical strategies for flood risk identification and mitigation.
4. Conclusions
- The analysis of the drainage network within the Old Brahmaputra River Basin reveals its pronounced susceptibility to flooding, attributable to both its geotectonic formation and low-lying elevation. The region experiences frequent flash floods due to intense rainfall and is subjected to seasonal flooding on an annual basis. The flood zoning analysis indicates that the northeastern portion of the basin is at an elevated risk compared to other areas. This heightened vulnerability is primarily due to the presence of multiple high-order streams that convey substantial volumes of water, coupled with topographical disparities across the region. The findings underscore that the inhabitants of the Old Brahmaputra River Basin face a greater degree of flood risk than previously anticipated. This research of land use classifications reveals that vegetative and agricultural areas occupy a larger expanse than urban settlements. However, this does not necessarily confer safety upon those residing in these regions. In fact, individuals living in densely populated locales adjacent to water bodies may face increased hazards due to the scarcity of higher ground in their vicinity. Despite their awareness of the inherent risks associated with natural disasters, many residents choose to remain in their cherished communities, as relocation is often not a feasible option. Their prolonged engagement with the local environment has enabled them to derive valuable insights and develop adaptive strategies for anticipating and mitigating potential threats. This deep-rooted understanding of their surroundings allows them to leverage their local knowledge in the face of adversity.