E. C. Merem 1, Y. A. Twumasi 2, S. Fageir 3, D. Olagbegi 1, J. Wesley 1, R. Coney 1, Y. Babalola 1, T. Thomas 1, A. Hines 4, G. Hirse 4, G. S. Ochai 5, E. Nwagboso 6, M. Crisler 1, S. Leggett 7, J. Offiah 1, S. Emeakpor 8
1Department of Urban and Regional Planning, Jackson State University, 101 Capitol Center, Jackson, MS, USA
2Department of Urban Forestry and Natural Resources, Southern University, Baton Rouge, LA, USA
3Department of Social Sciences, Alcorn State University, 1000 ASU Drive, Lorman, MS, USA
4Department of Public Policy and Administration, Jackson State University, 101 Capitol Center, Jackson, MS, USA
5African Development Bank, AfDB, 101 BP 1387 Avenue Joseph Anoma, Abidjan, AB 1, Ivory Coast
6Department of Political Science, Jackson State University, 1400 John R. Lynch Street, Jackson, MS, USA
7Department of Behavioral and Environmental Health, Jackson State University, 350 Woodrow Wilson, Jackson, MS, USA
8Department of Environmental Science, Jackson State University, 1400 John R. Lynch Street, Jackson, MS, USA
Correspondence to: E. C. Merem , Department of Urban and Regional Planning, Jackson State University, 101 Capitol Center, Jackson, MS, USA.
| Email: |  |
Copyright © 2024 The Author(s). Published by Scientific & Academic Publishing.
This work is licensed under the Creative Commons Attribution International License (CC BY).
http://creativecommons.org/licenses/by/4.0/

Abstract
The US Midwest region known for its web of lakes, rivers and vast swaths of farmland ranks high as the nation’s food basket. Being a huge agricultural hub tied to global markets, the region’s immediate influence spans across multiplicity of states supported by a flourishing supply chain network sustained by farming centers and activities in and outside of the Midwest. Notwithstanding the region’s place as an active farm hub, it is slowly emerging as an epicenter of changing climatic hazards with the manifestations evident in different forms over the years. With many of the risks and recurrent changes now a common trend among various states. The impacts come under varying forms including impairment to the environment through damage to property, elevated and falling temperatures as well as displacement of people. In as much as several efforts have been made by agencies in the zone to remedy the situation. The changing climate in the Midwest does not occur in isolation, as most of that are attributed to socio-economic, physical, environmental and policy elements located within the larger ecological system. Even at that, very little has been done in the literature to assess the changing climate situation in the study area using a mix scale model anchored in GIS and descriptive environmental statistics. Accordingly, this enquiry will fill that void in research by assessing climate change hazards in the Midwest using mix scale techniques and secondary data with emphasis on the issues, trends, impacts, factors, and efforts. In applying these tools, results show widespread surge in changing climatic impacts with exposures to severe risks in the surrounding ecology of the states. Furthermore, spatial mappings of change using GIS pinpointed the gradual diffusion of risks on clusters of areas deemed epicenters of disasters along heavily impacted spots over time, due to a set of factors from socio-economic and physical variables. To address the risks, the paper offered solutions in the form of education, enactment of effective policies, the design of regional climate risks info systems and the installation of advanced early warning devices to alert the communities while ensuring public safety.
Keywords:
Climate change, Hazards, Region, Mid-west, GIS, Impacts and Factors
Cite this paper: E. C. Merem , Y. A. Twumasi , S. Fageir , D. Olagbegi , J. Wesley , R. Coney , Y. Babalola , T. Thomas , A. Hines , G. Hirse , G. S. Ochai , E. Nwagboso , M. Crisler , S. Leggett , J. Offiah , S. Emeakpor , Evaluating Climate Change Hazards within the US Midwest Zone, American Journal of Environmental Engineering, Vol. 14 No. 1, 2024, pp. 1-20. doi: 10.5923/j.ajee.20241401.01.
1. Introduction
The US Midwest region, known for its web of lakes, rivers and vast swaths of farmland ranks high as the nation’s food basket [1]. Being a huge agricultural hub with access to global markets, the region’s immediate influence spans across a multiplicity of states supported by a flourishing supply chain network sustained by farming centers and activities in and outside of the Midwest. In as much as the zone also boasts of farms and energy-intense industrial operations, the Midwest accounts for about 63-%65% of U.S. output in corn and soybeans [2]. Further along those lines, and in the context of farming and climate risks. The uppermost side of the region’s commercial hub remains in the forefront of commodity farm trading in daily operations. This stems from the presence therein of some of the most highly active corn and soybean production fields globally. In that light, the agricultural sector in the region consists of over 520,000 farms estimated at $135.6 billion annually during the fiscal year 2012 [1]. Although, both crop and cattle production are vital catalysts upon which the fortunes of several countryside towns rely on to flourish. In such settings, the welfare and output of the farm industry is inseparably connected with the shifting climate situations in the zone. Notwithstanding the region’s place as an active farm hub, it is slowly emerging as an epicenter of changing climatic hazards with the manifestations evident in different forms over the years [3-7]. The gravity of the risks which transcends the upper, lower, and central parts of the Midwest region, involves the threats of periodic heat waves, extreme drought, heavy rainfalls, recurrent flooding, destruction of farmland and shifting temperature. With much of the risks and recurrent changes now a common trend among various states from Nebraska, Missouri, Iowa, Wisconsin, Michigan to Ohio. The population concentration in cities threatened by shifting climate could impose additional strains on residents and the ecosystem through widespread air contamination, urban heat island impacts, an extremely irregular water cycle, and recurrent vulnerability to unknown pests and illnesses. Moreso, many of the towns have obsolete infrastructure and are very susceptible to climate change linked flooding and deadly heat waves [8-12]. In all these, the rise in severe rainfalls has led to the flow of raw sewer because of overload in storm water in circulation [4]. Seeing how Lake Michigan flood water engulfed 2 Chicago area beaches and forced the closure of others in 2019 and more deemed recurrent. The Midwest has exposures to very cold air fronts from the north, while the humidity out of the Gulf of Mexico is leading to wide-ranging mix of intense heat and rainfall excesses [5-2]. Given the surge in warm air, and average temperatures in the past decades, the average temperature has risen by more than 1.5°F since 1900 -2010 [13-20]. Against this background, climate situations characteristic of the Midwest right now has not only been trending on the shifting side in obvious directions. The standard temperatures have fluctuated with increases, especially during the wintertime by an absence of cold fronts in some periods. Worthy of note in the zone is that ice coverage on surface water and streams been accumulating towards the end of winter, and then vanishing prior to the spring season. At the same time, the spring’s cold front continues its upward move at a much sooner pace during the year than expected, thereby extending the farming time by around 7 days more in the 20th century. In the process, the frequency of extreme precipitation incidents has roughly doubled in the same period. This is accelerating the dangers of rainstorms among the states as manifested in key rivers comprising of Illinois, Iowa, and Missouri. In all these, the current shifts in the region’s climate reflect the anticipated projections from the surge in Green House Gas (GHGs) presence in the sky. Surely, global temperatures and those of the Midwest are expected to heat up more in the foreseeable years, as human induced discharge of GHGs intensifies [21-26].The impacts come under varying forms including damage to both the built and natural environment through damages to property, the collapse of dams, elevated and falling temperature, melting and reductions in ice buildup as well as displacement of people. In as much as several efforts have been put into place by agencies in the zone to remedy the situation. The same changing climate threatening the communities in the zone can always accelerate the impending uncertainties to the detriment of cities. As a result, heavy downpour across the zone can move additional farm residues into the Great lakes. This unleashes enormous algae blooms a major form of nutrition for the Asian carp. At the same time, Lake Michigan’s surface temperature has also risen so much over the last several years, that the belief now is that, should that pattern ensue, this will increase the areas conducive to carp habitat and enable them to flourish for much of the year [27-31,20]. The extent of changing climate in the Midwest does not occur in isolation as most of that are attributed to socio-economic, physical, environmental and policy elements located within the larger ecological system [32-36]. Even at that, very little has been done in the literature to assess the changing climate situation in the study area using a mix scale model anchored in GIS and descriptive environmental statistics [37-41]. Accordingly, this enquiry will fill that void in research by assessing climate change hazards in the Midwest using mix scale techniques and secondary data with emphasis on the issues, trends, impacts, factors, and efforts. From the study, five principal objectives driving the enquiry exist. The first aim consists of the use of geo-spatial tech to analyze the status of climate issues and changes, whereas the second aim offers a support tool for policy makers. Along those lines, the third goal stresses the design of a new method for delineating climate change index. The fourth objective is to create a framework for regional ecological impact analysis with mix scale techniques, while the fifth objective is to assess climate risk trends. The set of 3 guiding research questions germane to the enquiry are as follows. Have there been changes in the regional climate and what were the effects? How were they manifested over time and space? What efforts were put into place as remedy? Against that background, the study covers 5 sections consisting of introduction, methods, results, discussions, and conclusion.
2. Methods and Materials
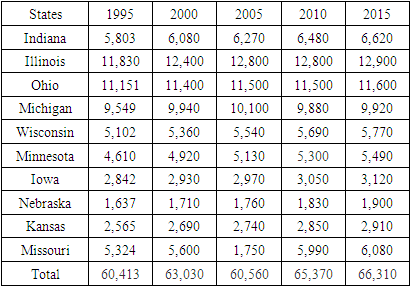
The study area contains the 11 states consisting of Illinois, Indiana, Iowa, Kansas, Michigan, Minnesota, Missouri, Nebraska, Ohio, and Wisconsin in the farm belt zone of the US (Fig. 1). While the area has a population of over 67 million and it is located along the Mid America side in the Great Lakes region. The zone stretches through 945,800.81 square miles area from Northern Missouri to Southern Ohio (Table 1) [42-44]. Being in the Great Lakes zone that holds one third of the Globe’s surface freshwater assets essential to the provision of drinking water to over 42 million citizens [45]. The water assets remain critical to wildlife ecosystem and the sustenance of regional economy of distribution, exchange, and consumption under different spheres of human activity. The region’s 4,530 miles of U.S. shoreline on the Great Lakes, as America’s inland coast and its longest, provides major life support for local tourism, recreation, and industry in a manner that continues to make them attractive destinations for many, given the liveable appeal [46]. All these assets are now threatened by shifting climate amidst the pace of torrential rainfalls and the mounting risks from the emission of Green House Gases. Table 1. The Population of the Study Area 1995-2015
 |
| |
|
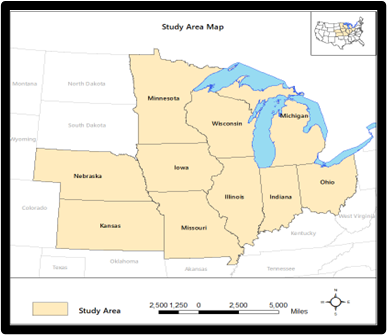 | Figure 1. The Study Area Midwest Region |
The study area is called “Heartland” for many reasons. Being the nation’s hub for farm service, production, and hauling operations. The zone consists of colourful towns, compact woodlands, and numerous streams and waters. Certainly, the Midwest stands out among the some of the most commercially valuable zones of the US. However, shifting climate uncertainty places that capacity at a greater danger. Although the zone has shown same familiarity pertaining to the volatility of unexpected inclement climate events, the intensities which are projected to emerge through global warming, seem to be at a completely unfamiliar scale for the zone’s industries, citizens, and total fiscal welfare.With the expansion of the Mid-western metro areas in the face of rapid urbanization and recurrent surge in farmland use. The carbon footprints from such development threatens the region’s ecosystem stability. In as much as, the use of water in the buoyant farm sector and others in the economy continues unabated while climate change intensifies. The intersection between the food basket of the nation and the changing climate cannot be overlooked. Unsurprisingly, the effects of recurrent stressors from development activities and the risks on freshwater resources and climate change has now accelerated the call for climatic change assessment. The fact that the study area used 400,000 Mlgd daily from 1995-2015. The basis for more water access based on the region’s hydrology within regional aquifers, is now being gradually eroded by the threats of drought intensity, because of the warming of the temperature over time [46]. The same can be said of the shifting patterns in snow accumulations peculiar to cold environments like the Midwest as well.Overall, the Midwest climate situations are mostly influenced by the zone’s spot on the map, being the middle point along the continent of North America. For that, the settings are as well shaped by the flat surface landscape, engraved by the glaciers that shielded the zone by thousands of years in the past ice Age. Out of the reach of regulating impacts of the oceans, the region’s climate settings have the capacity to shift notably during the span of 12 months period. From there, abrupt shifts in climate, huge day-to-day temperature varieties, and erratic rainfall forms embody entirely the components of the region’s climate meteorological conditions. In the process, the Midwest usually has four separate seasons, though the periods are very erratic and yearly variations seems big sometimes. During the winter period, the non-existence of considerable mountain as buffers towards the northmost axis, enables the penetration of chilly air fronts coming through the Arctic to circulate southbound into the zone.Against that background, the study area Midwest has been undergoing changes in accordance with pressures from human induced rise in temperature at global proportions. In the process, the mean temperatures are at elevated levels coupled with a drop in snow and ice cover [48-51], extending farming period, and growing recurrence in inclement precipitation patterns. Many of these changes are destined to persist in the coming years based on the extent and form contingent on the future Green House Gas emissions together with sensitivity on the world’s climatic structure to anthropogenic emissions. Being an ecozone besieged by the rising demand, the declines in water tables and visible fluctuations in aquifers and climatic uncertainty therein, could eventually soar. Seeing all that, surely, regional analysis of the trends in climate change in the study area, has major upsides that are very vital in the search for mitigation using the mix scale model [52-57].
2.1. Methods Used
The paper uses a mix scale approach involving descriptive statistics and secondary data connected to GIS to analyze the growing occurrence of climate change and the attendant issues, the vulnerability, and the impacts of shifting patterns in climate. The focus is on some selected states of the US Mid-Western region. They consist of the Corn Belt zone of Nebraska -Kansas to the Michigan and Ohio axis in the industrial heartland. The spatial information for the study was obtained through numerous organizations consisting of the United States Geological Survey (USGS), the United States Department of Agriculture (USDA), The US Food and Drugs Administration (FDA), the United States Department of Interior, United States General Accounting Office (GAO), and the National Hydropower Association, the World Meteorological Organization and The US Conference of Mayors.Additional geospatial data came through the National Oceanic Atmospheric Administration (NOAA), Archives of the states in the Midwest and the Great Lakes. In addition to that, the US Census Bureau, the Midwest Online Interactive maps, and Acc Weather Inc, The World Health Organization, Nature Conservancy, Water rights group, Midwest Environmental Advocates, US Environmental Protection Agency, (EPA), The US Natural Resources Conservation Services, the Hoosier Environmental Council, the Board of Commissioners of Lucas County, the Midwestern Governors Association, and the Ohio River Valley Water Sanitation Commission (ORSANCO), did also offer other information as required in the enquiry. Basically, much of the climate change related variables made up of domestic, public supplies, agricultural, thermoelectric and industry withdrawals pertinent to the zone collectively, and the individual states, emerged from the repositories of the Midwest authorities, the USGS Water sciences centres, and Earth Justice.On the one hand, the Delta Institute, the other entities at the USGS, Encyclopedia Britannica Inc, NASA, the Upper Midwest Environmental Sciences Center, The Great Lakes Climate Adaptation Network, and the Wisconsin Initiative on Climate Impacts, United States Department of Energy, The City of Chicago, The American Red Cross, City of Cedar Falls, and The US Energy Information Administration, provided additional secondary data on the numbers, hydrological profile, quantities, trends, deficits in water budget and the categories as well as watershed sustainability matters with regards to shifting climate. On the other, the Iowa Department of Natural Resources (DNR), the Federal Emergency Management Agency (FEMA), NOAA’s National Water Center, Natural Resources Defense Council, the Minnesota Pollution Control Agency, Minnesota Power, Xcel Energy, Otta Tail Power and the Government Accountability Office (GAO), and the National crop Insurance services offered vital data to complement the time series data and other valuable information on hydrological and climate change parameters on such indicators as Green House Gas Emissions, the costs of crop damages due to drought and other climate related info highlighting the region. For additional data needs, given that regional and state, county and federal geographic identifier codes of the states were used to geo-code the info contained in the data sets. This information was processed and analyzed with basic descriptive statistics, and GIS with attention paid to the temporal-spatial trends at the state and regional levels in the US Midwestern region and the Great Lakes eco zone. The relevant procedures consist of the two stages listed below.
2.2. Stage 1: Identification of Variables, Data Gathering and Study Design
The initial step in this research consists of the identification of variables required to analyse the extent of climate change, occurrence and impacts as manifested in the behaviour and shifts at the state, county, and regional levels from 1963, 1995, 2005, 2010, 2016 to 2023. The elements encompass socio-economic and environmental or physical information including population, population changes and the rates, groundwater and aquifer depletions, water depletion level, drought index and changes in ground water level decline. Added to this are particulate matter (PM), volatile organic compounds (VOCs), and nitrogen oxides (NOx) to other greenhouse gases (GHGs), carbon dioxide, Electric Vehicles (EV), windmills, solar power facilities installed, agricultural land areas, number of farms, land under crops, ice volume and percentage of ice decline.The others consist of total ground water depletion from climate change, temperatures, crop loss and the monetary costs of crop loss. The percentage costs of crop losses observed, change in heavy precipitations, days temperature, cooling degree days, days above 95°F and average temperature, irrigation, livestock, industrial, mining, and thermoelectric power. Added to that are other climate indicators in the form of frost free season, number of floods, CO2 emissions, carbon, rainfall index, drought intensity temperatures, frequency of heat waves, heat index, number of days under heat, percentage distribution of CO2, Green House Gas related emissions among regions in the US and the top 10 CO2 emitters globally and their rankings as well as the number of beaches and beachfront homes submerged. These variables as mentioned earlier, were derived from secondary sources made up of government documents, newsletters, and other documents from NGOs. This process was followed up by the design of data matrices for socioeconomic and land use (environmental) variables covering the census periods from 1963, 2005 to 2010 to 2023. The design of spatial data for the GIS analysis required the delineation of county boundary lines within the study area as well. Since the authorized boundary lines amongst the ten states stayed unchanged, a common geographic identifier code was assigned to each of the area units for analytical coherency.
2.3. Stage 2: Step 2: Data Analysis and GIS Mapping
In the second stage, descriptive statistics and spatial analysis were employed to transform the original socioeconomic and ecological data into relative measures (percentages, ratios, and rates). This process generated the parameters for establishing, the extent of climate change based on the parameters, the variation in heat index, crop loss from drought intensity, the percentage of ice volumes, and the ordinal rankings among variables. The other dimensions that were generated embody the percentage of $ losses in the farm sector, monetary equivalent of crop losses, ice percentage, ice declines and the percent of areas covered as well as the populations served, the crop damage costings from droughts and the trends across the Mid-western region for each of the ten states through measurements and comparisons overtime. While the spatial units of analysis consist of states, regions, shorelines, and counties and the boundary and locations where inclement weather events escalated glaringly. This framework ensures the identification of change. As the graphics underscore the actual frequency and impacts, climate change induced damages, heat index and ice levels and the intensity of CO2 emissions and the trends coupled with the environmental and monetary costs of damages.The remaining steps involve spatial analysis and output (maps-tables-text) covering the study period, using Arc GIS 11.0 and SPSS 29.0. With spatial units of analysis covered in the 10 states (Figure 1), the study area map indicates boundary limits of the units and their geographic locations. While the outputs for each state were compared across time, the geographic data for the units which covered boundaries, also includes ecological data of land cover files and paper and digital maps from 1995-2023. This process helped show the spatial evolution of location of various levels of climate hazard indicators, stressors, usage, and the trends, the ensuing socio-economic and ecological impacts. Other strengths of the model embody the vivid display of environmental degradation as well as changes in other variables and factors fuelling climate hazards coupled with the impacts in the study area over time and space. Additionally, for more on the full meanings of the acronyms used in the paper, see the Appendix.
3. The Results
This part of the analysis focuses on temporal and spatial analysis of the climate change dangers in the study area. In applying descriptive statistics there is an initial focus on the analysis of rain fall and temperature snapshot, chronicle of key climate events that plagued the zone in nearly four decades. The other sections delve on the pollution audits. This is followed by the remaining portions of the section encompassing of an impact assessment, GIS mappings, and the classification of the factors fuelling changing climate in the US Midwestern region.
3.1. The Regional Emission of Green House Gases and CO2
By the virtue of the trends in the study area, the 2021 distribution of CO2 emissions in the United States along regional lines, puts the Midwest zone as the largest emitter of CO2 in the country. Of the regions listed on the figure, the Midwest stands out as biggest source of CO2 at 26% which is statistically identical as well to the 27% emission values attributed to the Southeast region. In the remaining places, the Southwest as headlined by Texas and Oklahoma alone known for oil and gas fracking, accounted for 15%. As one expected and going by their focus on mitigations, both the US western region and the nation’s Northeast corridor are responsible for 17%-14% respectively (Figure 2).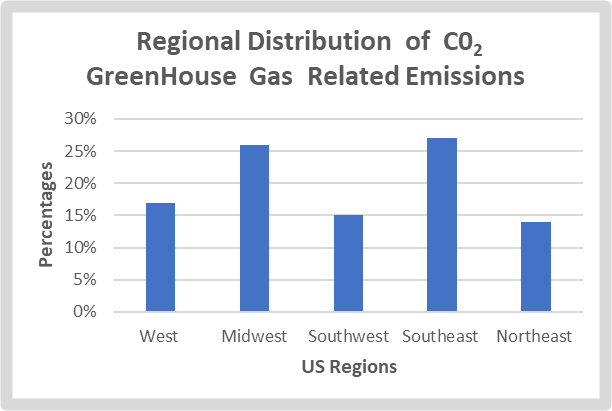 | Figure 2. Regional Distribution of CO2 Emissions in The US |
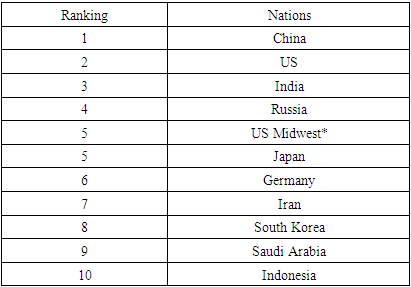
To further see the place of the Midwest region as a big source of CO2 emissions, consider its ranking among the top emitters globally. From the tabular display of the individual nations, aside from the first four spots as occupied by the nations of China, US, India, and Russia, unsurprisingly the Mid-west region held on to the upper spot at number 5 in the ordinal ranking ahead of the countries like Japan, Germany, Iran, South Korea, Saudi Arabia, and Indonesia (Table 2). Looking at improved federal government obligations together with state and city officials opting for clean or green energy and the actualization of climate policies, the citizens are eager to know where the Midwest region stands in the global climate action debate. While the U.S. overwhelmingly accounts by all indicators, the biggest volume of accumulative carbon emissions in the globe and the Midwest region’s emission volumes deemed extremely huge. This implies, the Midwest region has vital function to perform in minimizing the surge in the emissions. In fact, when classified by ordinal ranking as a separate nation, the Midwest seems like the number 5 highest emitter globally. Table 2. The Top 10 CO2 Emitters Globally and Their Rankings
 |
| |
|
Compounding the matter, is that the inhabitants of the Midwest commute a great deal in their automobiles and stack up extra miles moving more through lengthy distances. The pollutants emitted from cars’ exhaust pipes that transcend borders, are quite enormous. This includes particulate matter (PM), volatile organic compounds (VOCs), and nitrogen oxides (NOx) to other greenhouse gases (GHGs) like carbon dioxide. The effect of those GHGs on individuals and public health can be dangerous, and in the case of continual inhalation, the substances are alarming seeing the dangers posed to all demographics from adolescents, the aging populations, and communities at the margin.
3.2. Energy Related CO2 Emissions 2005-2016
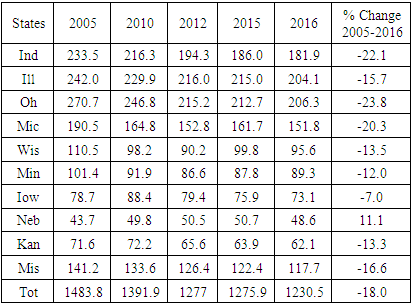
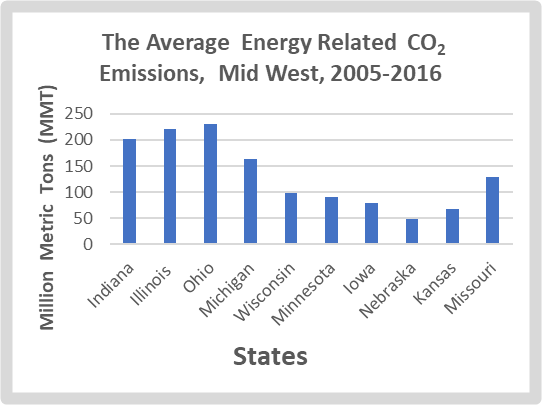
The distribution of energy related carbon emissions for the Midwest region all through 2005-2016 shows the region accumulated an overall total of 6659 MMT at the average of 1333.82 MMT. In the process, the zone began with an opening physical account in 2005 of 1483.8 MMT in emission volumes, the largest of all the years, but only to drop to 1391.9 MMT by 2010. In the ensuing years of 2012, 2015 through 2016, the region’s overall tallies in CO2 averaged 1261.3 MMT, but when disaggregated among individual years, the values ranged from 1277 MMT, 1275.9 MMT to 1230.5 MMT (Table 2.1). At the state levels, the set of three states (Ohio, Illinois, and Indiana) with 218.4 MMT in combined average in the zone deemed as at the higher levels outpaced others, notably in total volumes of energy related CO2 emissions from 2005-2016. In the next group of states made up of Michigan, Wisconsin, Minnesota, and Missouri, their tallies showed, they posted average emission volumes of 164.34 MMT-98.86 MMT and 91.4MMT-128.26 MMT. Of the lower cadre of states, Iowa, Nebraska, and Kansas finished at much lower levels of 79.1MMT, 48.66 to 67.08 MMT below their neighbors in the region (Figure 2.1). Aside from a mix of double-digit declines in emissions from 2005-2016 and a single digit drop of -7.0% in Iowa, only Nebraska saw an increase of 11.1% (Table 2.1). Table 2.1. The Emissions of Energy Related CO2 2005-2016 In million metric tons MMT
 |
| |
|
 | Figure 2.1. The Average Energy Related CO2 2005-2016 |
3.2.1. Mid Century Temperature Variations in the Zone
Drawing from the context of 2016 information regarding projected mid-century temperature variations in the zone, minus Nebraska, and Kansas in the western part of the region. Three benchmarks consisting of average, the number of days over 95°F, frost free season and cooling degree days are worthy of note. Starting with average temperature benchmark in some states in the upper parts of the region. 3 states (Minnesota, Wisconsin, Michigan) saw conditions estimated at a scale of 4.7-5.0°F in differences in temperature. The mean values in the other parts of the zone held firm at 3.5-4.4°F. Turning to the days above 95°F, almost the entire parts of Missouri and lower or southern Illinois experienced a difference of 20-25 days, as the remaining states had a difference of 0-15days in the process. Pertaining to the frost season, they seem to be overly prominent in minor spots in upper Minnesota, throughout Northern Wisconsin and entire Michigan coupled with further spread in little patches into portions of Ohio in the Northeast corridor. This trend continued with more spreads into lower parts of Indiana, Illinois, and Missouri with 15-21 difference in frost free season. The cooling degree days on the other hand, appeared heavily pronounced in the Southern part of the study area where a quintet of states comprising of Ohio, Indiana, Illinois, Missouri, and Lower Iowa, posted about 300-375 days levels while the rest of the states fall under 0-225 days difference.
3.2.2. The Heat Index
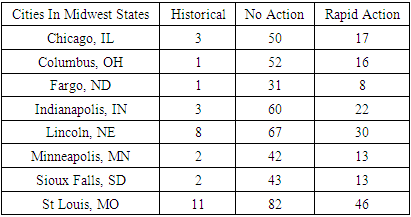
From the breakdown of the data, regarding the number of many more days per year with heat index of above 100-degree Fahrenheit by late century for the Mid west region. Drawing from these conditions and based on the three listed categories. Under the prime spots, the cities of St Louis, Missouri, Lincoln Nebraska, and Indianapolis Indiana took the centre stage. Elsewhere the cities of Chicago, Columbus, and Minneapolis followed up in the second category. Of great importance in the numerical distribution of the values is that among the cities in the respective states, St Louis, topped the listing with 11-82days to 46 in the historical column, the time of events highlighting none and rapid action. In the other places, Lincoln Nebraska in the western portion of the corn belt posted 8 days-67 days and 30 on the historical. Further in the Lower side of the Midwest, Indianapolis Indiana, not only recorded 3 on the historical day column, but it had 60 to 22 more days per year with heat index under the scale. On the Southern axis of the Midwest, Chicago, and Columbus, in Ohio combined for somewhat slightly identical tallies on the many more days phase in a year heat index, measuring over 100°F. In these cities’ where the values ranged from 3,50, 17 to 1,52,16 under the trio of categories of historical, no action, and rapid action. Further on the upper Northern plains of the zone, comes the city of Minneapolis at 2,42, to 13 in the respective categories as anticipated by the late century (Table 2.2). Table 2.2. Many More Days Per Year with Heat Index Above 100°F By Late Century
 |
| |
|
3.2.3. Climate Events Involving Flood Incidents 2019 and Other Years from Heavy Storms
In the context of changing climatic uncertainty in the study area. Many of the cities in the zone have been at the receiving end of unprecedented damages from floods over the years. Against that background, a quartet of them, most notably the city of Cedar Rapids, Des Moines, Iowa City, and Ames, Iowa, all saw damages in the millions of dollars from the menace of heavy downpours dating back to 1993. In the case of June 2008 event, an unprecedented flood disaster which surpassed the previous benchmark of one-in-500-year flood level, measured at over 5 feet, left its mark on the area. In the process, the calamitous proportions of the incidents inflicted between $5 to $6 billion in liabilities during the flooding. Granted that this represents over $40,000 for each inhabitant in the city of Cedar Rapids. The flood which submerged most of the city center, destroyed over 4,000 structures, containing 80% of state administrative centers, coupled with the dislocation of 25,000 citizens. Since the disasters did not occur in isolation, the all-time high, historic flooding at Cedar Rapids came from limited basin capacity and the force of torrential rain on soil previously rendered waterlogged by rare inclement climate events. Because of the inadequacies of storm containment devices over the years. The pressures unleashed from heavy precipitations comparable to the 1993 event levels (of 8 inches in over 14 days) completely overwhelmed a flood mitigation device developed generally to absorb the force from the one -in- a century storm occurrence. Additionally, the stress from the Midwest flood of 2019 triggered further liabilities on an ecosystem already pushed beyond limits. This was fully felt on different scales given the fluctuations in temperature. Of all these conditions worthy of note is that the inundation of many farm fields emerged as an economic setback in the farm hub. In these localities not only, where roads besieged from the intense flood dumped by the torrential downpour event. The visual depiction of pressures on farm spaces from the climate event shows visible scenes of the floods carrying fertilizer and chemical runoffs from crop fields, at a threatening intensity to fresh water supplies. In these places, the storm water spillovers on the roadways in the zone, made driving quite risky amidst contamination of surface water. To that effect, the air photo displays of the Platte and Elkhorn during the heavy flood events of March 16, 2019, offers contrasting tales of how things looked initially and after the storm touched down and obliterated the areas. From the gravity of the disaster, the analysis of the landscape image during the storms, buttressed common inferences reached. This stems from speedy transformation of farms into raging waters in large rivers under the power of ravaging tidal waves.
3.2.4. Intense Drought Leading to Loss of Crop and Ice Cover Declines
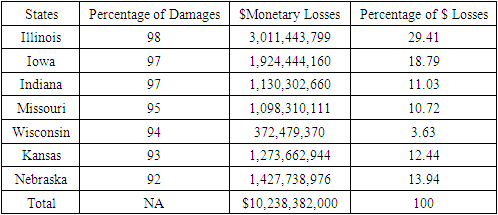
Considering that from 1950-2010, the mean temperature surged twofold, and all through 1980-2010, it rose thrice as swiftly. For that, in 2012, extreme weather events compelled the Federal Crop Insurance Program to pay out an all-time high aid of $17.3 billion due to crop losses. The payouts to farmers in 2012 planting season directed at losses from drought, heat wave and hot wind separately gulped 80 percent of all farm liabilities, with many farms in Upper Midwest states, hurt severely. Since intense climate events like aridity are projected to recur regularly, high insurance payoffs will rise steadily. Of over $10 billion in total damages for the region, Illinois incurred the largest costs of $3billion plus, as 5 other states (IA, IN, MO, KA, NE) posted liabilities of over $1billion, while Wisconsin saw meagre losses. Seeing that most of the percentage of damages in the month of August of 2012 estimated at over 90% from the states of Illinois to Nebraska. The display of the actual percentage losses shows the state of Illinois ahead of the neighbors with nearly 30% while a trio of other states made up of Iowa, Nebraska, and Kansas posted loses mostly in the mid double digits’ levels at 18.79%, 13.94% and 12.44%. Elsewhere, Indiana and Missouri followed slightly with identical values of 11.03-10.72% in the proportion of dollar losses in extreme weather-related events in the agricultural sector, as Wisconsin finished solely in single digits at 3.63% (Table 2.3).Table 2.3. The Mid-West Extreme Weather Event, 2012 August
 |
| |
|
Over the years, the Great Lakes ice buildup fell hugely in the face of growing changes from 1963-2013. At that time, the percentage of areas on ice dropped notably to 45-45% in 1993-2002 to 2003-2013. Lesser ice together with more and violent storms, exposes the shorelines to more vulnerability to erosion and flooding, likely to destroy assets and marine habitats. At the same time, decreased ice cover has shown the capacity to prolong shipping periods with boosts to regional trade. Since navigation calendar jumped to 8 days from 1994-2011, this can also trigger more invasive species and flooding of highways (Figure 2.2).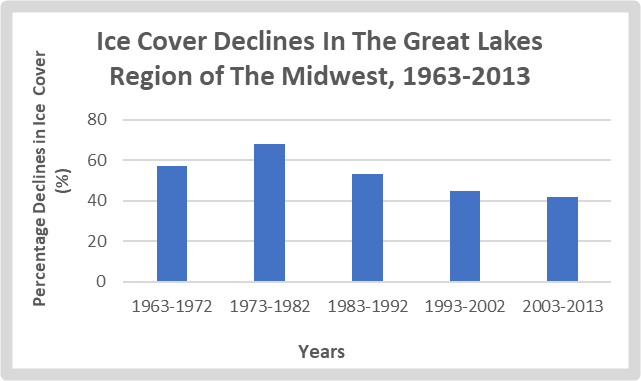 | Figure 2.2. Ice Cover Declines In The Midwest Region 1963-2013 |
3.3. Impact Assessment
Looking at the recurrent risks from climate change in the US Midwest region. The built (social) and natural environment in the form of economy and surrounding localities, and fragile ecosystem were at the receiving end of sustained and future impacts of varying proportions.
3.3.1. Economic Impacts
The growing fiscal effects unleashed by changing climate on the ecosystem of US Mid-West region are real and cannot be overlooked considering the scale and the gravity of the negative footprints in the affected markets and communities over time. Being a zone known for inclement weather conditions with flourishing agricultural landscape dubbed the food basket of the nation containing over 500,000 farms with market values measured at over $100 billion. In its capacity as the agricultural hub of the nation, the high-risk exposures to erratic fluctuations in temperature and precipitation patterns carry fiscal shocks, as manifested with recurrent damages and loss of revenues triggered by climate change induced natural disasters. While there are also forms of unwanted exposures to communities and other sectors precipitated through the spillovers from fiscal shocks of natural disasters. There exist two events under the purview of impacts that stands out. In 2019, when the Midwest water hoses in conjunction with vanishing snow pushed up the Missouri and Mississippi rivers past their lines, triggering extensive damage. During that period in question, heavy floods throughout the entire Midwest produced an approximate price tag of $6.3 billion in liabilities via destructions prior to the ending. In the process, while violent flooding has pounded many counties in Iowa beginning in 1988, others have seen such disasters well over 17 times. For that, it is not surprising that storms ruptured through embankments, flooded farm fields, and overwhelmed houses and companies in communities and counties all over Iowa, Nebraska, and couple of other states in the Midwestern states. Furthermore, in the fiscal year, 2012, extreme weather events that resulted in intense droughts together with heat wave and hot winds led to the destruction of crops. This in turn compelled the Federal Crop Insurance Program to dole out an all-time high $17.3 billion to affected farmers due to crop losses.
3.3.2. Social Environmental Impacts: The Submergence of Beach Fronts
In line with the analysis, the hazards of climate change based on the cresting of Lake Michigan area provides another eye-popping perspective. This involves the submergence of 2 beach fronts in the Chicago area from the heavy flooding out of Lake Michigan in the summer of 2019. With the most difficult time yet to emerge. In a period of two consecutive months from the primary information, Lake Michigan exceeded its peak levels in over 30 years and every time an inch below the unprecedented limits exceeded in 1986. In Chicago, where no portions went untouched, during 2019, a large waterfront inundated two major Chicago beach front corridors completely and intermittently shut down the others. Due the pressures from the changing climate, during the month of July 22 of 2019, the flooding waters prompted submergence and pushed away fishermen from the duck. This not only interrupted swimming activities on the beach front and flooded land cover spots, but it exposed boat users to unwanted hazards. The grim nature of the situation shows the flood waters from the Lake covered both walking trails and bicycle paths, with much of the sinking assets deteriorating. From the analysts in the area, people ought to count their luck due to summer like nature of the events given the tendency for more risks in the fall season known for high circulation of moisture. In all this, climate change could impose additional strains on city residents and vegetation, through widespread air pollution and heat island impact. Moreso, many of the towns have obsolete infrastructure and are very prone to climate change induced flooding and deadly heat waves. Against that background, thus, the number of warm days (over 90°F) and very hot days (over 100°F) is most very likely to rise. Just as 9 cities from Chicago to St. Louis will see their annual mean number of days at over 90°F, rise 2-3 times during the closing decade of 2000s with lesser emissions, and 4-7 times at higher levels. The 9 cities risk a 50% repeat of 1 heat wave event comparable to the Chicago 1995, event that claimed 700 deaths, prior to 2040.
3.3.3. Physical/ Environmental Impacts on Water Resources and Agriculture
Rainfall in the study area will be extremely dangerous, precipitating torrential storm liabilities, poor drainage schemes, and limited potable water accessibility. For that, Midwestern towns known for their impermeable structure may lead to more surface water overflow going into both storm and sewer removal networks. Anytime this sort of network is overstretched through torrential downpours, untreated sewer runoff may lead to the degradation of water available supply deposits, affecting freshwater harvest, public health, and welfare. Further intense rains in these settings can trigger the probability of homes and structural destruction, tour interruptions, and disturbance in daily activities. The problem of sediment flow and washing away of soil, may block basins and shrink storage space volume. Looking at the potential impacts from the damages and the need for mitigation. City authorities can then finance novel infrastructure development to avert pollution and shield water source access from exposure. In that way, estimated increases in mid-year dryness occurrence and loss levels into atmosphere due to intense heat may possibly bring down water volumes within streams and marshlands, together within critical economically viable ports and rivers. For that, interruptions in flatboat transportation through the Missouri and Mississippi rivers did happen before now. Just as shifts in the Great Lakes zone remain uncertain, however water level drop could cause decreases in the mass of freight cargoes and reduce the use of shoreline facilities or structures, like harbor and jetties. From the unfolding trends, the Mid west region should brace from mounting shifts in the climate considering the anticipated impacts on agriculture, forested landscapes, coupled with other components of the ecology in the zone. Being a place where farm fields occupy 2/3 of the zone's landmass and generate 65% of the country's maize and soybeans. Any form of global warming or climate induced effects can put in jeopardy immediate gains for the farm sector since harmful impacts are as well likely during current conditions. Over time, shifting effects in climate are possibly primed to unleash gradually damaging effects that increase unevenness in yield and farming output. The other side of the equation is that temperatures, particularly excessive warming, strain the capacity of cattle in ways that lead to decreases in beef, milk, and egg output. Illnesses may possibly rise because of heat situations and humidity drive up virus diffusion and as well as the scale. Additional costs can as well occur amidst the rising desire to cool off the room temperature in farm herds barns. In the zone, natural environments have also experienced vacillations through the mixed impacts of climate shift, land-use change, and the invasion of alien species. In the process, woodlands are exposed by recurrent aridity, outbreak of wildfires, and pest invasions. Countless tree types will as expected slowly change their ranges to the north. Within the Great Lakes and minor waters in the zone, elevated temperatures are possibly going to accelerate climate change with impacts on fish varieties.
3.4. GIS Mapping and Spatial Analysis
The GIS analysis covers the visual display of spatial patterns highlighting varying stressors and indicators interacting with the environment in the face uncertainty in climate change in the study area over specified periods. The risk parameters peculiar to the zone consist of drought monitor levels, precipitation distribution along with the average and maximum temperature patterns. Added to these are geo-visual expressions highlighting average temperature, average maximum temperature, average daily precipitation, and accumulated precipitation. Out of the discomfort of the disasters in the region over time, the information as accentuated by the geo-visualization underscores the display of values of pinpointing the outbreaks of drought intensity, temperature levels and precipitation volumes, affirms the grim situations in changing climate and the evolution in space from one state to another. The capacity to track and show the spatial paths of these issues under a GIS environment as a critical evaluation device. provides opportunities for assessing climate change risks in the US Midwestern region. In the early days of January 3 of 2023, when the geographic distribution of drought intensity was under the different levels contained in the map index. Their presence was fully manifested in the order of exceptional, extreme, severe, moderate, and abnormal intensities with relative spread across the states from the North, South, East and Western parts of the states. From the nature of the dispersion, one would have expected much milder levels of drought intensities during that time of the year. However, that was never really the case, considering the visible presence of all major categories (exceptional, extreme, severe) denoted in dark red, brown, orange together with the moderate and the exceptional aridity levels robustly dispersed across Kansas and Nebraska and followed by extreme and severe droughts about to unleash further spread into Iowa and Minnesota. From thereon, aside from the presence of soft patches in drought intensity in few parts of Minnesota, note how the opening blast of drought from the Southwest to the Northwest suddenly shifted onto the great lakes with major build up out of the upper and lower Michigan to Ohio in the Northeast to solid presence in Indiana coupled with crossovers into Illinois and Missouri (Figure 3).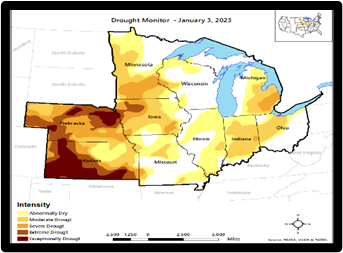 | Figure 3. Drought Monitor January 3 2023 |
In the context of changing climatic parameters particularly, drought monitors across the Midwest states from Kansas to Ohio, all through January to March in 2023. From the information contained in the index under the map showing varying levels of intensity as displayed in the colors of dark blood and shades in brown and yellow color. Just as it is not surprising that in the Northeast and Southeast axis of the study area, communities are usually reeling under harsh winter climates during the months of January to March. In the Southeast areas in the region made up of Kansas, Nebraska, and Iowa comes spillovers into Missouri compared to the heavily cold spots in the Northeast part of the zone. To that effect as at the month of January 31 of 2023, the trio of core farming states in Kansas, seemed to be under drought intensities deemed of exceptional, extreme, and severe. Added to that is the ample concentration of the exceptional, extreme, and severe drought type fully visible in the Southwest to Southeast Kansas followed by dispersions into the Nebraska area and upper part of Iowa. There was gradual spread of moderate and abnormal droughts in thick and mild orange and yellow colors afar up North to Minnesota. This is followed as well by some soft patches of severe, moderate, and abnormal droughts clustered further into Michigan, Indiana and minute parts of Ohio and Illinois as Missouri in the Southeast saw doses of drought intensity on the severe, moderate, and abnormal sides in the month of January 31 in 2023. At same time, also note the way drought intensity faded completely in Wisconsin, Ohio, and Illinois during end of the month period of January 31st in 2023 compared to what transpired on January 3rd of 2023 (Figure 3.1).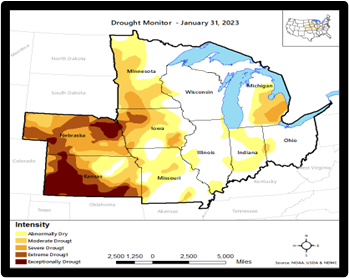 | Figure 3.1. Drought January 31, 2023 |
From the events that unfolded by the 28th of March 2023 as the drought monitor map indicates, there seems to be a deep contrast between the Northwest-Southwest axis and Northeast and southeast parts of the study area. The fact that Kansas, Nebraska, parts of Iowa and Minnesota again than the other states experienced droughts of higher intensities classified as exceptional, extreme, and severe show they have a propensity to that trend than some of the upper Northeast states (Figure 3.2). Shifting further into 26th day in the month of April. The same common pattern in drought emerges lightly in Kansas and Nebraska with concentration of the core categories of exceptional, extreme, and severe coupled with scattered patches of less intense drought types most notably moderate and abnormally aridity firm in Iowa. This continued with soft spread onto Minnesota, Wisconsin, Illinois, and Michigan. This is followed by total absence in Missouri, Indiana, and Ohio and much of Illinois (Figure 3.3). Just as we saw in the previous years, the study area saw more drought spells manifested in Kansas, Nebraska Missouri, and Iowa in the farm belt during January 25 in 2022. This later continued with big presence in Minnesota, Wisconsin and soft spread into Michigan and Illinois (Figure 3.4). However, during the summer months of July and October of 2022 fiscal year, see the slightly robust drought intensity moving into the quintet of states beginning from Missouri, Kansas, Nebraska, Iowa to Minnesota. From there came more gradual spillovers into neighboring Wisconsin, Michigan, Illinois, and Indiana. Accordingly, based on the emergent spatial patterns out of the map over the period. The heavily farmed areas of the corn belt states of Nebraska, Kansas, Missouri, and Iowa seem to have faced more dangers in recurrent drought intensity with threats to the ecosystem in the specified period during the season (Figure 3.5). 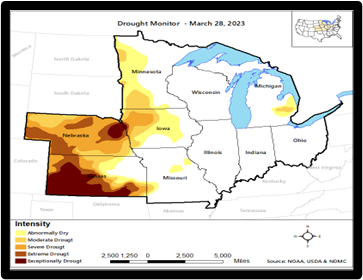 | Figure 3.2. Drought Monitor March 28, 2023 |
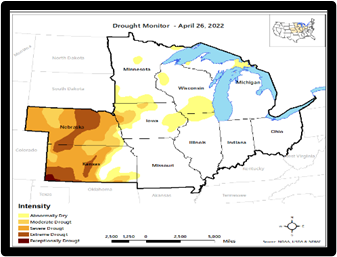 | Figure 3.3. Drought Monitor April 26, 2022 |
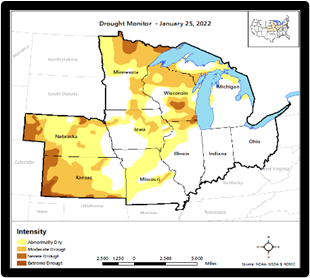 | Figure 3.4. Drought Monitor January 25, 2022 |
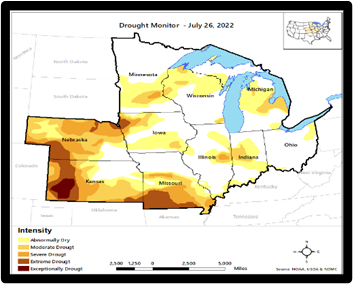 | Figure 3.5. Drought Monitor July 26, 2022 |
Further deep in the fiscal year during late October (on the 25th day) and from the drought monitor side of the spatial analysis. The study area experienced a pattern of robust concentration of drought intensification touching on all the categories. For that, the load of drought intensification not only held steady under various drought intensity parameters. But the geographic evolution of the trends points to further exposures again in a quartet of states in the corn belt. Seeing that the initial set of states at the receiving end stretched through Nebraska, Kansas, Iowa, Missouri, and Minnesota. There exists vast swath of areas in the states of Midwest like Wisconsin, Michigan, Illinois, Indiana, and Ohio that came under a late blast of drought spell during the period of October 25th of 2023(Figure 3.6). Beginning with patches of lower inches and high inches of rain denoted in yellow, the lower levels in green and blue in medium and high scale stretched across the zone, as shown in the legend from the month of July -August months in 2022.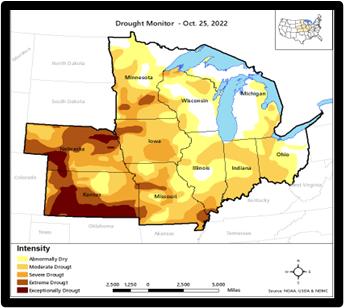 | Figure 3.6. Drought Monitor October 25, 2022 |
Just as in the left side of the map, appears the slow dispersion of yellow and splash of green and rain fall clusters of the blue types enveloping in the respective cities. The few yellow spots in Kansas City and others in the Lincoln area and couples of spots adjacent to the borders between Illinois, Iowa and Missouri, the cities reflect mostly lower precipitation volumes at the scales of 0.02-0.03 inches. Within the same time, the spread of rain levels in medium scale at 0,07-0,20 in green color was so overwhelming that it covered much of the areas on the map of the study area. This notwithstanding, the dispersed presence of higher volumes of precipitation measured at 0.25-0.5 inches in blue colors hovering across couple of spots were evident near Madison, the vicinity of Saint Louis down South, coupled with Detroit and Columbus axis in the cities under higher rain levels (Figure 3.7). 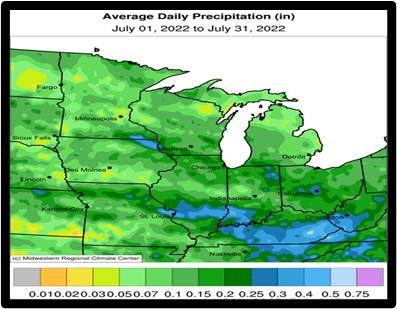 | Figure 3.7. Average Daily Rainfall July 2022 |
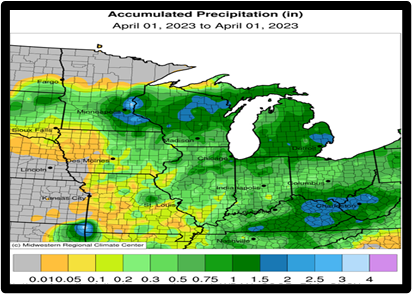
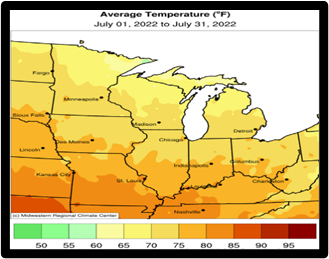
Regarding average precipitation in the month of August (01-31st) 2022, aside from the minimal rain levels indicated in yellow, and spread across Kansas City, St Louis, Lincoln, and Kansas City. The dispersion of rain falls levels in the scale 0.07-0.20 inches in green still showed a robust presence from St Louis to Minneapolis down to Indianapolis to Columbus under the precipitation volume in blue at a scale of 0.25-0.50 (Figure 3.8). Looking at the daily rainfall distribution forms over the years particularly during the 1st of April of 2023. It is clear from the information as calibrated in different colors of red, orange, green, purple, and beige depicting rainfall volumes on a scale of 0.01, 0.50, 1, 1.5, 2.5 to 4 inches, the recurrency of such events therein. From the patterns in the signatures below across the major cities among the states in the study area under the spell of different scales in precipitation patterns. Note that the cities in areas in the southern part of study area from Kansas City, Lincoln, Des Moines, St Louis, and Lincoln, saw little rain unlike the places in green and blue concentrated in mostly cold areas in the western part of the zone. This includes cities in the outskirts of Minneapolis, Madison, Detroit, Indianapolis, Chicago, Indianapolis, and Columbus with rainfall volumes of 1, 1.5-2 inches (Figure 3.9). On the average temperature side of things for July 01-July 31, the humidity levels germane to the cities as represented in yellow under 60-75°F, shows highest scales of hotness of 90-85-80°F in light red and orange fully spread across St Louis, Kansas City, Lincoln, Indianapolis, and Columbus (Figure 3.10). 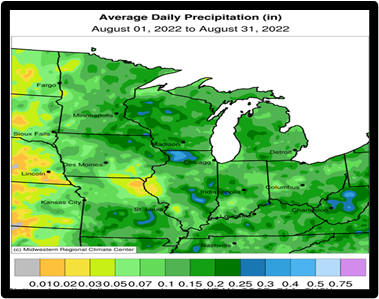 | Figure 3.8. Average Daily Rainfall August 2022 |
 | Figure 3.9. Average Daily Rainfall April 2023 |
 | Figure 3.10. Average Temperature July 2022 |
With June, July and August, the hottest months in the region, across states and cities. Out of the applicable scales of 65-100°F, there is no denying the fact that the temperature distribution remains overly intense for citizens therein in June of 2022. From the spatial patterns in the distribution, the ecology was exposed to scotching heat that threatened the social and natural environment. A closer look, further shows threatening wave of higher levels, not only carpeted the cities in the region, but it seems that the lower areas of the map never caught any break. This stems from the huge spread of high temperature at the scale 85-100°F into Kansas City, Lincoln, St Louis, Des Moines, and Indianapolis. There was also visible stretch further into Minneapolis, Madison, Chicago, as Columbus, and Detroit held firm under 80-95°F temperature (Figure 3.11). By July and August of 2022 when the average maximum temperature of August 01-August 31st in 2022 vacillated between levels not different from the previous months. The cities in the study area still came under the barrage of heavy heat intensity of different scales at the maximum scales (Figure 3.12-3.13). 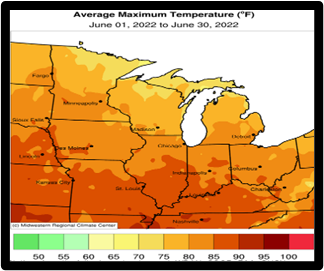 | Figure 3.11. Average Maximum Temperature, June 2022 |
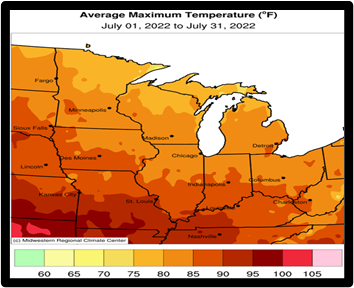 | Figure 3.12. Average Maximum Temperature, July 2022 |
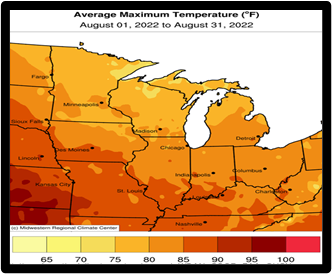 | Figure 3.13. Average Maximum Temperature, August 2022 |
3.5. Factors Shaping Climate Change Impacts in US Mid-West
The threats from climate change stressors does not operate in a vacuum in the study area. It is predicated on a set of ecological, economic, and social factors listed as follows. These elements are described below one after the other. The interactions of these elements with the climate in the face of irregular climate patterns tied to the physical environment as seen with the agricultural ecosystem and socio-economic parameters indicative of the unprecedented expansions from population and urban growth across metro areas and cities, are having huge tolls on ecosystem stabiliy to the detriment of the community.
3.5.1. Ecological and Physical
The Midwest climate situations are mostly influenced by the zone’s spot on the map, being the middle point in the continent of North America. The settings are as well shaped by the flat surface landscape, engraved by the glaciers that shielded the zone for thousands of years during the past ice age. Out of the reach of regulating impacts of the oceans, the region’s climate settings have the capacity to shift notably during the span of 12 months period. For that, the abrupt shifts in climate, the huge day-to-day temperature varieties, and erratic rainfall patterns characterize entirely the core components of the regional climate’ meteorological conditions. Accordingly, the Midwest usually has four separate seasons, though the climate in some of the periods are very erratic. Nevertheless, the yearly variations appear big sometimes. In the process, during the winter period, the non-existence of considerable mountain or elevation shields as buffers towards the northmost axis, allows the severely chilly air fronts coming through the Arctic to circulate southbound into the zone. Additionally, given that many of the Midwestern power corporations rely heavily on coal. The huge carbon footprint therein is unsurprising. Contrasted to nationwide specifications, the Midwest is excessively dependent on coal fuel. In the year 2020, Missouri, Indiana, and North Dakota emerged as the 2nd, 3rd, 6th -major coal users. Directly behind these top consumers of coal are the group of other Midwest states such as Ohio, Illinois, and Michigan. Beginning with automobiles, upholstery, heavy duty equipment or gears, the manufacture and supply of metallic/iron or steel items, trailers, mobile homes and devices, the region’s industry relies heavily on fuel. The same thing applies to the making and delivery of biochemical goods, and together with the timber utilized to design or construct houses, fossil fuel usage in these sectors did not start today. For over 2 centuries, the Midwest built a market driven by the manufacturing sector where heavy-duty machines utilized in such activities come from areas heavily dependent on fossil fuels sources of climate stressors such as coal and natural gas, hence the connection to the impacts.
3.5.2. Agricultural Sector Related
The Midwest as an agricultural hub and usually referred to as the “Corn Belt in couple of states (Illinois, Indiana, Iowa, Michigan, Minnesota, Missouri, Ohio, and Wisconsin) solely cultivates corn and soybean as crops. However, the Midwest boosts of amazing varieties in farm activities and output. With more than 127 million acres of farmland in the region. Almost ¾ of land mass set aside to the cultivation of corn and soybeans; cover the remaining 25 %. Largely, the zone stands among the most active and heavily farmed corridors in agricultural output globally. As required, farm production activities depend heavily on direct energy usage due to the of use of diesel, coal- or fossil gas-fired electric power loads, coupled with more and more, renewable fuels for farm operation. The indirect power usage, made up of fuels and farm feeds, particularly natural gas, in the production of farm chemicals like fertilizers and pesticides leave in their wake negative footprints. Moreso, widespread land use changes resulting in deforestation, soil erosion, and machine- or fertilizer-laden agricultural practices regularly applied in the Midwest discharges nitrous oxide and methane, greenhouse gases that aggravate the shifts in climate and the attendant dangers. During the period 2019, 75% of U.S. nitrous oxide emissions emanated through farm soil management. Added that, the use of waste as manure via livestock (poultry, cattle, horses) often mixed with bedding like sawdust, wood shavings or animal feed waste to produce fertilizer are not only sources of emissions, but in 2019, 4% of U.S. nitrous oxide emissions also originated through manure management only.
3.5.3. Economic Elements
The huge presence of large manufacturing hubs like car and the automobile industry as well as mining in some of the areas in the Mid-west with carbon footprints cannot be overlooked as integral parts of underlying factors facilitating the changing climate patterns in the zone. Knowing that part of the prevailing policy arguments in the later part of the last century in the western region hinged on how the perceived flow of transboundary pollutants from the Midwest was hampering efforts to towards global warming mitigation. While this is not intended to put the Midwest on the spot, but the geographic proximities of both regions add some truths to as to how the heavy presence of greenhouse sources among economic sectors linked to the high concentration of Green House Gases stems from inaction of the Midwestern region. All in all, the correlation between the unprecedent growth in the economic sectors and emitters of GHGs in the last several years cannot be ruled out as sources of high carbon dioxide concentration in the atmosphere as well as the emission of GHGs devastating and heating up the ecosystem.
3.5.4. Social, Community Habits, Population and Policy
Realizing that most houses and structures in the Midwest depend highly on use of hydrocarbon generated natural gas for residential heating. Considering the study area’s history of climatic variability from hot to extremely freezing temperatures. The vast irregular patterns in cyclic atmospheric temperature throughout the Mid America drives up energy requirements dedicated equally to heating and cooling, with the winter season being the time of maximum needs for heating. In the case of the state of Minnesota only, the industry uses 33% of natural gas supplied to users. Within residential homes in Minnesota, 2 in 3 houses heats their houses using fossil gas. In as much as the states in the Midwest zone remain in the mix regarding the greening of the electric power production, being regularly active in the use of carbon-free power supply across time. However, business and households’ emissions have risen notably. The use of natural gas and propane in most buildings is responsible for around 14% of greenhouse gas emissions discharged thought the Midwest zone. In the towns located in the cities, natural gas and propane burning in institutional, commercial premises and households are responsible for 30 percent or over in greenhouse gas emissions. Further complicating the vulnerability, is the driving habits of many citizens in the zone who have rake in lengthy milage on their trips while emitting huge volumes of noxious gases like GHGs. The rapid pace of development activities due to the design of new settlements and the expansions from population and urban growth across metro areas and cities, are escalating GHGs emissions, while having huge tolls on ecosystem stability to the detriment of communities. In a similar vein, there is no doubt, the current policy approach to mitigations, seems quite ad-hoc in nature from a regulatory standpoint. Given the high propensity of the region to the unpredictability of extreme climate parameters. The policy intervention measures in place are devoid of long-term actions indispensable in permanent solution and recovery. Considering that the region is customarily receptive to proactive measures, let no person ignore the challenges emanating from some of the actors. This is occurring in the age of sceptical labelling between rival ideological groups even though connected by collective interest even though many continue to call into question the genuineness of climate shifts in a region currently susceptible to extreme weather events. All in all, such ambiguity in policy and other elements remain inseparable from the common linkages to climate change impacts in the Midwest region.
3.6. Mitigation Efforts
There has been a wide range of initiatives put into place to address the challenges of changing climatic risks in the Midwestern region.
3.6.1. Adoption of Climate Change Flood Plain Ordinance
The city of Cedar Falls’ novel floodplain regulation broadens zoning limitations or boundaries starting from the 100-year floodplain to the 500-year floodplain so as to properly mirror the flood hazards ravaging the city and many others in the Mid-west region all through the 2008 floods. Additionally, the city of Cedar Rapids has as well adopted important measures to minimize impending flood destruction, based on acquisitions of over 1,000 assets, and many houses modified with flood safety mitigation action plans. Drawing from the assistance of over $3 billion by all tiers of governments at the federal and state levels, Cedar Rapids not only started recovery, but it instituted substantial measures to minimize imminent flood disasters. Considering that many of the cities have started to integrate adaptation schemes for an array of changing climate effects. Among the other cities, Chicago stands as the first to formally incorporate climate change to overall regional grand plan. Ever since the city Climate Modification Plan’s declaration, some of the approaches were realized to assist the city control temperature, safeguard woodlands, and boost green plan, applying tools like green rooftops. For that, areas across the Midwest, like Palmer, Minnesota, are taking advantage of land co-uses, siting wind and solar accessory on land for prime agricultural production.
3.6.2. The Midwestern Greenhouse Gas Reduction Accord
As part of the moves to curb the risks posed by climate change among states in the region. The Midwestern Green House Gas Reduction Accord stands out as a regional arrangement. This was put forward by six governors of states from the US Midwest zone with memberships in the Midwestern Governors Association (MGA), and the premier of a Canadian province, dedicated to cut greenhouse gas emissions to battle climate change. Even if the agreement has been dormant in the last 13 years, the time the consultative group delivered an action plan to the organization is based on a proposed timeline for implementation calendar of 2012 January. While parties to the agreement span across the US Mid states of Minnesota, Wisconsin, Illinois, Iowa, Michigan, Kansas, and the Province of Manitoba in Canada. Those others in the witness or observer category in the agreement consists of Indiana, Ohio, and South Dakota, together with the Canadian Province of Ontario. Although the Midwest region boosts of heavy manufacturing and agriculture sectors, making it the most coal-dependent zone in the North American continent. The area has substantial renewable energy sources but predominantly susceptible to the climate shift prompted from the scorching of coal and fossil fuels. The said agreement among the signatories seems like a timely move to stem the tide of climatic risks.
3.6.3. Regional Decarbonization Initiatives
Luckily, there are many options and schemes that are ongoing to quicken fair and just building decarbonization across the Midwest. The Midwest Building Decarbonization Coalition, a mission of New Energy, is aiding advance that initiative. With that, many of the houses and businesses premises approve cold weather heat pumps as an extension of their weatherization and power efficacy updates, that save cash while slashing the emission of carbon. Under the Fresh Energy’s new Gas Decarbonization program, the proponents are continuously working with partners and key participants to expand the prospects for decarbonization and hasten equal delivery of the new mitigation program in Minnesota and all through the Mid America. Fortunately, electric vehicles (EVs)—known for its low or no tailpipe emissions—stands as a portion of multiple-cleft answer towards the decarbonization of the economy. As such, part of the expectation centers on minimizing GHGs discharge together with other vigorous mobility methods such as hiking, walk, rolling, and bicycling. The EV development is ongoing, due partly to years of research. Of these, Minnesota stands ahead in the Midwest in taking a quantum leap in both producing cleaner electric power that discharges fewer GHGs while driving sectors like transportation with that clean technology electric.
4. Discussion
The US Midwest region, famous for the huge tapestry of estuaries coupled with large extensive spread of agricultural fields stands out as country’s main food basket. In its capacity as large farm hub highly indispensable in the production and distribution across the global marketplaces. The zone’s direct relevance transcends over nearly a dozen states buoyed by a thriving structure connected through farming operations within and outside of the Middle America. Considering that the study area consists of sizable farms estimated at over half a million connected to energy-dependent industrial activities. The heartland is responsible for over 60% of US output in corn and soybeans. From all the snapshots evident in the attributes regarding the interactions between farming, socio-economic activities, physical forces, and climate risks. The northern portion of the region is heavily imbued with commercial activities and flow of climatic stressors. From the analysis in this paper through a mix scale methods prism connected to descriptive statistics and Geographic information system (GIS). The US Mid-western region continues to be at the center of changing climatic impacts. With the region’s geographic location and high propensity to variability in temperature and precipitation patterns in the face of changing climate over time. Drawing from temporal spatial shifts in various indices of climate change from CO2 emissions to changing temperatures in the methodology and initial profile of the study results using descriptive statistics. In the years 2005-2016, when all areas from Illinois Wisconsin saw a mix of high to single digits declines in energy related CO2 emission known to trigger climate change, strangely enough only Nebraska posted 11% surge in emission. In the process, during the 2012, 2015 through 2016, the region not only saw total CO2 average of 1261.3 MMT. However, among the individual areas, a trio of southern Midwest states (Ohio, Illinois, and Indiana) accounted for combined mean estimates of 218.4 MMT far ahead of the other neighbors in region. Pertaining to the incidence of rising temperature in the zone, the Midwest has been undergoing changes in accordance with pressures from human induced rise in temperature at global proportions. In the process, within the study area, the mean temperatures reached elevated levels together with declines in snow and ice cover, altering farming period, amidst recurrent patterns in torrential rainfalls. To glean more on the region’s temperature vacillations, look no further than the number of many more days per year under the heat index of above 100-degree Fahrenheit by late century across the Mid-west. From the 3 benchmarks tied to safety and limiting risks from the number of heat days, in the first category places (St Louis, Lincoln, and Indianapolis) deemed vulnerable. In the same order, the projected Mid Century Temperature variations in the zone based on average, cover days of over 95°F, frost free season and cooling levels. Inferences from the average temperature variations in the upper Midwest states of Minnesota, Wisconsin and Michigan not only stood at 4.7-5.0°F in differences, whereas the mean in the neighboring areas held firm at 3.5-4.4°F. Regarding days over 95°F, all of Missouri and Southern Illinois saw a difference of 20-25 days while in other states, it amounted to a variance of 0-15days. In a setting where 9 cities from Chicago to St. Louis are expected to have their yearly regular number of days at over 90°F, to surge by 2 to 3 times during the 2000s with lower emissions, 4-7 times at maximum scales. Accordingly, the 9 Midwestern cities are in danger of experiencing over 50% scale of recurrence of 1 heat wave event equivalent to the 1995 Chicago debacle that killed 700 people before 2040.In highlighting the order of related liabilities that besieged the Mid-west through global warming induced change. Consider the heavy flooding incidents in 2019 and heat from elevated temperature that destroyed farm crops across the region. In the case of the flooding event, alone in the US Mid-western region, a couple of cities in the zone, especially Iowa have been at the receiving end of unprecedented damages from floods over the years. Against that background, a quartet of them, most notably the city of Cedar Rapids, Des Moines, Iowa City, and Ames, were overwhelmed by heavy damages on commercial properties, farms, and residential homes from the floods at a heavy price tag estimated in the billions of dollars. Additionally, climate events involving intense drought led to loss of crops. Out of more than $10 billion in total damages for the region in 2012, Illinois incurred the largest costs of $3billion plus, while another 5 states had liabilities to the tune of over $1billion. Considering that from 1950-2010, the mean temperature level doubled, between 1980-2010, it rose thrice as quickly. Since intense climate events like aridity are projected to recur regularly, high insurance payoffs will rise steadily. Seeing that the GIS mapping of the trends suggests incessant diffusion of risks from changing climate. The proficiency of GIS mapping was crucial in showing the spatial distribution of climatic parameters made up of high temperature synonymous with drought monitor index and the emergence of average temperatures. The other strengths of the tool involve the capacity to display related limitations, and the exposures of human settlements in Mid America to rainfall based on shifting averages of different levels. Given that the Midwestern region located in a place known for inclement shifts in climate. The spatial analysis that underlined the geographic patterns in the trajectory of climate change indices, revealed the pathways of impacts over time. Taking a cue from the analysis, the results show the prevalence of climate change risks and impacts in the form of flooding hazards, Greenhouse Gas Emissions, rising temperature, the threats of sea level rise resulting in the submergence of beach front properties, environmental degradation, and the dislocation of people. The GIS mapping of the trends pinpointed clusters of heavy presence of stressors dispersed across space over time and attributed to socio-economic, physical, and ecological elements. To remedy the situation, the paper proffered numerous solutions ranging from the adoption of effective policy, growth management, monitoring to the design of a regional climate information systems and the education of the public and others.
5. Conclusions
This paper assessed the risks from changing climate effects in states of the US Midwest region with several important outcomes itemized as follows a) Risk indicators of climate change rising; b) the study area an epicenter of climate disaster; c) climate fluctuations fuelled by various factors; d) mix scale approach radiates efficiency. 1) Risks Indicators of Climate Change Rising In the MidwestSeeing the comparative socio-economic advantages, turnarounds, and ecosystem treasures, rich in the plethora of biodiversity sustained by lakes and rivers sparkling with fresh water in the great lakes containing 30% of freshwater deposits globally. However, the Mid west has no immunity concerning the surging vulnerability to climate change indicators. To that effect, being the middle point along the continent of North America. Life in the Mid America’s ecozone remains at the mercy of two weather extremes of warm and cold fronts moving from North to the South that are driving the sporadic climate. With climate change risks recurrent, and spillovers fuelling ground H2O aquifer depletion in the great lakes [5] evident. The Midwest exposures to very cold air fronts out of the north and warm air from the Gulf of Mexico is leading to wide-ranging mix of intense heat and rainfall excesses. Such abrupt shifts in climate, punctuated by huge day-to-day temperature varieties, and erratic rainfall forms, reflect entirely the dimensions of regional climate conditions indicative of the shifting indicators. While the gravity of the risks which transcends the upper, lower, and central parts of the Midwest region, involves the threats of periodic heat waves, extreme drought, heavy rainfalls, recurrent flooding, destruction of farmland and shifting temperature. The risks and recurrent changes at fluctuating scales are now a common trend among various states from Nebraska, Missouri, Iowa, Wisconsin, Michigan to Ohio. Added to that, comes the surge in drought intensity as evidenced with the early hours of January 3, 2023, when the spatial patterns of drought spell emerged under different levels with threats to crops, communities and public health in the order of exceptional, extreme, severe, moderate, and abnormal intensities relatively spread across the states from the North, South, East and West parts of the region. Underlining these dangers and their links to daily activities is of great relevance in pushing policy changes that addresses the problems pertaining to stressors from industrial sources. 2) Study Area an Epicenter of Climatic DisastersThe common view of Mid America’s location as among areas in the nation with high propensity to shifting climate patterns, is undisputable considering the frequency of extreme weather uncertainty resulting in disasters of all kinds across the 11 states. From its location as stated earlier at the center two opposite climate extremes, the Midwest vicinity to periodic landing spots of very cold air fronts out of the upper north and hot air from the Gulf of Mexico ecozone is driving up widespread eruption in rising temperature and unprecedented torrential downpours. In the study area, such situation, is associated with probable outbreak of aridity, warmer temperatures and shifts in rainfall intensity. These changes across time, accelerates drought and violent rainfalls. Considering that the Midwest regularly encounters the collective impacts of dryness and heavy rainfalls based on the physical settings. The hot spells in certain periods of the year and the surge in temperature, overlaps with extreme rainfall and storms that are ravaging drainage amenities amidst heavy inundations. Drawing from the analysis herein, as an epicenter, the US Mid-west seems to have its hands full of the liabilities driven by climate change induced natural disasters in the past years. This can be demonstrated by continual storms, the growing numbers in the state of emergency declarations, severe flooding, and countless nature of torrential heavy downpours, artic cold fronts, and blasts, droughts across cities and towns and lately, the drops in ice and snow cover in built up and natural areas. There are also spillovers from storms resulting in road closures and dangers to commuters as well as environmental pollution. In 2012, extreme weather events including heat waves forced the Federal Crop Insurance Program into paying record breaking amount of $17.3 billion to affected farmers due to crop losses. Since payouts to farmers in 2012 planting season were directed at losses from drought, heat wave and hot wind separately gulped 80% of all farm liabilities, with many farms in Upper Midwest states hurt severely. Additionally, the incidence of beach front submergence in the Chicago area from the heavy flooding out of Lake Michigan in the summer of 2019, reached overwhelming levels as no one wanted a repeat of the 1995 heat wave that killed 700 people in the same city. In the context of changing climatic uncertainty in the study area, the US Mid-western region, cities in the zone have been at the receiving end of unprecedented damages from floods over the years. For that, a quartet of them, most notably the city of Cedar Rapids, Des Moines, Iowa City, and Ames, Iowa were under the spell of heavy water floods that created huge monetary damages in 2019. At the same time, the 2008 flooding within the study area led to loss of lives, $15 billion in damages and liabilities through diminished farm harvests, and the shutting down of major roads. The graphic display of climate risk info in this study emphasizing the trajectory and rate of recurrence of the natural hazards provides, the region and those in similar ecozones to draw from the timings and then develop resiliency measures in a step towards mitigation.3) The Climatic Risks Fuelled By Many FactorsFrom the patterns of climate events germane to the Midwest region, and the impacts as shown in the enquiry. It is evident that despite the commendable efforts of all sectors, the problems seem to have been worsened by a host of factors such as ecological/physical elements, socio-cultural, and economic variables. Under economic elements, the huge presence of large manufacturing hubs like car and the automobile industry as well as mining in some of the areas with carbon footprints cannot be overlooked as integral parts of underlying factors driving the changing climate patterns in the zone. On the ecological and physical indicators, the study area’s climate conditions seem greatly shaped by its spot on the map, in the middle of the continent of North America. This makes the area continually exposed to extreme levels in both precipitations and abnormal temperatures beyond the control of anyone. This happens in the face of vast irregular patterns in cyclic atmospheric temperature throughout the year. The extent of percentage rises in the volume of rainfall landings on daily occurrences that surpass the 99th percentile of every non-zero rainy periods since 1958 to 2016 across the nation, shows the study area besieged by more rainfalls than the other regions over the years. Under agroecology, know that in its capacity as the agricultural hub, the Midwest boosts amazingly of varieties of farm activities and output. With more than 127 million acres of farmland under operation, the activities therein from animal husbandry to the production of crops rely on fuel use implicated in the emission of CO2 to operate, while the production of manures and nutrients also are sources of GHGs as well. Looking at the economic side, the huge presence of large manufacturing hubs like car and the automobile industry as well as mining in some of the areas carry huge carbon footprints that are integral part of forces accelerating changing climate in the zone. The same can be said of the policy and social components in the indicators in which the current approach towards mitigation seems quite ad-hoc or reactive in nature from a policy standpoint. Granted the vulnerability of the zone to the volatility of extreme climate indicators over the seasons, the responses lacked long term templates needed in permanent mitigation. The fact that the zone is traditionally receptive to proactive measures, one cannot overlook the challenges from the stakeholders. This comes in an era of cynical labelling among opposing groups even though bound by the common desire where some still question the veracity of climate change in an ecozone already vulnerable to extreme weather parameters. Realizing that most houses and structures in the Midwest depend highly on the use of hydrocarbon generated natural gas for residential heating amidst the study area’s history of climatic variability from hot to extremely freezing temperatures. The driving habits of many citizens in the zone rake in lengthy milage on their trips while emitting huge volumes of noxious gases like GHGs. By showcasing this, the study not only reiterated the essence of socio-economic and geo-physical elements in the region’s climatic variability index, but it did indicate how the ecosystem could be impacted by these factors. Emphasizing these links considering the exclusion in past studies, keeps a major regional policy concern at center of climate change and coastal planning.4) Mix scale Approach Radiates EfficiencyBased on the outcome of the enquiry, the applications of mix scale methods stood out very extremely well in showing the trajectory of shifting climate research in the Midwest region. Applying descriptive statistics and GIS mapping as analytical tools under the template, inserted a fresh framework to carrying out a regional level analysis highlighting the growing impacts of climate change on relatively flat ecozones. Considering the ecological and socio-economic importance of the region’s cultural and physical and commercial, and agricultural landscape. Undoubtedly, the fiscal and ecological potential in the region under varieties of sectors from farming to automobiles, electric vehicles, households, heavy industrial machinery, commercial, energy, and electricity power usage reflect indices of changing climate relevant to the assessment. This covers a network of structures stretched over many states, counties and cities in the industrial heartland shaping daily activities that often leave in their wake climate change footprints experienced in the region. The adoption of mix scale model in standardizing the regional climate index, while displaying risk exposures from the dangers of sea level rise, the risks faced by human environment, GHGs emission, along with heat index and the monetary costs of crop damages from droughts over the various periods, echoes the effectiveness of the system. This approach was very efficient in delineating the study area, classifying the trends and in the assemblage of information on climate change under different indices. Stressing the visualization of climatic hazards from various parameters in that way is essential in the development of new ways to safeguard delicate ecosystems. The applications of a mix-scale technique involving mappings and the assemblage of climate change index, as analytic devices, thus improves common knowledge on the exposures of the region. Accordingly, practitioners in the region will be hard pressed to furnish quick answers to several important questions essential to shifting climate. The questions are as follows: How will shifting climate parameters affect water access? How will climate uncertainty impact transportation facilities across the region? What patterns will the geographic dispersion of climate risks assume? Are there other socio-economic and environmental elements likely to shape climate change? Building on these questions, ample possibilities exist for both practice and research to shift the emphasis on regional climate change action with thresholds underlining mitigation, adjustment, safeguard, and recovery. This will enable the stake holders in the sectors, the zone, the states, and cities increase their dedication towards climate change mitigation with better outcomes.
Appendix
Acronym
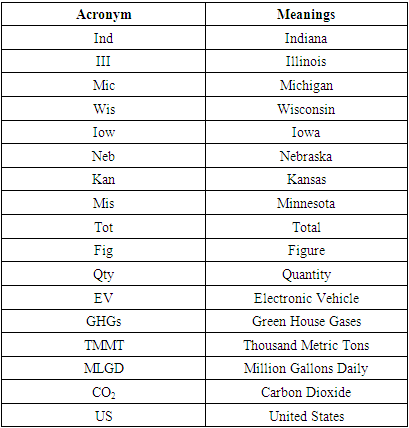 |
| |
|
References
| [1] | Merem, E.C. (2022 March a). Assessing Climate Change Risks In The US Midwest Region’s Environment. Paper Presented at the 86th Annual Mississippi Academy of Science Conference. Biloxi, MS. March 31-April 1, 2022. |
| [2] | Oppedahl, D. (April 2023) Climate Change and Risks to Midwest Agriculture. Chicago, IL: Federal Reserve Bank of Chicago. |
| [3] | NOAA (2013). Regional Climate Trends and Scenarios for the US National Climate Assessment. Part 3. Climate of the Midwest. NOAA Technical Report NESDIS 142-3. Washington DC: United States Department of Commerce. |
| [4] | US EPA (2014). Climate Change Indicators In The United States, 2014. Third edition. Washington, DC: United States Environmental Protection Agency (EPA). |
| [5] | NCA (2014). National Climate Assessment Summarizes The Impacts of Climate Change On the United States, Now and In the Future: Midwest. Washington, DC: National Climate Assessment. |
| [6] | USGCRP (2014). Projected Mid-Century Temperature Changes in the Midwest. Washington, DC: U.S. Global Change Research Program (USGCRP). |
| [7] | Pryor, S. C., D. (2014). Midwest. Climate Change Impacts in the United States: Chapter 18: The Third National Climate Washington, DC: U.S. Global Change Research Program, pp. 418-440. |
| [8] | City of Chicago. (2018). Climate Change Impacts Midwest Overview. Chicago: IL. Chicago City Government. |
| [9] | Hayhoe, K. (2019). Climate Change In The Midwest Projections of Future Temperature and Precipitations. Lubbock, TX: Texas Tech University. |
| [10] | Wei, J. (2013 August). Record-Breaking $17.3 Billion in Crop Losses Last Year; Significant Portion Potentially Avoidable. Chicago: IL. Natural Resources Defense Council. |
| [11] | NCA. (2014). Climate Change In The Midwest. Washington D.C.: U.S. Global Change Research Program. |
| [12] | City of Chicago. (2008): Climate Action Plan: Our City. Our Future. 57 Chicago, I.L: City of Chicago. |
| [13] | Gearino, D. (2019 November). Climate Change In The Midwest. Brooklyn, NY: National Environment Reporting Network. |
| [14] | Risky Business (2019). Heath In The Heartland Climate Change and Economic Risk In The Midwest. Retrieved 2023 March 28th From https://riskybusiness.org/report/heat-in-the-heartland-climate-change-and-economic-risk-in-the-midwest/. |
| [15] | Nikie, C. (2019). Summer Climate Change In The Midwest and Great Plains Due to Agricultural Development During the Twentieth Century. American Meteorological Society. Philosophical Transactions of the Royal Society, Mathematical, Physical, and Engineering Sciences. |
| [16] | Hart, C. (2020 April). Preparing For Climate Change in the Midwest and Great Lakes Region: A Primer for Citizens and Community Leaders Policy. Notre Dame, IN: Pulte Institute For Global Development, University of Notre Dame Indiana. |
| [17] | Gist staff (2018). We Broke Down What Climate Change Will Do, Region by Region. Retrieved 2023 March 28th From https://grist.org/cities/we-broke-down-what-climate-change-will-do-region-by-region/. |
| [18] | Kunkel, K. E. (2010). The Response of Great Lakes Water Levels to Future Climate Scenarios with An Emphasis On Lake Michigan-Huron. Journal of Great Lakes Research, 36:51-58. |
| [19] | Grzegorek, V. (2021). National Climate Assessment. Clevland, OH: The Cleveland Scene Press Club. |
| [20] | Chicago Tribune Staff (2019 August). How Will Climate Change Affect Chicago and The Midwest? Here’s. The Chicago Tribune. |
| [21] | Kerber, B. (2021 November). The Midwest Leads U.S. Emissions, Here’s Why By. Fresh Energy, St. Paul Minnesota. Retrieved 2023 March 28th From http https://fresh-energy.org/the-midwest-leads-u-s-emissions-heres-why. |
| [22] | Scott, W. (2020 November). Meteorological Tsunami. The U.S. Fight Against Climate Change Has to Start at Its Center: The Midwest. Slate Magazine. |
| [23] | Wambsgans. E. J. (2019). Flooded Neighborhood Along The Rock River in Roscoe, Ill., on March 19, 2019. Chicago Tribune. |
| [24] | Fitzpatrick C. (2019. The Midwest Climate In 60 Years. Inside Climate News. |
| [25] | Tatsuhiko, S. (2021 April). Meteorological Tsunami Generation Due To Sea Surface Pressure Change Three Dimensional Theory and Synthetics of Ocean Bottom Pressure. JGR Oceans. 126:5. |
| [26] | Eller, D. (2019). Climate Change-Driven 'Midwest Water Hose' Caused Massive 2019 Flooding in Iowa, Elsewhere, UI researchers Find. Des Moines Register. |
| [27] | USGCRP (2014) Chapter. 9: Human Health. Climate Change Impacts In The United States: The Third National Climate Assessment. Washington D.C.: U.S. Global Change Research Program. |
| [28] | USGCRP (2014). Chapter. 5: Transportation. Climate Change Impacts In The United States: The Third National Climate Assessment. Washington D.C.: U.S. Global Change Research Program, 130-149. |
| [29] | Bai, X., (2012). Atmospheric Teleconnection Patterns Associated with Severe and Mild Ice Cover on The Great Lakes, 1963–2011. Water Quality Research Journal of Canada. 47: 421–435. |
| [30] | Millerd, F. (2011) The Potential Impact of Climate Change on Great Lakes International Shipping. Climatic Change, 104: 629-652. |
| [31] | Ferris, G. (2009). State of the Great Lakes 2009. Climate change: Ice Duration On The Great Lakes. Environment Canada and United States Environmental Protection Agency. Washington, DC: US EPA. |
| [32] | US EPA (2012). Great Lakes: Basic Information. Washington D.C.: United States Environmental Protection Agency. |
| [33] | USGCRP (2014). Chapter 6: Agriculture. Climate Change Impacts in the United States: The Third National Climate Assessment, Washington, DC: U.S. Global Change Research Program. pp 150-174. |
| [34] | USGCRP (2009). Global Climate Change Impacts in the United States. New York, NY: USA. United States Global Change Research Program. Cambridge University Press. |
| [35] | Meyers, T. (2008) The 2007 Eastern US Spring Freezes: Increased Cold Damage In a Warming world. BioScience, 58: 253-262. |
| [36] | Hatfield, J. L. (2011). Climate Impacts On Agriculture: Implications For Crop Production. Agronomy Journal, 103, 351-370, |
| [37] | Merem, E. C. (2023 March). Assessing The Potentials of Cotton Land Use In Sudan. Paper Presented at the Conference of Minority Public Administrators (COMPA). Baltimore Mary land, MD. March 2- 5, 2023. |
| [38] | Merem, E. C. (2023 March). The Environmental Impacts of Farm Subsidy in California’s South-Central Region. Paper Presented at the 32nd Annual International (West Coast) Conference on Soil, Water, Energy, and Air (AEHS). San Diego, CA. March 20-23, 2023. |
| [39] | Merem, E. C. (2023 March). Assessing Climate Change Impacts In The US Pacific North West Region. Paper Presented at the 97th Annual Louisiana Academy of Science Conference. LSU Alexandria, LA. March 4th, 2023. |
| [40] | Merem, E. C. (2023 March). The Assessment of Climate Change Risks In Maryland’s Southern Region. Paper Presented at the 87th Annual Mississippi Academy of Science Conference. Biloxi, MS. March 23, 2023. |
| [41] | Merem, E. C. (2023 April). Analyzing Issues in Water Resource Management Within the US Northeast Zone. Paper Presented at The National Water Quality Monitoring Council Conference. Virginia Beach, Virginia, April 24 – 28 |
| [42] | Merem, E. C. (2023 May-June c). Assessing Climate Change Risks In The US Midwest Region’s Environment. Unpublished Draft Paper. Jackson, MS: Department of Urban and Regional Planning. Jackson State University. |
| [43] | United States Census Bureau (2022). US Census Quick Facts. Washington, DC: United States Census Bureau. |
| [44] | Upper Midwest Environmental Sciences Center (2020). ThinkQuest: Education Foundation. Retrieved 2023 March 28th From http://library.thinkquest.org/4552/newpage3.htmOracle. |
| [45] | Adam, A. (2020 March). Corn Belt. Region, United States. Chicago, IL: Encyclopedia Britannica, Inc. |
| [46] | Todey, D. (2017 October). Agriculture In the Midwest; the Midwest Climate Hub-. Washington, DC: Climate Hubs. United State department of Agriculture (USDA). |
| [47] | Merem, E. (2021b). Assessing Water Resources Issues In US Midwest Region. Abstract submitted to 2021’ COMPA Conference, Dallas. TX |
| [48] | Burnett, A.W. (2003). Increasing Great Lake-Effect Snowfall During The twentieth Century: A Regional Response To Global Warming. Journal of Climate 16:3535–3542. |
| [49] | NOAA (National Oceanic and Atmospheric Administration). (2021). Great Lakes Environmental Research Laboratory: Historical Ice Cover. Washington, DC: NOAA. |
| [50] | NOAA (National Oceanic and Atmospheric Administration). (2019). Great Lakes Environmental Research Laboratory: Historical Ice Cover. Washington, DC: NOAA |
| [51] | Bai, X., J. (2012). Interannual variability of Great Lakes ice cover and its relationship to NAO and ENSO. Journal of . Geophysics. Res. 117:C03002. |
| [52] | Merem, E. C. (2018 February). Assessing Water Resource Issues In The US Pacific North West Region. Proceedings of The 2018 Mississippi Political Science Conference (MPCC), Jackson: MS. February 2018. |
| [53] | Merem, E.C. (2021). Analyzing the Use of Genetic Modified Organisms (GMOs) In Agriculture In The US Midwest Re-gion. Food and Public Health. 11:1: 1-17. |
| [54] | Merem, E.C. (2020). Analyzing Organic Food Farming Trends in The US Western Region. Public Health Research. 10:2: 41-57. |
| [55] | Merem, E. C. (2021). The Regional Assessment of Groundnut Farmland Use in Northern Nigeria. International Journal of Food Science and Nutrition Engineering, 11:1:1-19. |
| [56] | Merem, E.C. (2020). Evaluating Geothermal Energy Potentials In The US Western Region With GIS. International Journal of Engineering. 10:2: 23-40. |
| [57] | Merem, E. C. (2020). Issues In Transboundary Water Use In The River Nile Basin Area of Africa. World Environment. 10:2: 27-44. |

 Abstract
 Reference
 Full-Text PDF
 Full-text HTML