-
Paper Information
- Paper Submission
-
Journal Information
- About This Journal
- Editorial Board
- Current Issue
- Archive
- Author Guidelines
- Contact Us
American Journal of Environmental Engineering
p-ISSN: 2166-4633 e-ISSN: 2166-465X
2022; 12(1): 1-8
doi:10.5923/j.ajee.20221201.01
Received: Apr. 17, 2022; Accepted: May 6, 2022; Published: May 24, 2022

Estimation of Drag Coefficient in a Meandering Gravel- Bed River with Vegetated Banks
 Abstract
 Reference
 Full-Text PDF
 Full-text HTML
Sina Sohrabi1, Hossein Afzalimehr1, Vijay P. Singh2
1Dept. of Civil Engineering, Iran Univ. of Science and Technology, Narmak, Tehran, Iran
2Regents Professor and Caroline & William N. Lehrer Distinguished Chair in Water Engineering, Dept. of Biological and Agricultural Engineering and Zachry Dept. of Civil & Enviv. Engineering, Texas. A&M Univ., College Station, TX, USA
Correspondence to: Hossein Afzalimehr, Dept. of Civil Engineering, Iran Univ. of Science and Technology, Narmak, Tehran, Iran.
| Email: |  |
Copyright © 2022 The Author(s). Published by Scientific & Academic Publishing.
This work is licensed under the Creative Commons Attribution International License (CC BY).
http://creativecommons.org/licenses/by/4.0/

This paper investigates the effect of hydraulic parameters in the flow resistance estimation in a meander river with gravel bed and vegetated banks. Data collection was carried out in a meandering reach in the river Deryouk located in northern Iran. The selected reach was 28 m long and with large aspect ratio (large width /small flow depth). In addition, eight cross sections of this reach were selected to measure 29 velocity profiles and the main geometric parameters. Results showed that for a large aspect ratio, the maximum velocity occurs under the water surface near the vegetated bank. Disorder velocity profiles were observed more in the regions with dense vegetation canopies. The parabolic method can be used to estimate shear velocity near the vegetated banks for all cross sections. Drag coefficient changes considerably with the vegetation density along the selected meandering reach. The Reynolds number shows an inverse relation with drag coefficient.
Keywords: Flow resistance, Drag coefficient, Vegetated bank, Parabolic method, Shear velocity
Cite this paper: Sina Sohrabi, Hossein Afzalimehr, Vijay P. Singh, Estimation of Drag Coefficient in a Meandering Gravel- Bed River with Vegetated Banks, American Journal of Environmental Engineering, Vol. 12 No. 1, 2022, pp. 1-8. doi: 10.5923/j.ajee.20221201.01.
Article Outline
1. Introduction
- River restoration and fluvial processes determine riparian zone of rivers. Rivers stability and effects of climate change on rivers are the most remarkable issues about river management. However, the changes which made by human on the morphodynamics of the rivers usually may play opposite effect on River restoration and management. For example, removing the vegetation of river bank is one of the common solution for decreasing the probability of flood risk. However, the vegetation can reduce the flow velocity, decreasing the transport sedimentation and erosion within the vegetated patch (Green, 2006; Luhar et al., 2008; Nepf and Ghisalberti, 2008; Nikora et al., 2008; Zong and Nepf, 2010; Meire et al., 2014). The vegetated banks have much stability than the bare banks (Afzalimehr and Dey, 2009; Pollen and Simon, 2005). Rivers, especially in mountain regions develop a winding course rather than straight path (Camporeale et al., 2005; Mohanty et al., 2022). Therefore, investigate the flow resistance in meandering rivers is important.Vegetation canopy deflect the flow towards the bare bed and banks increasing the average flow velocity at these regions. The average velocity decreased around and within the vegetation canopy and the lateral gradients velocity occurs in banks of sections with vegetation and without canopy, generating the extreme shear layer at the banks (Johannesson and Parker, 1989). On the other hand, secondary flow occurred in meandering rivers affect the velocity and shear velocity values which calculate the resistance to flow. Also, the velocity distribution changes near the vegetated banks generating the dip phenomenon near the vegetated bank (Afzalimehr and Dey, 2009). Many researchers, (e.g., Liu and et al., 2016; Li and et al., 2021), reported that the vegetation affects the secondary flows, turbulence intensities and Reynolds shear stresses in meandering rivers. Interaction of the primary and the secondary flows on the velocity distribution in meandering rivers, provide probability of growing the submerged and emergent canopies and deposition along the river banks. Flow resistance is the one of the most key topics in the river engineering to use in the hydraulic and hydrodynamics calculations related to the hydraulic structures design, bed forms changes, flooding management, deposition and sediment transport patterns. Generally, the flow resistance of rivers depends on the bed and banks conditions. Therefore, vegetated banks impact on the flow resistance, drag force and erosion around them (Järvelä, 2002; James et al., 2008; Tahershamsi et al., 2018). Also, the presence of the canopies along the floodplain causes extra flow resistance changing deposition and sediment transport rate in the meandering rivers (Ismail and Shiono, 2006).The objective of this study is to estimate drag coefficient along a meandering reach with gravel bed and vegetated banks by applying the parabolic law.
2. Materials and Methods
- The experimental data were measured in Deryouk river in the northern Iran. This gravel bed meandering river is located 40 kilometers away from the Amol city in the north of Iran. A reach with 28m length where started at end of bending section selected for estimating the flow resistance in this reach of river with vegetated banks. In addition, eight cross sections for the selected reach was used to measure the vertical velocity distribution (Fig. 1). The vegetated banks are prevalent along the both side of the reach with different densities. However, density of canopies get lower at the outer bank of the meander. Because of the impact of vegetation on the point velocities, the selected cross sections for measuring the velocity vertical distribution placed at 0.2, 1.55, 3.8, 7.71, 10.63, 17.28, 23.95 and 24.5 m away from beginning of the reach (Fig. 2). The aspects ratio (width/flow depth ratio) of the selected cross sections was in the range between 23 and 30.
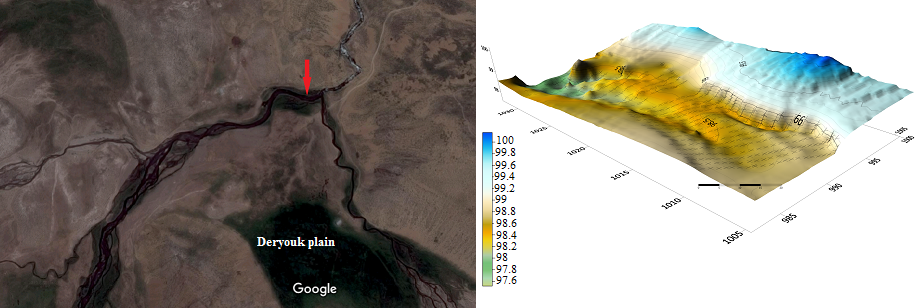 | Figure 1. Location of Deryouk river and plan of the selected reach |
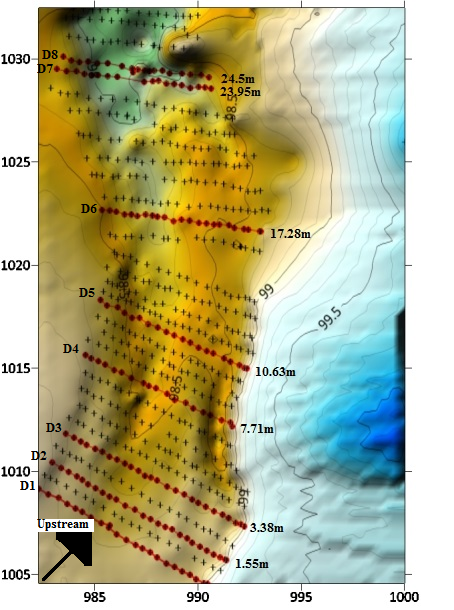 | Figure 2. Cross sections to measure data |
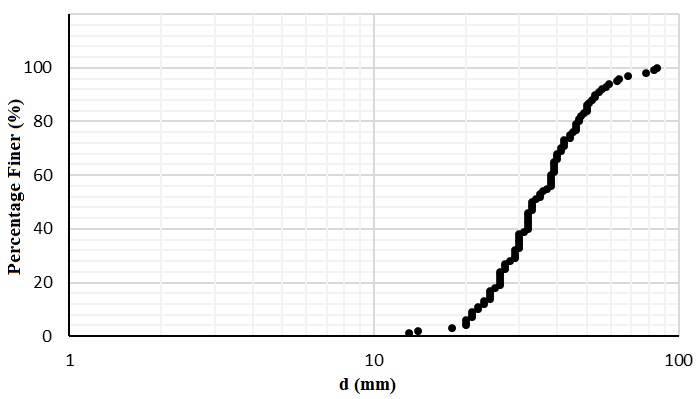 | Figure 3. Grain size of distribution |
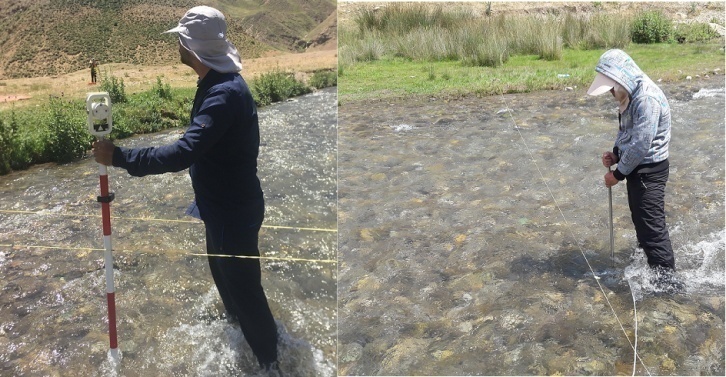 | Figure 4. Velocity measurement in the reach with vegetated banks |
2.1. Estimate Flow Resistance
- In this study, the flow resistance in the present of vegetated banks were estimated by the equation (1) as follows:
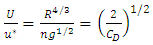 | (1) |
 is the shear velocity, R is the hydraulic radius, g is the gravity acceleration, n is the Manning coefficient and CD is the drag coefficient. The mean velocity of each cross section was calculated by the velocity measurements at each cross section axis (up) and then the cross sectional mean velocity (U) was calculated as follows:
 | (2) |
2.2. Shear Velocity Methods
- The shear velocity of each cross section was calculated by two methods in this study, the boundary layer characteristics method and the parabolic law.
2.2.1. Boundary Layer Characteristics Method
- In this method (Azalimehr and Anctil, 2000), all the point velocities in each profile are used to calculate shear velocity
 as follows:
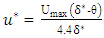 | (3) |
 and the momentum thickness of boundary layer (ϴ) are calculated by equation (4) and (5), respectively.
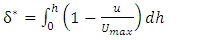 | (4) |
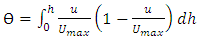 | (5) |
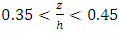
2.2.2. Parabolic Method
- Each velocity profile can be divided in two regions, the inner and the outer. The near region composes of 20% of the bed near the bed and the outer region is formed by 80% near the water surface. Afzalimehr and Anctil 1999 and 2000 showed that the inner region data can be presented by the logarithmic law and the outer one by the parabolic law. The logarithmic law gets deviated after the edge of the inner and outer region of the boundary layer of the velocity profile, especially in the presence of the vegetation canopies. Since this study investigates the effect of the bank vegetation on the flow resistance and the near bed region in gravel-bed rivers is not easy to measure by the current-meter, the shear velocity can be calculated the velocity data in the outer region of the boundary layer as follows:
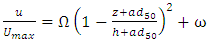 | (6) |
 and
and  of the equation (6). Where
  is a coefficient equals to the slope of this regression., z is the point distance from the bed, d50 is the median diameter of sediment particles, h is the depth of velocity profile, a is modification coefficient of the parabolic law equal 0.2 in this study and the
  is the constant coefficient which equals to intercept of the regression formed between
  and
and  It is assumed that the variation of bed along the reach is negligible and the flow is steady. Along no change occurs in the vegetation size and the flow condition during the measuring period.
3. Results and Discussion
3.1. Hydraulic Parameters
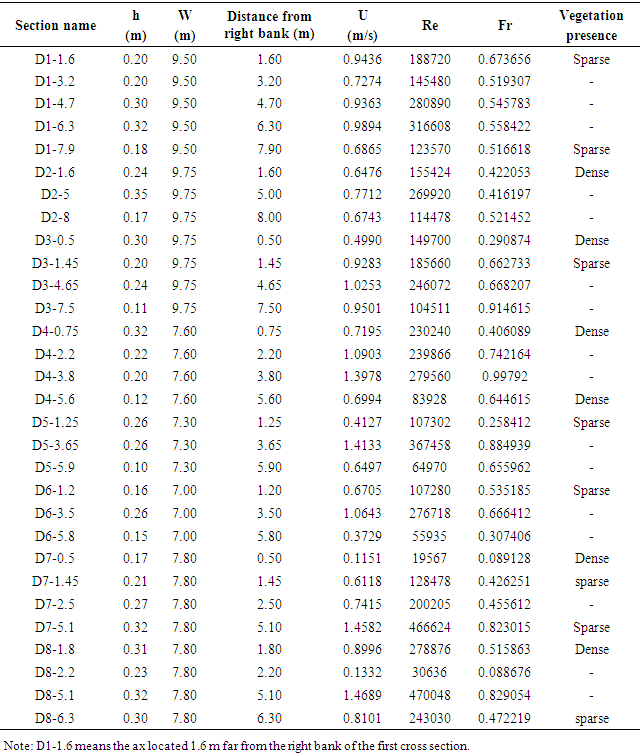
- Eight cross section were selected in this experimental study to measure the mean velocity points. The measured and calculated parameters in each cross section are mean velocity (U), depth (h), cross section width (W), Reynolds number
 which D is the hydraulic depth which is considered as the flow depth in the channels with large aspect ratio and Froude number
  (Table 1). Reynolds number and Froude number in all cross sections, show that the flow is turbulence and subcritical flow.
|
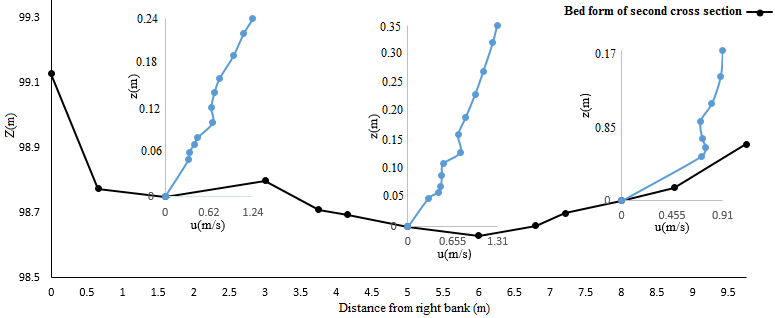 | Figure 5. Velocity profiles of the second cross section |
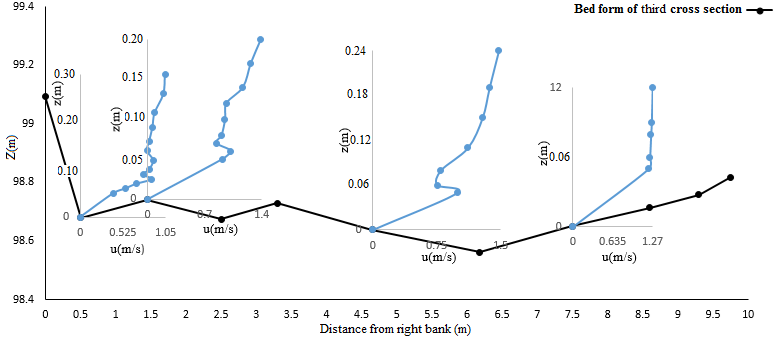 | Figure 6. Velocity profiles of the third cross section |
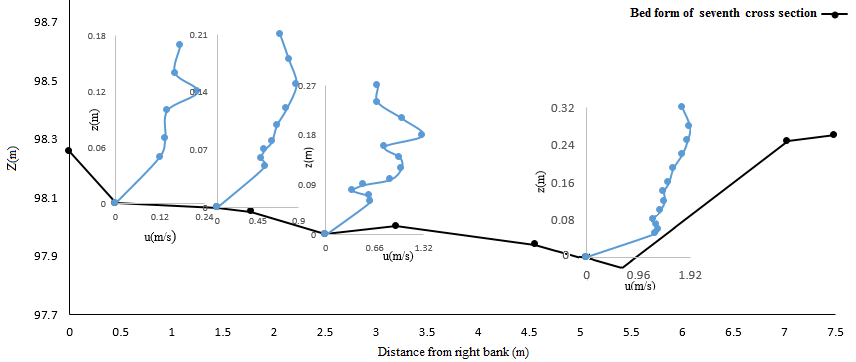 | Figure 7. Velocity profiles of the seventh cross section |
 . However, the vegetation in the banks causes the inflexion point moves to higher depth from the bed. Also, the dip phenomenon (the ratio of width to flow depth) occurs near the right bank of the seventh cross section where the dense vegetation is prevalent (figure 7). At the third cross section, the axis with 0.5m distance from the right bank, D3-0.5, was located near the dense vegetated bank where due to strong secondary currents, the mean velocity U=0.5 m/s, is lower than other axis of this section. The secondary flow dominates in lateral direction and the maximum velocity occurs at axis 4.65m away from the right bank, U=1.03 m/s. The flow depth gets low near the left bank of the third cross section and the flow velocity increases suddenly for this region. Also, in this region (axis, D3-7.5), the turbulence is high and the Froude number is Fr=0.9146, which is close to the critical conditions, leading to a specific velocity distribution which is different from those observed in gravel-bed rivers. One meter upstream of the right bank of the seventh cross section placed a boulder and vegetation density was high around it. After the boulder and the vegetation canopies, the width of the river gets smaller and so that velocity increases at the seventh cross section, except axes which is located 1.5 meter away from the right bank. The lateral velocity gradient is high in the seventh cross section, forcing the strong shear layer emerges around the 1.5-2 m distance from the right bank. Therefore, the velocity profile of axis of 2.5 m distance of the right bank, D7-2.5, shows much disorders and the maximum velocity falls below the water surface,
  .
.3.2. Shear Velocity
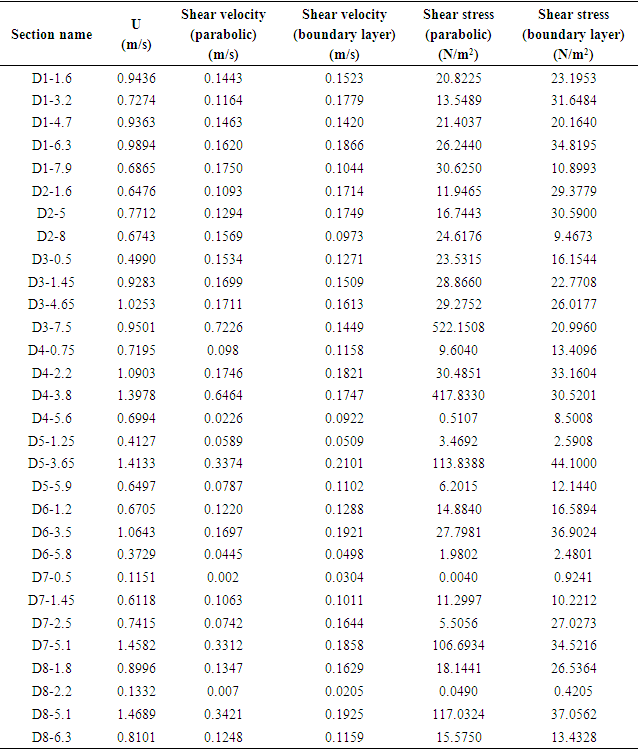
- As mentioned in section 2.2., the boundary layer characteristics method and the parabolic method were used to calculate shear velocity in this study. Results show that the parabolic method is acceptable with R2>0.95, in the outer region of the boundary layer of the measured velocity profiles. However, the correlation coefficient of the velocity profiles used for the parabolic method decreases near the vegetated banks. Figure 8 shows the application of the parabolic method for the measured velocity profiles. As is clear from the figure 8b, the outer layer of the velocity profile of the seventh cross section near the right bank, D7-1.45, did not follows the parabolic method as good as outer regions of the velocity profiles which weren’t near the dense vegetation, e.g., D6-3.5.
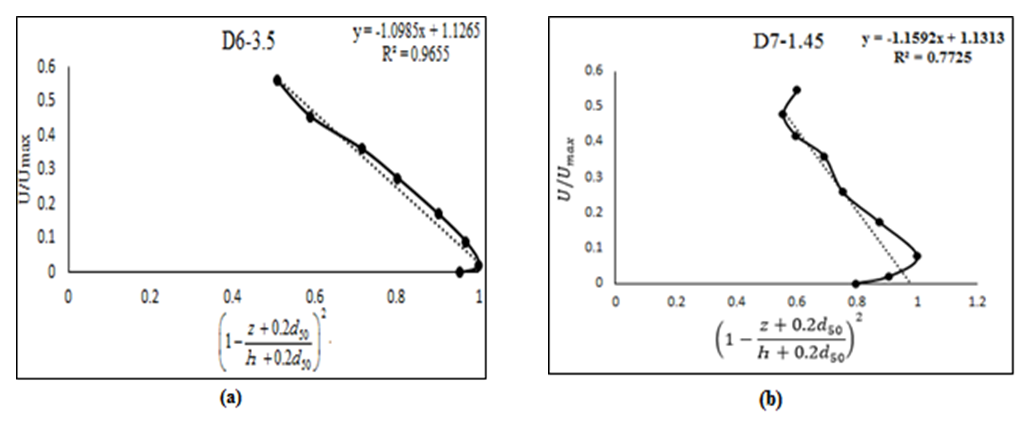 | Figure 8. The application of parabolic method with and without vegetated banks |
 , of the selected reach are presented in table 2. Because of the low vertical velocity gradient, the shear velocity and shear stress near the vegetated bank are lower than other axis of each cross section. Also, the bank stability of these region was higher than other regions. Therefore, the width of cross section where the vegetated bank is prevalent shows smaller than other cross sections.
|
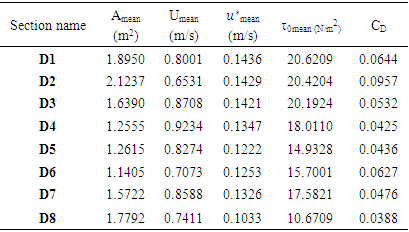
3.3. Estimate Flow Resistance
- In this study, the drag coefficient was considered as the flow resistance parameter. After calculating the mean velocity and the shear velocity of each cross section and according to the equation 1, the drag coefficient was determined (table 3). Results reveals that the maximum drag coefficient occurs at the second cross section where the density of vegetation on the both banks are high and the mean velocity is minimum. It is known that the drag coefficient increases as the mean velocity decreases. Also, the Reynolds number affects the drag coefficient and there is an inverse relation between them. Based on our field observations the reason the opposite behavior is that the flow infiltrates below the banks and in high flow conditions, the erosion risk gets high in cross sections without the vegetated banks. However, the vegetated banks remain still stable because of the presence of the dense vegetation and increasing in the flow resistance.
|
4. Conclusions
- The flow resistance estimation is investigated for meandering reach with vegetation banks located in northern Iran. Results show that near the vegetation with different density, the disordered velocity distribution along the meandering reach. The inflexion point of velocity profiles moves toward the water surface,
 in the presence of the vegetated banks. Also, for large aspect ratio in the selected reach
  the maximum velocity occurs under the water surface in the presence of the vegetation canopies, enhancing the secondary currents generation across of each section. The parabolic method can be applied to calculate shear velocity near the vegetation banks, however, the correlation coefficient reduces due to difficult conditions to a complex interaction of vegetation-gravel bed in the meandering reach. The additional exerted drag of the vegetation canopies increases the flow resistance. Drag coefficient varies from 0.0338 to 0.0644 depending on vegetation density. Therefore, the largest drag coefficient belongs to the second cross section where the dense vegetation is prevalent in this field study. Also, there is an inverse relation between the Reynolds number and drag coefficient. The results of this study shows that estimation of the flow resistance by using a method which uses the velocity data far from the bed and near the vegetated banks, the parabolic law, can help to obtain better application drag coefficient in hydraulic models.