-
Paper Information
- Paper Submission
-
Journal Information
- About This Journal
- Editorial Board
- Current Issue
- Archive
- Author Guidelines
- Contact Us
American Journal of Environmental Engineering
p-ISSN: 2166-4633 e-ISSN: 2166-465X
2021; 11(2): 21-25
doi:10.5923/j.ajee.20211102.01
Received: Sep. 25, 2021; Accepted: Oct. 11, 2021; Published: Nov. 15, 2021

Ground Water Content Measurement of Total Dissolved Solid in the Area Around Sumberwaru Village, Situbondo Regency, East Java
 Abstract
 Reference
 Full-Text PDF
 Full-text HTML
1Department of Physics, Brawijaya University, Malang, Indonesia
2Department of Biology, Brawijaya University, Malang, Indonesia
Correspondence to: Wiyono, Department of Physics, Brawijaya University, Malang, Indonesia.
| Email: |  |
Copyright © 2021 The Author(s). Published by Scientific & Academic Publishing.
This work is licensed under the Creative Commons Attribution International License (CC BY).
http://creativecommons.org/licenses/by/4.0/

The geographical location owned by Situbondo Regency has a coastal area, which could have the potential for seawater contamination of many particle of solids for example Calcium, Sulfur etc.. Therefore, this study aims to explore water resources, namely groundwater in a coastal area of Situbondo Regency - Banyuwangi Regency, which can be used to determine the feasibility of life, especially for humans and animals. In the distribution of Total Dissolved Solid, it was found that there was the highest TDS value in the northwest and east directions of the study site, with values ranging from 235 to 696 mg/L. From groundwater depth measurements, it was found that the further south the research location is, the deeper the depth will be. while for the pH value, it was found that the value ranged from 7.2 to 7.84, with an average of 7.54. For future improvements, it is necessary to carry out further research along the road from Situbondo District - Banyuwangi Regency to obtain a wider picture.
Keywords: Groundwater, TDS (Total Dissolved Solid), pH (power of Hydrogen)
Cite this paper: Wiyono, Jati Batoro, Ground Water Content Measurement of Total Dissolved Solid in the Area Around Sumberwaru Village, Situbondo Regency, East Java, American Journal of Environmental Engineering, Vol. 11 No. 2, 2021, pp. 21-25. doi: 10.5923/j.ajee.20211102.01.
Article Outline
1. Introduction
- Situbondo is a regency located on the north coast of Java Island, in the horseshoe area. this area is surrounded by tobacco, sugar cane plantations, Baluran protected forest, and fishing business locations. Situbondo has an area of 1,693 km2 with geographic conditions bordering the sea and also surrounded by mountains. This regency is located at an altitude of 0 to 1,250 masl.The need for water resources is very important, because humans will not be separated from the need for water energy to sustain even animals. From the preliminary survey conducted by previous research, from the results of observations of researchers and also dialogue with the coastal community of Situbondo, the use of local groundwater is very much needed for life both by local communities or animals and also agriculture. Therefore, this study aims to explore air resources, namely groundwater in a coastal area of the Situbondo Regency - Banyuwangi Regency, which can be used to see the feasibility of life, especially for humans and animals. TDS content of ground water can be in the form of particles of Calcium, Sulfide and others depending on the geological conditions of the research area and the more that is contained because there are large particles of TDS, the more dissolved Calcium is not always the other [1].Based on research on groundwater modeling on the coast of Laizhou Bay, China, it was found that over time, groundwater chlorinity fluctuated slightly at monitoring points away from the coast, but there was an increasing trend. Groundwater chlorinity fluctuates significantly at the nearshore monitoring point and shows an increasing trend. Drought caused by a sudden drop in mean monthly rainfall in February and March 2015 resulted in insufficient groundwater supply, damaged hydrodynamic balance, and severe intrusion of seawater; As a result, groundwater chlorinity increases rapidly. Groundwater chlorinity decreases with increasing distance from the coast. Except for irregular fluctuations due to the long drought in 2015, groundwater chlorinity fell to freshwater levels when the distance from the coast was 2000 m. Over time, the seawater intrusion area gradually approached the land, and the cross-distribution of the intrusion area was uneven. In this study, the degree of seawater intrusion was observed by monitoring the chlorinity of groundwater along the coast of Laizhou Bay and analyzed the causes of seawater intrusion which is a reference for prevention and control of disasters of seawater intrusion [2].Based on this background and the absence of research conducted in the area around the Situbondo Regency, especially those related to the effect of seawater on groundwater. So, this research was carried out by taking samples of groundwater or well water using parameters, namely TDS and pH of groundwater (well water).
2. Research Method
2.1. Research Location
- Sampling was carried out in the morning to evening during working hours. For measurement of groundwater, content is carried out in the laboratory and to avoid errors given labeling each bottle of the water sample obtained. This research was conducted in the dry season, namely in July to August 2021.Selection of sampling points in the area around the coast, to the area away from it, namely the area south of the sampling point. The sampling points are shown in Figure 1 and Figure 3.From the research location as shown in the Figure 2, it is a rice field. And the discussion from several people also said that it is suitable for rice to be planted here.
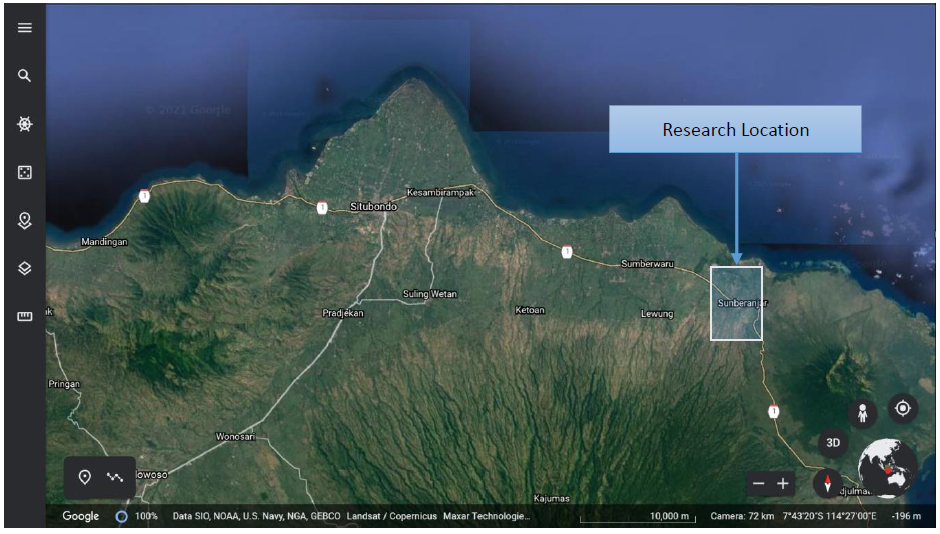 | Figure 1. Research Location |
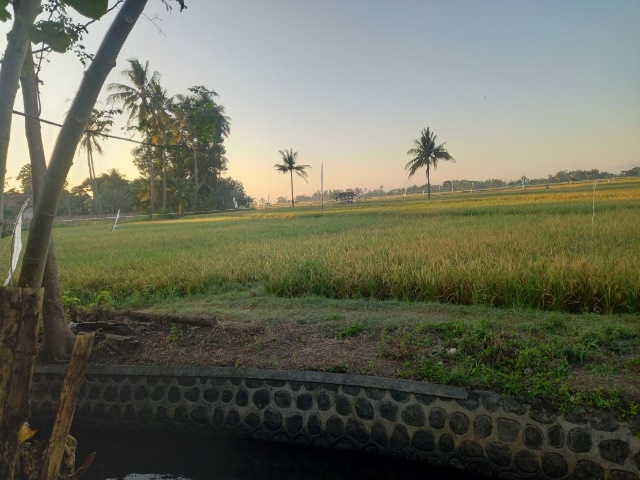 | Figure 2. Research location adjacent to Rice Field |
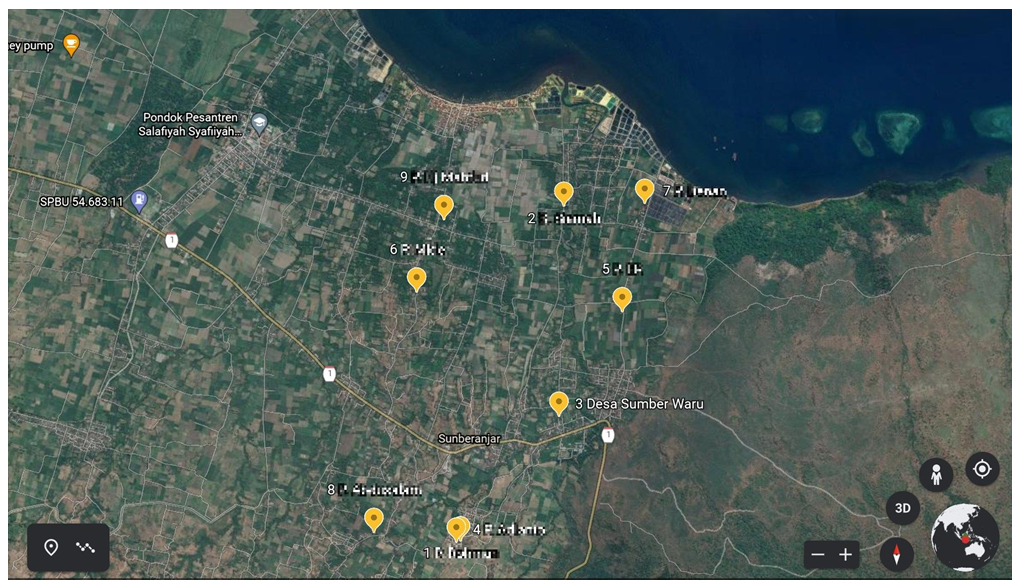 | Figure 3. Location of water sampling points |
2.2. Research Design
- This research is a quantitative and qualitative experimental study, where water samples are obtained directly from the residents around the Pesisir, Situbondo Regency, then measured their quality by its TDS and pH. Then for making contour maps we use the Surfer application with 3 main colors that distinguish the level of value [3].
2.3. Tools and Materials
- The tools and materials used in this research are as follows:1. 600ml sample bottle2. Measuring rope3. TDS meter4. pH meter5. Surfer® [3]
2.4. Research Variable
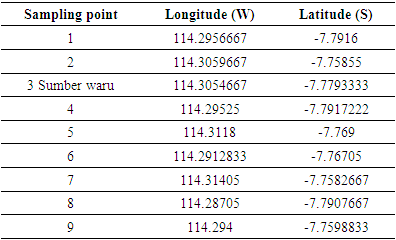
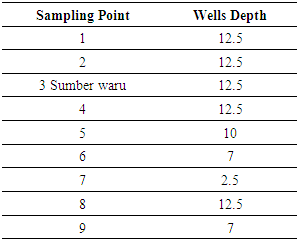
- The variables in this study are parameters including TDS value and pH value. The data in this study are primary data obtained from direct sampling around the coast of the Situbondo Regency.Then for the coordinates of the water sampling point can be seen at Table 1.
|
3. Result and Discussion
- Based on the Table 2 above, it can be seen that the difference in well water belonging to the residents varies with an average depth value of 9.88. meters below the water surface. And for the standard deviation value of 3.42 meters, which means the measurement variation is ±11.7 meters.
|
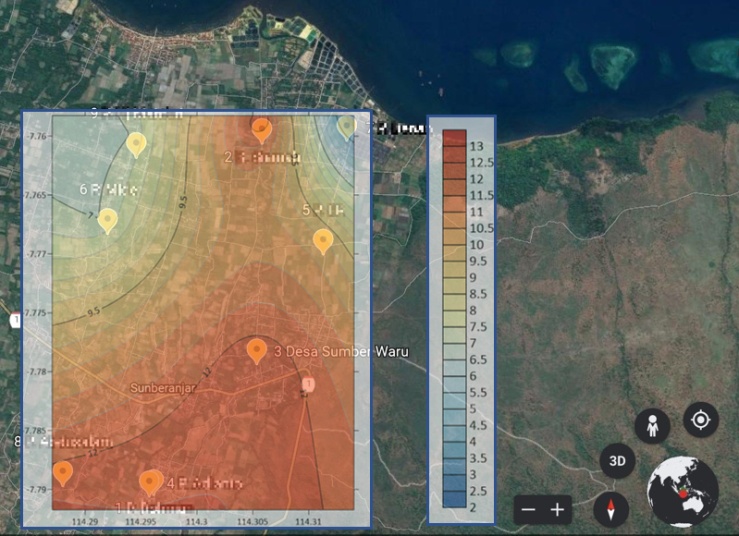 | Figure 4. Contour Map of the well water depth on research location |
3.1. TDS
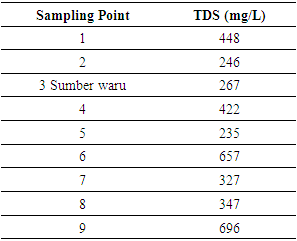
- In this parameter, measurements are taken in the laboratory of Geophysics University Brawijaya using a TDS Meter to measure the TDS value in groundwater, which is shown in Table 3.
|
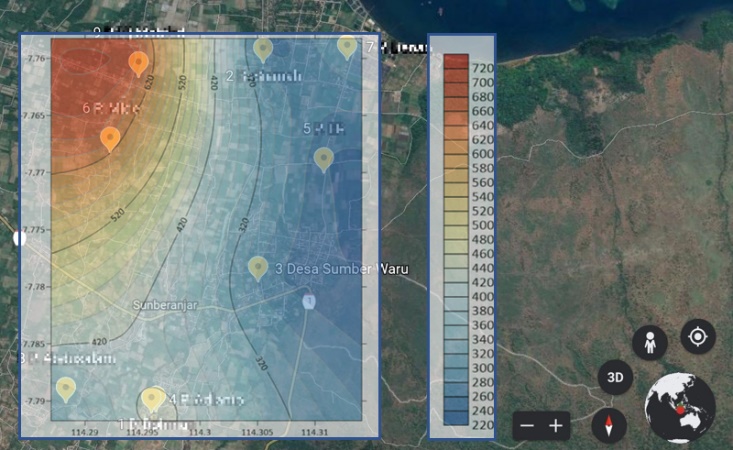 | Figure 5. Contour Map of TDS on research site |
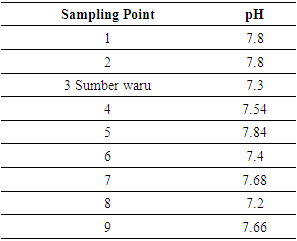
3.2. pH
- The degree of acidity is used to determine the nature of the acid and base of a substance or solution. Changes in pH in a body of water greatly affect the process of physico-chemical and biological reactions of various organisms that live in it. The degree of acidity also affects the toxicity of pollutants and the solubility of some gases in the formation of substances in the water. The pH value of water is used to describe the acidity or concentration of hydrogen ions in water. The pH scale ranges from 1-14. The pH range of 1-7 includes acidic conditions while pH 7 is a neutral condition.Using a pH meter to measure the pH value in groundwater, the value shown in Table 3.
|
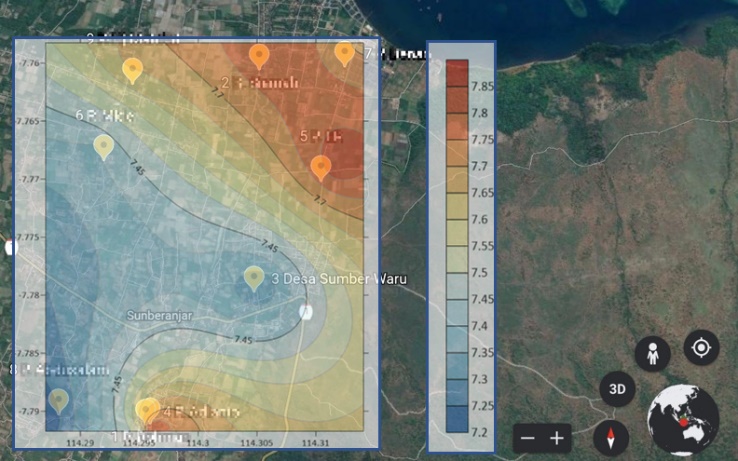 | Figure 6. Contour Map of pH on research site |
4. Conclusions
- Based on the TDS parameter in Table 3, it was found that values ranging from 235 to 696 mg/L For the results of well water owned by residents, it still meets the standard threshold value for drinking water.Then, based on the pH value parameter in Table 4, Based on the table above, it can be seen that pH value from well water owned by residents and sea water is between 7.2 to 7.84. Therefore, in general, it can be assumed that The residents's well water can still be used as drinking water.Further research is needed to obtain more geoelectric data so that it can cover a wider area.