-
Paper Information
- Paper Submission
-
Journal Information
- About This Journal
- Editorial Board
- Current Issue
- Archive
- Author Guidelines
- Contact Us
American Journal of Environmental Engineering
p-ISSN: 2166-4633 e-ISSN: 2166-465X
2021; 11(1): 1-12
doi:10.5923/j.ajee.20211101.01
Received: Jan. 4, 2021; Accepted: Feb. 3, 2021; Published: Feb. 22, 2021

Variability of Wind Energy in Cameroon Based on Gamma Distribution
 Abstract
 Reference
 Full-Text PDF
 Full-text HTML
Raphaël Tagne1, Christian Kenfack-Sadem2, François Beceau Pelap1, Bawe Gerard Nfor1
1Unité de Recherche de Mécanique et de Modélisation des Systèmes Physiques (UR-2MSP), Faculty of Science, Department of Physics, University of Dschang, Dschang, Cameroon
2Condensed Matter Physics and Nanomaterials, Faculty of Science, Department of Physics, University of Dschang, Cameroon
Correspondence to: Christian Kenfack-Sadem, Condensed Matter Physics and Nanomaterials, Faculty of Science, Department of Physics, University of Dschang, Cameroon.
| Email: |  |
Copyright © 2021 The Author(s). Published by Scientific & Academic Publishing.
This work is licensed under the Creative Commons Attribution International License (CC BY).
http://creativecommons.org/licenses/by/4.0/

This study focuses on statistical analysis of the mean monthly, annual and interannual variability of wind speed data in Cameroon for the years 2000 to 2017. The potential and characteristics of wind energy were determined based on the Gamma probability density function (PDF). The wind speed data were collected from ERA-Interim measured at 10 m above ground level (A.G.L). The results show that apart from the Lake Chad Basin and the Gulf of Guinea (GoG) where highest wind speeds and wind power densities not exceeding class 2 are observed due to the influence of the Harmattan and the Monsoon, almost the entire study area presents low and relatively constant wind speeds and power densities belonging mainly to class 1 during all seasons. Qualitative and quantitative comparisons of theoretical power (TP) with that based on Gamma PDF show that they are closely related.
Keywords: Wind speed data, Gamma distribution, Power density, Goodness of fit test
Cite this paper: Raphaël Tagne, Christian Kenfack-Sadem, François Beceau Pelap, Bawe Gerard Nfor, Variability of Wind Energy in Cameroon Based on Gamma Distribution, American Journal of Environmental Engineering, Vol. 11 No. 1, 2021, pp. 1-12. doi: 10.5923/j.ajee.20211101.01.
Article Outline
1. Introduction
- Due to an increase in human population, in an era of industrialization and depletion of fossil fuel, there is increased energy needs. These energy needs, coupled with concerns such as energy independence and sustainability, security, environmental protection has been at the center of most government policies. A practical way of overcoming the above-mentioned concerns is to identify and harness various forms of clean and renewable energy [1]. Most advancements in the field of clean and renewable energy focus in the development of modern electric power systems. Such systems are very advantageous due to their low cost, local availability, public acceptance and environmental friendliness. Among all renewable sources of energy, wind and solar energy are the most commonly used all over the world [2,3].Concerning Cameroon, in the last three decades, electrical power demand has tremendously increased due to a steady increase in human population and industrialization [1]. Cameroon is richly endowed with various sources of energy such as hydroelectrical, fossil fuel, wind, solar, biomass and geothermal, most of which are not harnessed. It has the second highest hydroelectric potential in Africa, and relies mostly on hydroelectric power for its electrical needs [1,4,5], with petroleum and coal being minor sources of its electrical energy supply [1]. However, most localities in Cameroon, suffer from frequent power cuts and energy shortages. Thus, there is a need to harness other underdeveloped sources of energy such as wind energy. This can create thousands of long-term, high paying jobs in fields such as wind turbine component manufacturing, construction and installation, maintenance and operations, legal and marketing services, transportation and logistical services. Wind turbines can be used to supply electricity to a distant or nearby community, irrespective of its size. Community wind turbine projects may include wind turbines for schools, cities or villages, municipal facilities. Small wind turbines, alone or as part of a hybrid system, can power homes, factories, farms, ranches, and schools [1]. Wind energy can be ideal for remote applications such as water pumping and displacement of diesel fuel in remote communities [4]. Wind energy systems have low operating costs because there are no associated fuel costs [3]. Despite the enormous advantages of wind energy, its development is not appropriate everywhere. Wind by its nature is a variable element and the most important aspect of wind energy resource. It depends on various time scales and spatial dispensations due to variables such as topographic and orographic changes. Hence, it is important to study the spatio-temporal variabilities of wind speed before executing any wind energy project [6]. The order of necessary and or crucial operating procedures for the choice of favourable locations for wind farms project implementation includes prospection (which consists of the identification of suitable locations), validation (which involves the verification of data and PDF model’s reliability and validity) and optimisation (which involves the minimisation of material and capital costs) [7]. The study of wind variability can provide a good knowledge of atmospheric flow behaviour of a given area [6]. Such knowledge is used in diverse fields such as simulation of flows on built structures, transport and diffusion of pollutants, identification of suitable sites for agriculture, inferring/predicting of past/future environmental conditions. Various PDFs have been used in wind speed modelling. Of these, Weibull PDF is the most widely used [9,10,11,12,13,14]. Several other studies have used other distributions such as Rayleigh, Lognormal, Gamma, Normal [15,16,17,18]. The choice of appropriate distribution for a particular location is based on statistical parameters that give the goodness of fit. The root mean square error (RMSE), minimum Chi-Square
 and coefficient of determination (
 ) are statistical parameters that indicate whether it is appropriate to use PDF in modelling a given location. Although the use of wind energy in Cameroon is practically inexistent, numerous researches as well as recommendations have been established using either the Weibull or Rayleigh PDFs models. Such researches target only specific localities with readily available data rather than the entire national territory simultaneously. For example, in the Northern part of Cameroon, certain researchers [4,19] have used Weibull's approach to describe the wind characteristics of specific sites. Others [20,21,22,23] conducted studies on wind energy in Kousseri, Maroua and Garoua. In the southern part of Cameroon, some authors, have used in situ measurements to determine the power density of Bamenda [9], while others [14] used data collected from the NASA meteorological data site, to assess the wind power potential of the Atlantic coastal cities of Kribi, Douala, and Limbe. Others [24,25] assessed the wind power density of Bafoussam and Douala using data collected at Bafoussam and Douala International Airports respectively. Results indicate that wind potential is not favourable for large scale electricity generation in the above mentioned areas of Cameroon, but could be important for pumping domestic water, livestock watering and for small-scale irrigation. There is therefore a need to have more information on wind variability and wind potential energy that is spatially and timely representative of the whole Cameroonian territory using another more accurate PDF. This work fits perfectly in the current context of research of new sources of energy in Cameroon. It aims at providing a comprehensive statistical analysis of the mean monthly, annual, and interannual variability of wind speed data in Cameroon for the period between 2000 and 2017 using the Gamma PDF. Wind data was collected from Era-Interim at 10 m A.G.L for the entire study area, which is a rectangular grid comprised of 2745 sites, enclosing the whole of Cameroon and some neighbouring territories.The subsequent part of this paper is organized into three sections. Section 2 describes the materials and tools used for data analysis, Section 3 presents the results and discussions, while Section 4 focuses on the concluding remarks.
2. Data and Methods
2.1. Presentation of the Study Area
- Cameroon is located between latitudes 2° and 13° north of the equator, and longitudes 8° and 16° east of the Greenwich Meridian [1]. It is comprised of ten regions (subdivided into southern and northern major blocks). The northern part of the country stretches from the Adamawa Region to Lake Chad. The southern block comprises of the eastern, central and western sub blocks. Due to its geographical location, there are two main seasons in Cameroon, namely: the dry and rainy seasons. The dry season begins in November and ends in March, while the rainy season lasts from April to October [4]. Cameroon is bordered to the west and northwest by Nigeria, to the southwest by the Atlantic Ocean, to the south by Equatorial Guinea and Gabon, to the southeast by Congo, to the east by the Central African Republic, to the east and northeast by Chad, and to the north by Lake Chad [26].
2.2. Wind Speed Data Source
- The data used in this study are the four daily (00-06-12-18 UTC) ERA-Interim reanalysis zonal and meridional components of wind data collected at 10m A.G.L produced by the European Centre for Medium-Range Weather Forecasts (ECMWF), for the time interval between January 2000 and December 2017, on a rectangular grid comprised of points with spatial resolutions of 0.25° x 0.25° [27,28], resulting in an array of 61 longitudes x 45 latitudes, giving a total of 2745 data collection points.
2.3. Gamma PDF and CDF
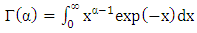
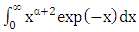
- The Gamma PDF
 and its cumulative distribution function
  are expressed respectively by the following formulae [15,29]:
 | (1) |
 | (2) |
 where
where  for p > 0 is the lower incomplete Gamma function.
  is the Gamma function.
  and v are the scale parameter, the shape parameter and wind speed at the given location respectively. The shape and scale parameters are obtained by solving iteratively Eq. (3) and Eq. (4) with the maximum likelihood method [15]:
  | (3) |
 | (4) |
 is the digamma function.The TP available at a given location with wind speed
  is given by the formula below [19,30]:
 | (5) |
 are the rotor swept area and air density respectively. The total power density per unit area (
 ) for any distribution at an observation site is given by Eq. (6) [15,30]:
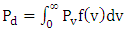 | (6) |
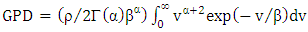 | (7) |


 | (8) |
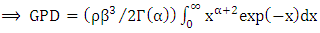
 then
then 
 | (9) |
 and
and 
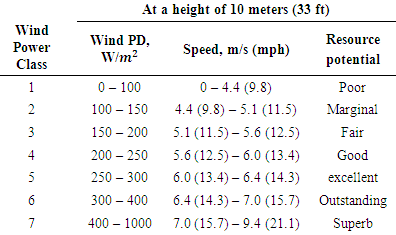
2.4. Wind Power Classes
- Table 1 illustrates the different wind energy categories ranging from class 1 to 7. Each class shows the average density of the wind power and the average wind speed collected at 10 m A.G.L. Wind powers belonging to class 4 and above are considered adequate for most turbine implementations; Class 3 is fairly adequate; Class 2 is marginally adequate; and Class 1 is unsuitable for wind energy developments [29,31].
|
2.5. Goodness of Fit Tests
2.5.1. The Coefficient of Determination (COD or R2)
- The
 value given by Eq. (10), is developed in [15,24,31]. It ranges from 0 to 1.
 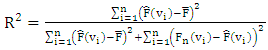 | (10) |
 is the estimated cumulative distribution function,
  and
and  is the empirical distribution function. A value of
  close to 1 indicates the accuracy of the results of the model.
2.5.2. The Root Mean Square Error (RMSE)
- The RMSE given by Eq. (11), is developed in [15,24] as:
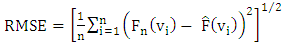 | (11) |
 to 0 indicates a perfect fit of the model.
 2.5.3. The Minimum Chi-Square
- The Chi-square goodness of fit test judges the adequacy of a given theoretical distribution to a data sample. The sample is arranged in a frequency histogram having N bins. The Chi-square statistical test is developed in [24]:
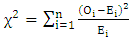 | (12) |
 is the observed frequency in the
  class interval,
 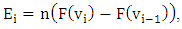 where
where  and
and  are lower and upper limit in the in the
  class interval respectively, F is the expected frequency in the
  class interval, and n is the number of bins. The closer the value of
  to 0 the more accurate the model results will be.
 3. Results and Discussions
3.1. Monthly and Yearly Variabilities of Mean Wind Speeds over Eighteen Years
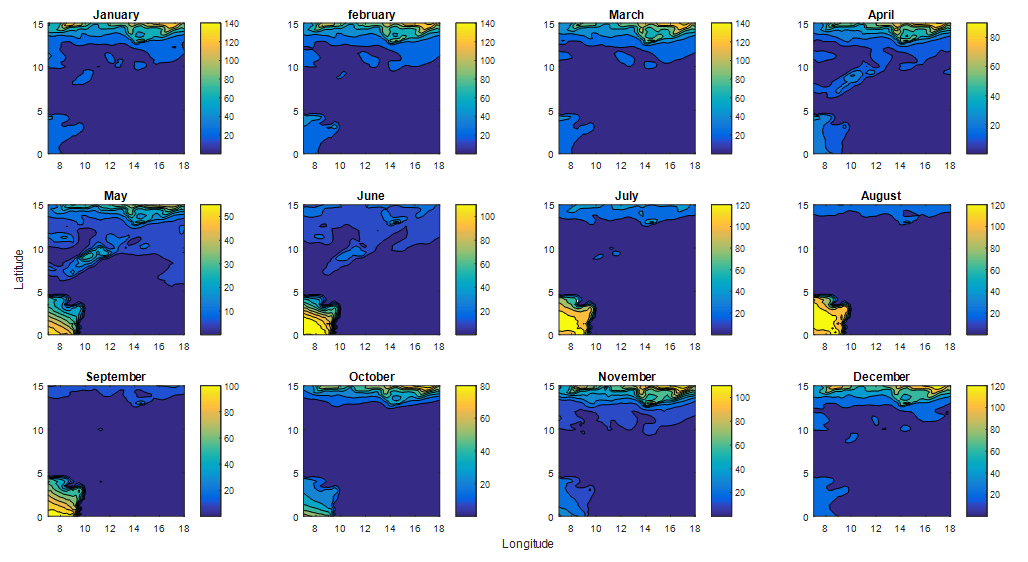
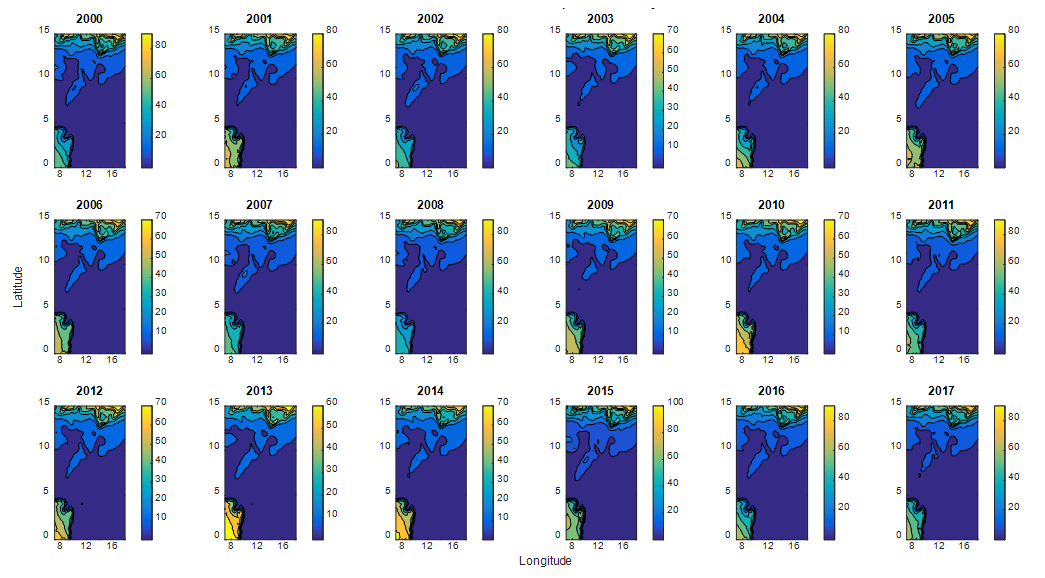
- Figure 1 and Figure 2 below are plots of mean monthly, annual and interannual variabilities of wind speeds on the 0.25° x 0.25° space resolution grid of 2745 points mentioned above, with longitude as abscissa and latitude as ordinate.
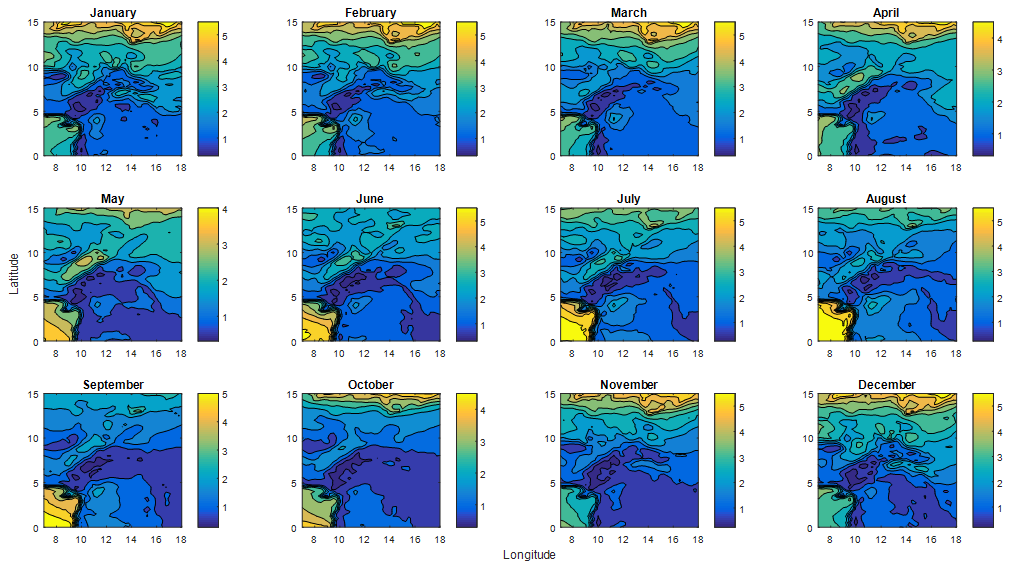 | Figure 1. Monthly average variability of mean wind speed  in terms of longitude and latitude for a year in terms of longitude and latitude for a year |
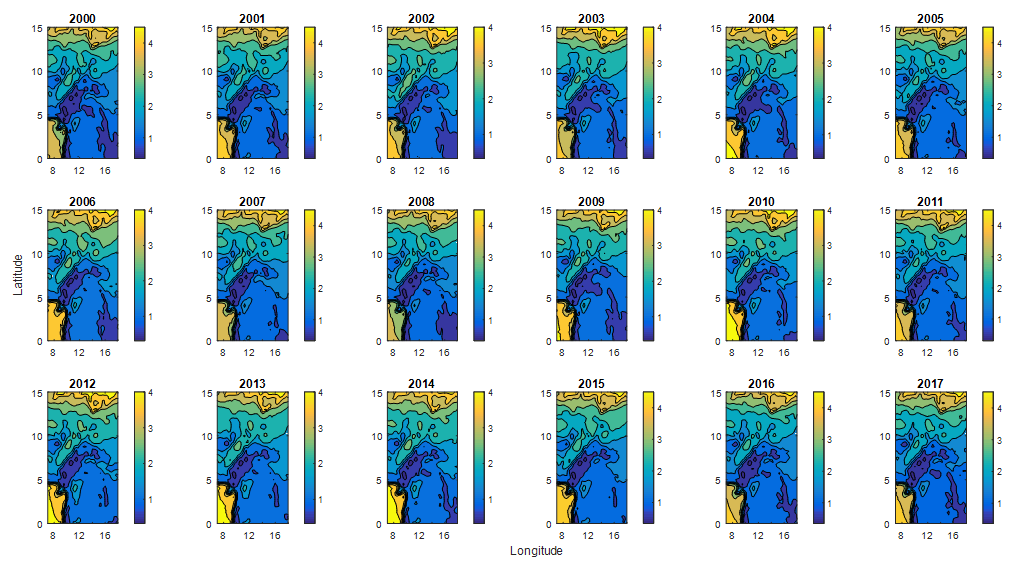 | Figure 2. Annual average variability of mean wind speed  in terms of longitude and latitude for eighteen years (2000 to 2017) in terms of longitude and latitude for eighteen years (2000 to 2017) |
3.2. Goodness of the Fit Tests
3.2.1. Qualitative Analysis
- The qualitative comparison of the Gamma PDF and wind speed histogram for the entire study area shows that the Gamma PDF follows perfectly the form of histogram (Figure 3). Similarly, the qualitative comparison of the empirical cumulative density function (Ecdf) and Gamma CDF for the entire area of study area presents a perfect fit (Figure 4, 5).
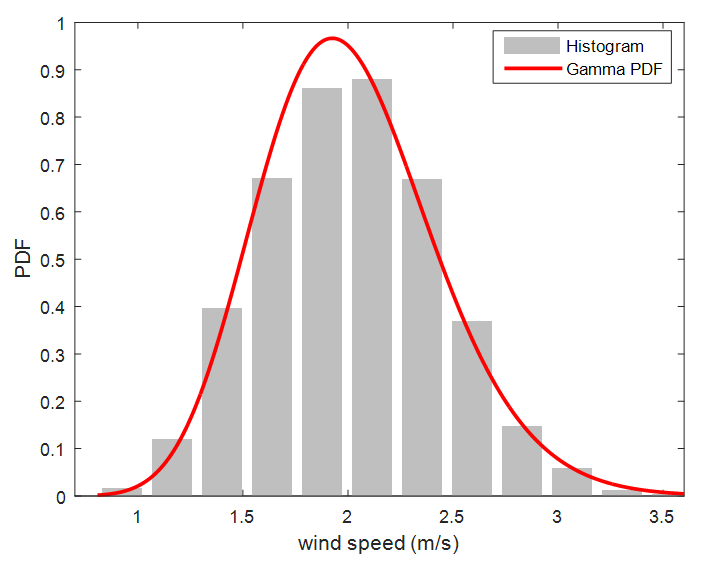 | Figure 3. Comparison of Gamma PDF and wind speed histogram for yearly average wind speed of the entire study area |
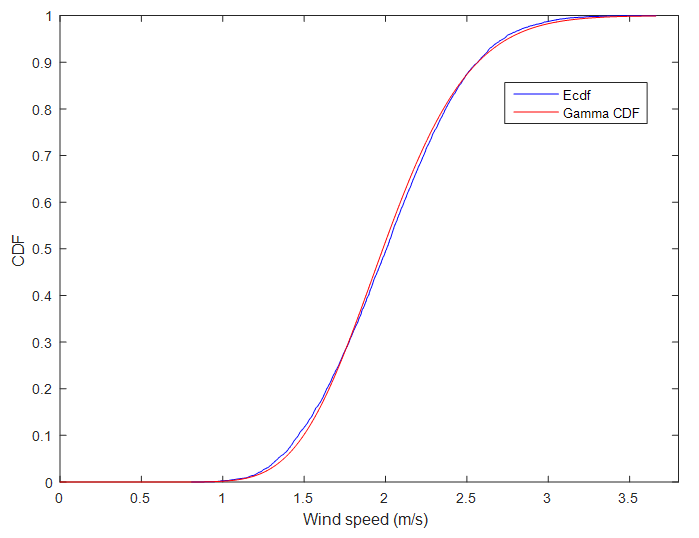 | Figure 4. Comparison of Gamma CDF and empirical cumulative density function (Ecdf) for annual average wind speed of the entire study area |
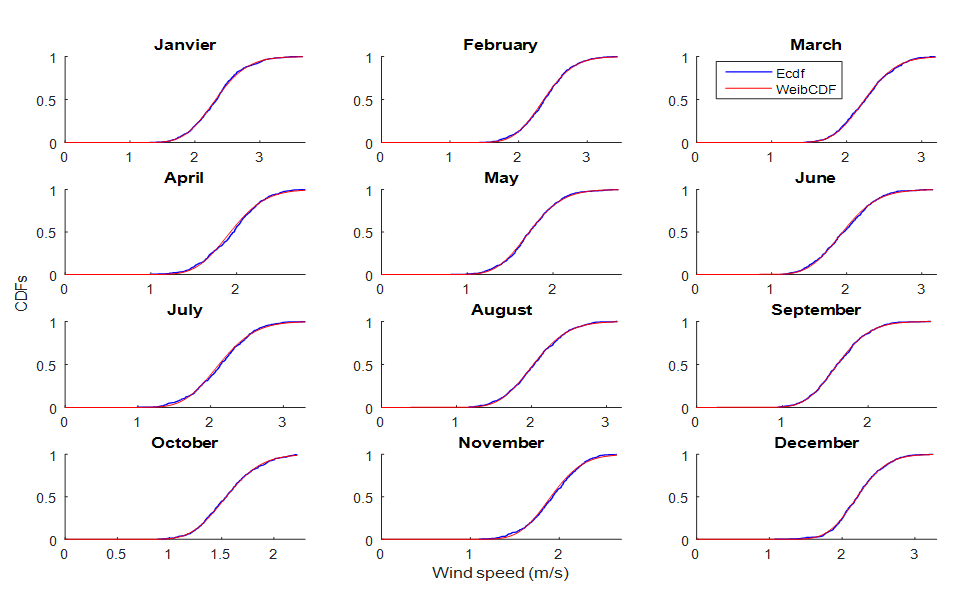 | Figure 5. Comparison of Gamma CDF and Ecdf for monthly average wind speed of the entire study area |
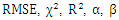
3.2.2. Quantitative Analysis
- Table 2 give the values of monthly and annual average RMSE,
 and wind speed
  of the entire study area calculated using Eq. (10), (11), (12), (3) and (4) respectively.
|
 and wind speed
  of the entire study area
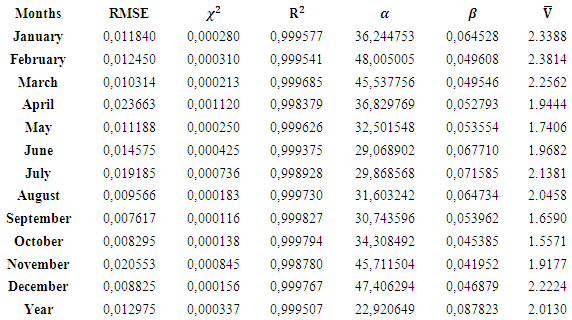
 are approximately 0 while
  is approximately 1. This indicate that the model presents a perfect fit.The most significant monthly average wind speed is recorded during the dry season. This is explained by the fact that the air mass is lighter in the dry season than in the rainy season.
3.3. Mean Monthly and Annual Variabilities of TP and GPD
- The mean monthly and annual variabilities of TP and GPD are presented in Figures 6, 8 and Figures 7, 9 respectively. Qualitatively, Figure 6 and Figure 7 are similar, as are Figure 8 and Figure 9. These results tie with those obtained from qualitative and quantitative analysis, indicating the effectiveness of Gamma PDF in modelling wind speed in the study area. Certainly, the windiest and least windy sites have the highest and lowest power potentials, respectively. In Figure 6 and Figure 7, high TP and GPD values are observed during the months of January to March, and October to December in the Lake Chad Basin. Similarly, high TP and GPD values are also in the GoG in the months of May to September. The highest power potential values of up to and beyond 100
 are observed in January to March, June to September and November to December in the Lake Chad Basin. The highest power potential value of 146
  is observed in the Lake Chad Basin during the month of March. The highest values on both the empirical and Gamma model are season dependent; the Lake Chad Basin values correspond to the Harmattan period, which is during the dry season. The values in the GoG are observed during the Monsoon winds, which takes place during the rainy season. In almost all parts of the South, Littoral, Southwest, East, West and Adamawa Regions, the power potentials have very low values that are relatively constant throughout the year. Most of these values are classified under category one of the power density spectrum (see Table 1).
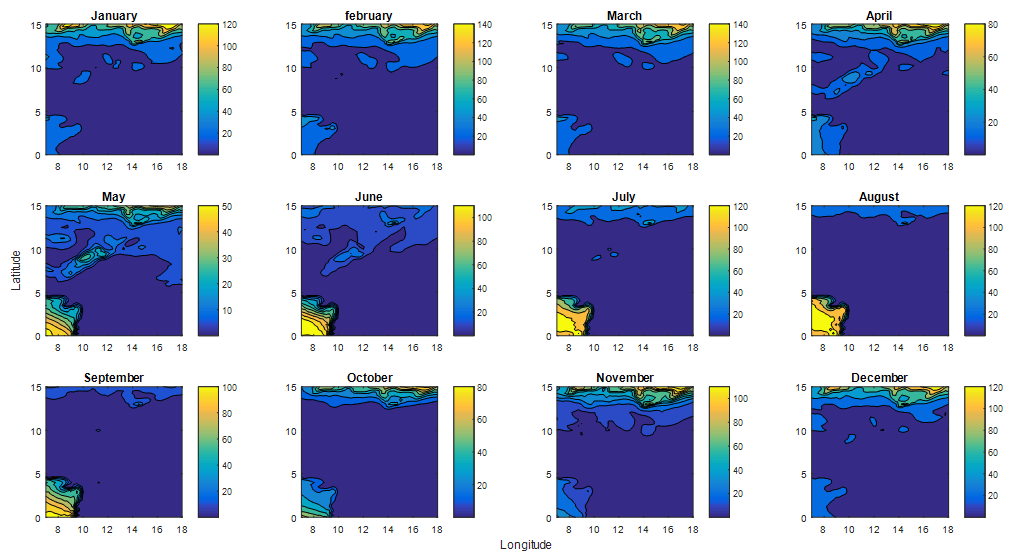 | Figure 6. Monthly average variability of empirical power  in terms of longitudes and latitudes in terms of longitudes and latitudes |
 | Figure 7. Monthly average variability of Gamma power density  in terms of longitude and latitude for a year in terms of longitude and latitude for a year |
 | Figure 8. Annual variability of empirical power  in terms of longitude and latitude for eighteen years (2000 to 2017) in terms of longitude and latitude for eighteen years (2000 to 2017) |
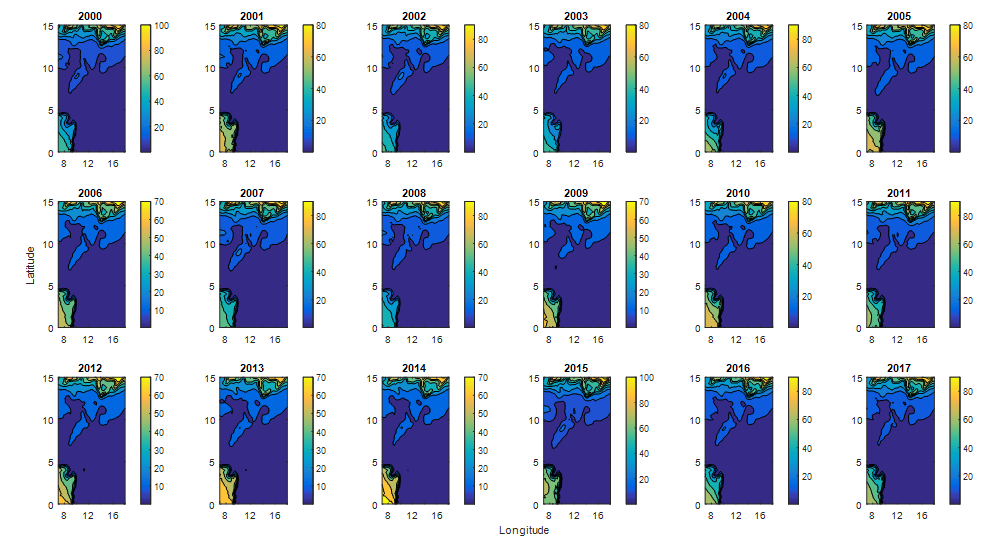 | Figure 9. Annual variability of Gamma power density  in terms of longitude and latitude for eighteen years (2000 to 2017) in terms of longitude and latitude for eighteen years (2000 to 2017) |
 and lower values less than 1.0
  are observed throughout the years except for the years 2000 and 2015, where higher values close to 100
  were observed around the Lake Chad Basin and the GoG. In almost all areas of the Southern part (South, Littoral, Southwest, Northwest, East, West and Adamawa), and certain areas of the Northern part of Cameroon, wind power densities have very low values.
3.4. Monthly Average Best Power Density Potential
- Tables 3, 4 and 5 present the monthly average TP of the five best sites of the entire study area, the monthly average GPDs of the five best sites of entire study area and the monthly average GPDs of the five best sites of Cameroon respectively. It can be observed from these tables that most power density values of neighboring locations are marginal (Category 2), while those of most locations within the Cameroonian territory are poor (Category 1). However, few marginal power density values were also registered within the Cameroonian territory.
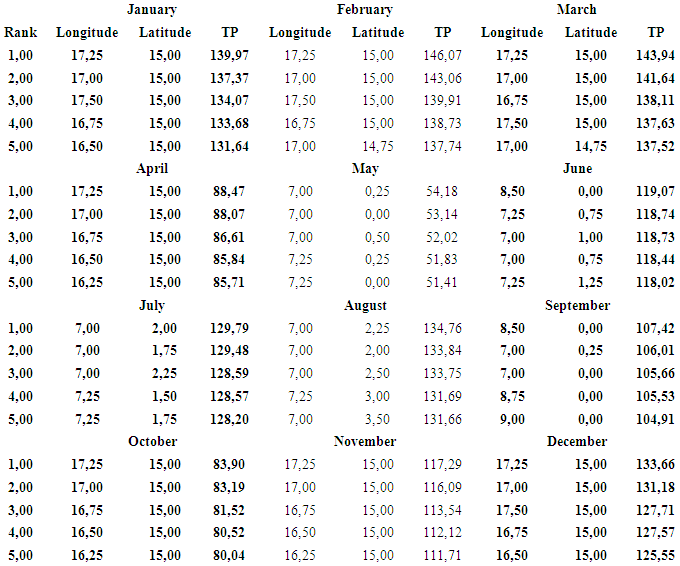 | Table 3. Theoretical or empirical power  of the fifth best sites of the fifth best sites |
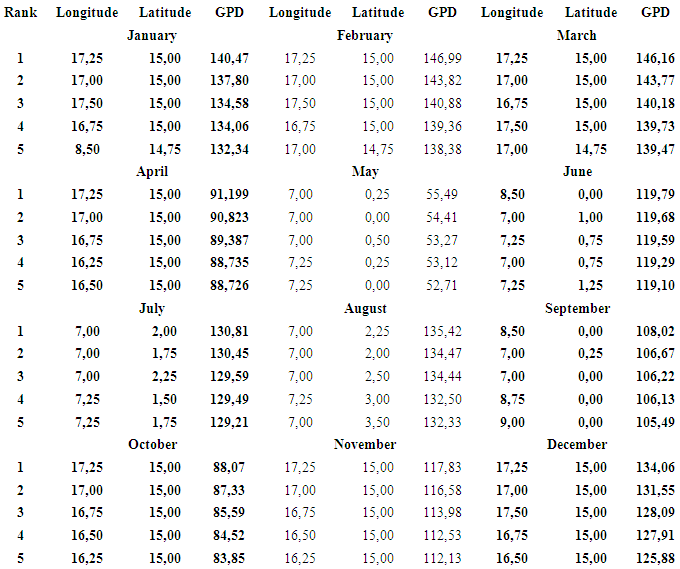 | Table 4. GPD  of the fifth best sites in terms of geographical coordinates of the fifth best sites in terms of geographical coordinates |
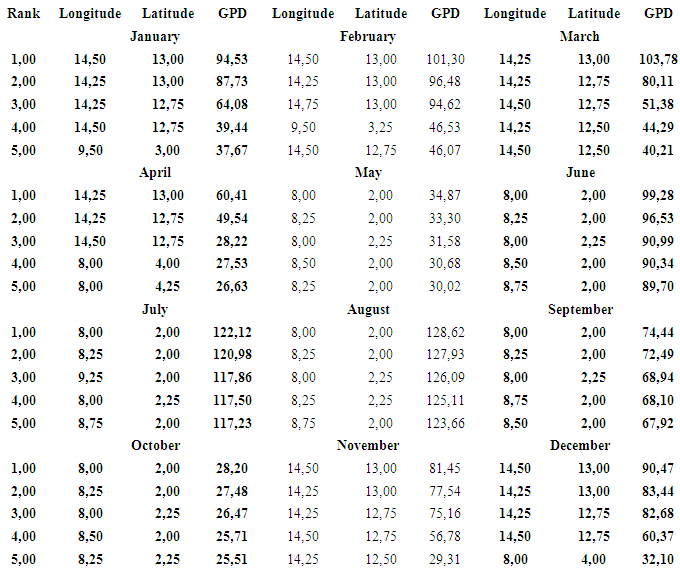 | Table 5. Wind power potential  of the fifth best sites insight Cameroon in terms of geographical coordinates of the fifth best sites insight Cameroon in terms of geographical coordinates |
4. Conclusions
- Statistical analysis of the mean monthly, annual, and interannual variability of wind speed data in Cameroon for the years between 2000 and 2017 was evaluated using the Gamma PDF. The results of both qualitative and quantitative analysis indicate that Gamma PDF can be used to model mind speed data in the study area. The mean monthly variation of wind speed in the study area is seasonal dependent, with the most significant variabilities occurring in the southwestern part of the study area (GoG) during the Rainy Season and in the northern part (Lake Chad Basin) during the Dry Season. The greater part of the study area running from east to west presents low and relatively constant wind speeds during all seasons, most of which are either marginal or poor. Most parts of Cameroon have poor wind speed values that are not suitable for large scale electricity generation. However, such wind speeds can still find several applications. The classification of the TP and GPD of the top 5 sites in the entire study area shows on the one hand that practically all the locations belong to class 1 of the wind power density classification scale with exception of a few sites that are in class 2. On the other hand, it shows that several sites in neighboring parts around Cameroon are windier than most sites within the Cameroonian territory.