-
Paper Information
- Previous Paper
- Paper Submission
-
Journal Information
- About This Journal
- Editorial Board
- Current Issue
- Archive
- Author Guidelines
- Contact Us
American Journal of Environmental Engineering
p-ISSN: 2166-4633 e-ISSN: 2166-465X
2020; 10(3): 59-68
doi:10.5923/j.ajee.20201003.02
Received: Nov. 16, 2020; Accepted: Dec. 7, 2020; Published: Dec. 15, 2020

Water Quality Index of Halda River, Southeastern Bangladesh
 Abstract
 Reference
 Full-Text PDF
 Full-text HTML
Md. Safiqul Islam1, M. A. Azadi2, Munira Nasiruddin1, Md. Saiful Islam1
1Department of Zoology, University of Chittagong, Chittagong
2International Islamic University Chittagong, Chittagong
Correspondence to: M. A. Azadi, International Islamic University Chittagong, Chittagong.
| Email: |  |
Copyright © 2020 The Author(s). Published by Scientific & Academic Publishing.
This work is licensed under the Creative Commons Attribution International License (CC BY).
http://creativecommons.org/licenses/by/4.0/

Water quality index was determined mathematically to assess the water quality of Halda River, a well-known spawning ground of Indian major carps and a tributary of the River Karnaphuli in south-eastern Bangladesh. Water quality and water quality indexes for seasonal and yearly were calculated from three selected stations situated upstream to downstream covering the entire fishing and spawning area by Weighted Arithmetic Water Quality Index method based on ten physicochemical parameters (Temperature, Transparency, TDS, Conductivity, pH, DO, BOD, Calcium, Total Hardness, and Total Alkalinity), analyzed monthly for two years, during January 2017 to December 2018. The Index classified the river water as good to poor during different seasons and annually. In the Station-1 (Nazirhat) upstream the water was good in monsoon, post-monsoon, and winter, but was poor during pre-monsoon. In the Station-2 (Satterghat) mid-stream, the water was good in pre-monsoon and winter andwas poor during monsoon and post-monsoon. In the Station-3 (Madunaghat) downstream, the water was poor for the entire four seasons. However, annually for two years, water was good in Stations 1 and 2 but was poor in Station-3. Index classified the water of Stations-1 and 2 as usable for domestic, irrigation, and industrial purposes, while the water of Station-3 is usable for irrigation and industrial uses only, and the river water is not fit for drinking without treatment. The level of all ten parameters was congenial for fishes in stations 1 and 2, whereas in Station-3 eight parameters excluding DO and BOD were suitable for fish. The study might help to create awareness among the users of river water for drinking and fisheries purposes and to keep the water in good condition.
Keywords: Water quality, WQI, Weighted Arithmetic Index Method, Halda River
Cite this paper: Md. Safiqul Islam, M. A. Azadi, Munira Nasiruddin, Md. Saiful Islam, Water Quality Index of Halda River, Southeastern Bangladesh, American Journal of Environmental Engineering, Vol. 10 No. 3, 2020, pp. 59-68. doi: 10.5923/j.ajee.20201003.02.
Article Outline
1. Introduction
- In southeastern Bangladesh, Halda River is well known as a spawning ground and for collection of naturally produced eggs of four Indian major carps, from which traditionally wild carp fries are hatched in the mud scoop and fingerlings are made for country’s aquaculture and brood making in the hatchery [1-5]. Eighty-three species of finfish and 10 species of shellfish are inhabitants of this river [6,7]. Its water from extreme downstream is supplied to the Chattagram city dwellers for drinking after treatment. The river water is also used for irrigation and local people’s transportation, bathing, discharging poultry litters, and household wastes of local Upazila towns, Fatikchari, Nazirhat, and Hathazari. Besides, agrochemicals used in the surrounding crop field and some industrial effluents from Chittagong Asia Paper Mill through Madari Khal, Peking power plant’s oil wastes through Chengkhali Khal and some industrial pollutants of town area through Katakhali Khal, Khandakia Khal, and Bamanshahi canal are sometimes discharged into the River Halda. During high tide, to some extent, polluted water of the River Karnaphuli also enters the River Halda. However, being a tidal river, daily twice natural tidal flushing and during monsoon, hilly run-off helps the river to recover its status to a certain level. Bangladesh is facing a serious problem with water contaminations from different industries, domestic wastes, and agrochemicals. For the protection of aquatic life and human health, it is very important to know the quality of river water before using it for different purposes.Water Quality Index (WQI) is a tool to determine the quality of water by using physicochemical parameters of surface water, which can act as an indicator of water pollution. WQI provides a single value that expresses overall water quality at a certain location and time, based on different water quality parameters. Water quality index assessment is essential to prevent and control river pollution and to get reliable information on the quality of water for effective management [8,9]. Since the last few decades, the water quality status is determined by the WQI, which is used for surface and groundwater quality determination throughout the globe [10-15]. Till now, four different methods are found for water quality index estimation, such as “Canadian Council of Ministries of the Environment Water Quality Index (CCMEWQI), National Sanitation Foundation Water Quality Index (NSFWQI), Oregon Water Quality Index (OWQI) and Weighted Arithmetic Water Quality Index (WAWQI)” methods [16]. A considerable amount of works have been done at home and abroad on the quality of water by the WQI method [9-11,17-24]. Some important physicochemical, limnological, and hydrological works on the Halda River have been done by Azadi [1], Patra and Azadi [3,4,25], and in the recent past on Halda and its four linked rivers by Azadi et al. [26]. Recently, few scanty works on WQI and water quality of Halda River have been done based on only three months of data on three stations where two stations (Satterghat and Gorduara) is within four kilometers and the third one is 20 km away from the second station, situated at Kalurghat point on Karnaphuli River [27], based on data collected from five stations covering five km area at extreme downstream near to Halda confluence [28] and based on five stations and only one-time data collection [29]. None of the works have covered the entire fishing and navigable area of the Halda River, covering the whole year including all seasons, which is necessary to justify the status of the Halda River. So far literature reviewed, no extensive yearlong works on WQI of Halda River, covering entire spawning, fishing, and navigable areas were found. Considering the paucity of information on WQI and water quality in respect to a human and fish health concern, the present study was undertaken on monthly basis for two years period on water quality of Halda River by WQI covering entire navigable, fishery, and carp spawning areas. This study might create awareness among the users and also will help the planners and policymakers to know and maintain the quality of water in good condition for different uses and aquatic lives.
2. Materials and Methods
2.1. Study Area
- Halda River is located in the south-eastern part of Bangladesh and originates from the Ramgarh Upazila under Khagrachari District (former Chittagong Hill Tracts) and enters into Chattagram District through Fatikchari Upazila (Fig.1). It flows through Nazirhat, Hathazari, Raozan, and Chandgao Thanas, and its journey ended by meeting with the River Karnaphuli at Mohora point. After traversing 15 km the River Karnaphuli empties into the Bay of Bengal at Potenga point (Fig.1). Halda is 88 km long, including 48 km more or less hilly narrow stream from the point of origin to Nazirhat point and 40 km area from Nazirhat point to Halda mouth, the later 40 km is suitable and used for fishery and navigation by a big boat, and within this zone spawning of major carps occur only within 15 km area from Satterghat to Madunaghat at mid to lower Halda. In the present study three stations namely, Station1- Nazirhat at upstream (St.1), Station 2 - Satterghat at midstream (St.2), and Station 3 - Madunaghat (St.3) at downstream were selected covering the entire fishery, spawning, and main navigable zones in the 40 km area of the main river to know the water quality and WQI of Halda River.Station 1 (Nazirhat) (Fig. 1): This station is located upstream below Nazirhat bridge (22° 37΄N and 91° 47΄E) under Hathazari Upazila. This station is about 20 km upstream from Station-2 (Sattarghat). Here, the water depth of the river was 1.30 m to 2.22 m during low and high tide respectively. No industry was found near to this station. Due to siltation from the nearby hilly area, in this place, the river water was always muddy and the bottom was sandy. Except for some floating water hyacinth, no rooted aquatic vegetation was found. Station 2 (Sattarghat) (Fig. 1): This station is located at midstream and south side of Sattarghat bridge (on Chittagong – Rangamati high way) (22° 30΄N and 91° 50΄E) under Hathazari Upazila and 15 km upstream from Station 3 and situated about 25 km away from Chattogram city. Here, the depth of the river was 4.5 m to 8.5 m during low and high tide respectively. Nearby this station no industry was found. Here the river water was always muddy due to siltation and surrounding washings mixing in this point, coming from its above and nearby Boalia Khal and Sarta Khal tributaries. Except for some floating water hyacinth, no rooted aquatic vegetation was found here. A sand landing station was found at the east bank of this station. Littoral areas of both the banks were muddy and the river bottom was sandy.Station 3 (Modunaghat) (Fig. 1): Station 3 (22° 26΄N and 91° 52΄E) is located downstream and north side of Modunaghat bridge (on Chattogram-Kaptai high way) under Hathazari Upazila while the east bank of the river is under Raozan Upazila. Water from the nearby south side of this station is supplied to the Chattogram city dwellers for drinking and other purposes after treatment. Here, the river was 8 m to 12 m deep during low and high tide respectively. Both the banks were muddy and the bottom was sandy. Water was highly turbid and with high current velocity. No rooted vegetations were found except for some floating water hyacinth. Here, engine boat trafficking was high and in both the banks sand landing stations were observed. In this spot, the river water is subjected to contamination due to industrial runoff coming through its different tributaries, situated above i.e. Madari Khal, Katakhali Khal, and domestic and agricultural washings coming from more tributaries above or situated below i.e. Khandakia Khal, Bamanshahi canal, and its linked river Karnaphuli at some extent during high tide.
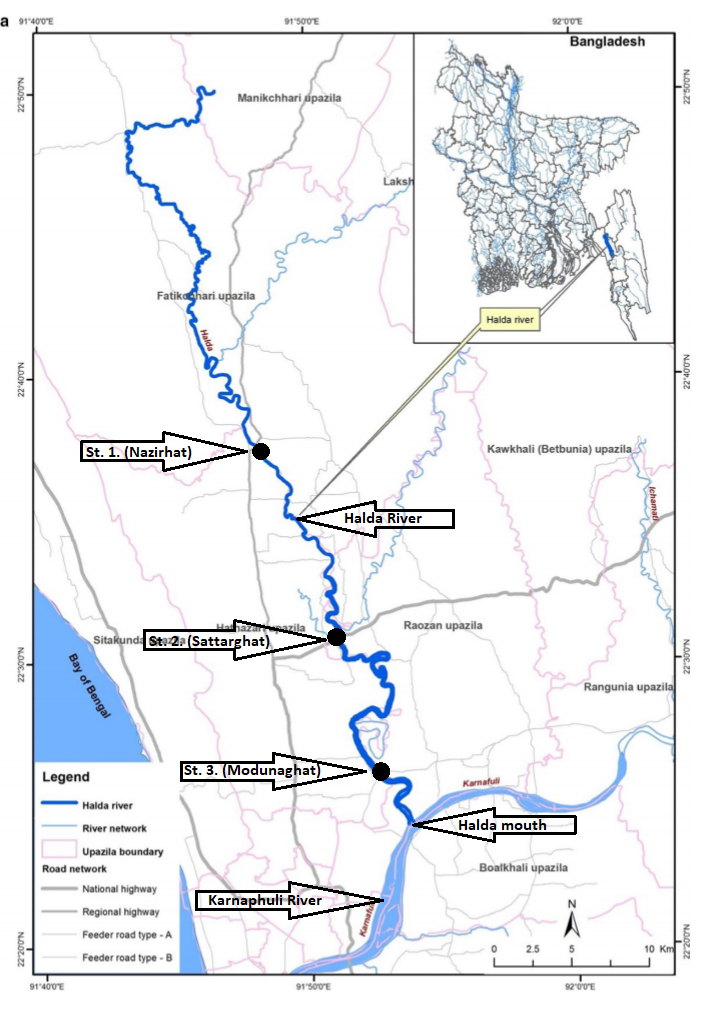 | Figure 1. Map showing the location of the three sampling stations (St.1 Nazirhat, St.2 Satterghat and St.3 Madunaghat) of Halda river (Map source: Saha et al. [30]) |
2.2. Sampling Period
- Water samples were collected at regular monthly intervals from the three stations (St.-1, St.-2, and St.-3) of Halda River (Fig. 1) for two years period from January 2017 to December 2018. Subsurface water samples were collected in nine 250 ml and six 500 ml brown glass bottles between 9.00 am to 11.00 a.m.
2.3. Water Quality Parameters and WQI
- Ten parameters for two years (24 months) were analyzed to find out the quality of water and the Water Quality Index (WQI). Five parameters (water temperature, transparency, conductivity, pH, total dissolved solids (TDS) were tested in the sampling stations immediately after the collection of samples. After necessary preservation and arrangement, rest five parameters [dissolved oxygen (DO), biochemical oxygen demand (BOD), Ca++, total hardness (TH) and total alkalinity (TA)] were analyzed in the Fisheries and Limnology Laboratory, Department of Zoology, the University of Chittagong within 6 hours of collection except BOD5 which was tested after 5 days. The temperature was recorded by a general mercury Centigrade thermometer, transparency was measured by a 20 cm diameter Secchi disc, conductivity by a digital pocket Conductivity meter (EC 4DIGIT, HM Digital, China), pH by a pocket pH meter (pHep HANNA Instruments, Italy), and TDS by a digital TDS meter (DiST 2, HANNA Instruments, Italy). DO, BOD5, Ca++, TH, and TA were measured following APHA [30].
2.4. Procedure of WQI (Water Quality Index) Determination
- WQI was determined for two years (Jan. 2017-Dec. 2018) and for four seasons (Pre-monsoon: February - April, Monsoon: May – July, Post-monsoon: August – October, and Winter: November -January) using above mentioned 10 water quality parameters following the standards of drinking water quality recommended by the World Health Organization [31], Indian Council for Medical Research [32], and Bureau of Indian Standards [33]. Weighted Arithmetic Index method [34] was applied for the calculation of WQI using the following equation:
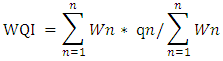 WQI = Water Quality Index‘Wn is the Unit weight for nth parameters’‘qn is the Quality rating for the nth water quality parameter’Further, quality rating or Sub-index (qn) was calculated using the following equation:
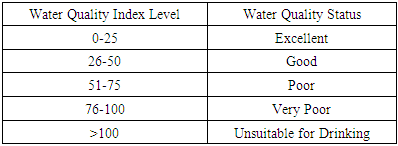
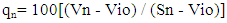 n = water quality parametersVn = estimated value of nth parameter at a given water sampling stationSn = standard permissible value for nth parameterVio = ideal value of nth parameter (0 for all) except pH=7 and DO =14.6 mg/l [35]The unit weight was calculated by a value inversely proportional to the recommended standard value Sn of the corresponding parameter:Wn = k/Sn, Where Wn = unit weight for nth parameter, K= proportionality constantWater Quality Index level and water quality status based on Weighted Arithmetic Index method were determined following Table 1.
|
3. Results and Discussion
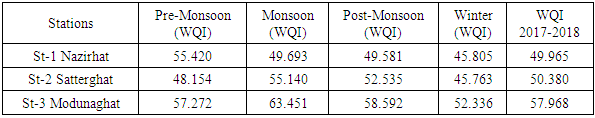
- Tables 2-4 show the range and mean values of water quality whereas Figs. 2a and 2b depicted the mean±SD values of ten different water quality parameters analyzed monthly for two years period for three stations (St.-1, Nazirhat, St.-2, Satterghat, and St.-3, Madunaghat) of Halda River. Fig. 3 and Fig. 4 show the seasonal and overall two years (January 2017 to December 2018) WQI of Halda River, details of which are discussed below.
3.1. Water Temperature
- During the two years study period water temperature varied between 21.2 to 34.4°C (mean 27.73±3.35), 22.8 to 35°C (mean 28.2±3.22°C), and 20.7 to 31.4°C (mean 27.18±3.02°C) in St. 1, St. 2, and St. 3 respectively (Fig. 2a, Tables 2-4). More or less similar findings from the Halda River were reported by Patra and Azadi [4] during 1978-79 and by Sarwar et al. [38]) from the Karnafully River and Fatema et al. [39] from the Buriganga River. The standard value of water temperature is 20-30°C (Santhosh and Singh [40]) and accordingly, the present result of water temperature for the three stations of Halda River was found within the permissible limit.
3.2. Transparency
- Water transparencies varied from 14 to 47 cm (27.54±11.07 cm), 11 to 47 cm (23.79±8.70 cm), and 13 to 48 cm (23.54±8.38 cm) in the three stations, St.1, St. 2, and St. 3 respectively during two years study period (Fig. 2a, Tables 2-4). No significant variation of transparency in the three stations was noticed. This disagreed with the findings of Patra and Azadi [4] in the same river and Sharif et al. [41] in the lower Meghna River. The standard value of water transparency is 40cm [40]. The mean transparency of the three stations of Halda River was lower than the standard level.
3.3. Conductivity
- Electrical conductivity varied from 29 to 196 µS/cm (108.96±45.86 µS/cm), 37 to 179 µS/cm (115±46.64 µS/cm) and 65 to 165 µS/cm (119.13±29.33 µS/cm) in the St.1, St. 2 and St. 3 respectively (Fig. 2b, Tables 2-4). More than four decades ago almost similar findings were recorded by Patra and Azadi [4] in Halda River but disagreed with the findings of Sarwar et al. [38] in the Karnafully River due to presence of salinity and Fatema et al. [39] in the Buriganga River due to the presence of high pollutants. The standard value of Electrical conductivity of water is 300 µS/cm [32]. The present result of electrical conductivity of the three stations of Halda River was far lower than the standard level indicating the softness and no salinity (0 ppt) in the water.
3.4. TDS
- Total dissolved solids varied from 20-80 mg/l (50±20 mg/l), 20-80 mg/l (50±20 mg/l) and 20-80 mg/l (50±10 mg/l) in the St. 1, St. 2, and St. 3 respectively (Fig. 2b, Tables 2-4). TDS was directly related to conductivity. Sarwar et al. [38] recorded high TDS in the Karnafully River due to the presence of the saline condition. Standard value of TDS is 500 mg/l [32,33]. The values of TDS of the present study in all three stations were far below the standard level.
3.5. pH
- pH varied from 6.6-7.7 (7.32±0.25), 6.8-7.9 (7.45±0.28), and 7.1-8.3 (7.62±0.24) in the three stations, St.1, St. 2, and St. 3 respectively (Fig. 2a, Tables 2-4). No variation of pH was observed in the three stations. pH was slightly acidic to alkaline, but overall, it was alkaline. More or less similar results were recorded by Patra and Azadi [4] in the Halda River and Sarwar et al. [38] in the Karnafully River. The standard value of pH of water is 6.5-8.5 [32] and the present result of the pH of the three stations of Halda River was within the permissible limit.
3.6. Dissolved Oxygen (DO)
- DO level of any water body is important for the survival and distribution of aquatic organisms. During the two years study period, the DO varied from 4.1-12.6 mg/l (7.01±2.38 mg/l), 4.2-12.6 mg/l (6.30±2.12 mg/l) and 2.5-8.8 mg/l (5.19±1.73 mg/l) in the three Stations, St.1, St. 2 and St. 3 respectively (Fig. 2a, Tables 2-4). More than four decades ago the more or less similar result was also recorded by Patra and Azadi [4] in the Halda River and disagreed with the results of Sarwar et al. [38] in the Karnafully River and Sharif et al. [41] in the Meghna River due to different ecological condition. In station 3 sometimes DO level was very low and was found to be not suitable for fish due to high contamination in this station. The standard value of DO of water is 5 mg/l [32]. The DO level below 5mg/l adversely affects aquatic lives and below 2mg/l causes fish kills [41]. The present range of DO values was found to be sometimes below the standard level and sometimes above the standard level in the three stations of Halda River. However, except for Station 3, the other two stations’ DO levels were found to be not harmful to aquatic lives. DO level directly affects the WQI. Clearwater shows more DO than unclean water [42].
3.7. Biochemical Oxygen Demand (BOD)
- BOD is the amount of DO required by the aerobic bacteria to break down organic materials present in a given water sample at a certain temperature over a specific period. During the two years study period BOD varied from 0.1-5.3 mg/l (1.63±1.27 mg/l) in Station-1, 0.2-2.3 mg/l (1.12±0.58 mg/l) in Station-2 and 0.2-2.6 mg/l (1.38±0.72 mg/l) in Station-3 (Fig. 2a, Tables 2-4). This disagreed with the results of Sarwar et al. [38] in the Karnafully River and Sharif et al. [41] in the lower Meghna River which might be due to different ecological conditions. The standard value of BOD of water is 5 mg/l [32]. The present BOD level of the three stations of Halda River was far below the standard level. The water without pollution has a concentration of BOD 2 mg/l or below [42].
3.8. Calcium (Ca++)
- Calcium is one of the important chemical parameters of water. During the study period, Ca++ varied from 2.40-12.98 mg/l (7.72±3.11 mg/l), 2.40-12.83 mg/l (7.50±3.39 mg/l) and 3.21-15.23 mg/l (7.91±2.83 mg/l) in the stations 1, 2 and 3 respectively (Fig. 2a, Tables 2-4). This is more or less similar to the finding of Patra and Azadi [4] in the Halda River about four decades ago. The permissible limit of Ca++ for water is 75 mg/l [32,33]. The present result of Ca++ of Halda River was far below the permissible limit.
3.9. Total Hardness (TH)
- Total hardness ranged from 10-50 mg/l (31.75±11.22 mg/l), 12-55 mg/l (32.79±13.15 mg/l) and 16-48 mg/l (33.75±8.31 mg/l) in the stations 1, 2 and 3 respectively (Fig. 2b, Tables 2-4). Based on TH WHO [43] classified water as soft (TH 0-75 mg/l), medium-hard (TH 75-150 mg/l), hard (TH 150-300 mg/l), and TH above 300 mg/l as very hard. According to WHO [43], the water of the three stations of the Halda River was soft.
3.10. Total Alkalinity (AL)
- Total Alkalinity ranged from 30-70 mg/l (48.38±11.18 mg/l), 27-67 mg/l (44.25±11.18 mg/l) and 25-80 mg/l (48.67±13.29 mg/l) in the stations 1, 2 and 3 respectively (Fig. 2b, Tables 2-4). This disagreed with the result of Sharif et al. [41] in the Meghna River. The permissible limit of Alkalinity for water is 120 mg/l [32]. The present result of Alkalinity of the three stations of Halda River was far below from permissible limit.
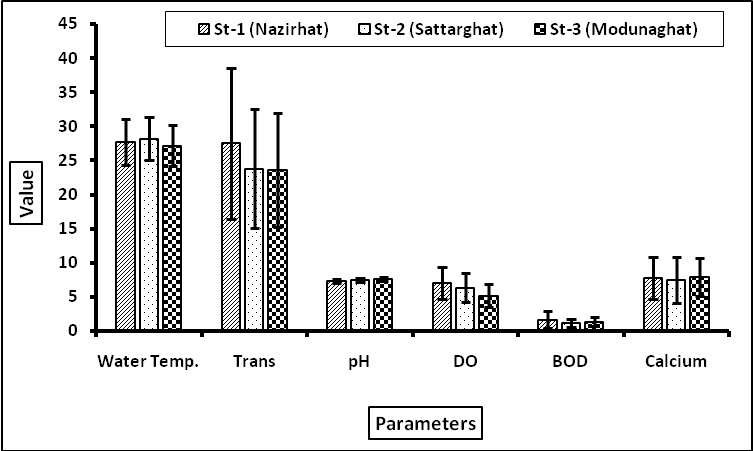 | Figure 2a. Graph showing mean (±SD) values of physicochemical parameters [Water temperature (0C), Transparency (cm), pH, DO (mg/l), BOD (mg/l) and Calcium (mg/l) at Station 1 (Nazirhat), Station 2 (Sattarghat) and Station 3 (Modunaghat) of Halda River during the two years study period |
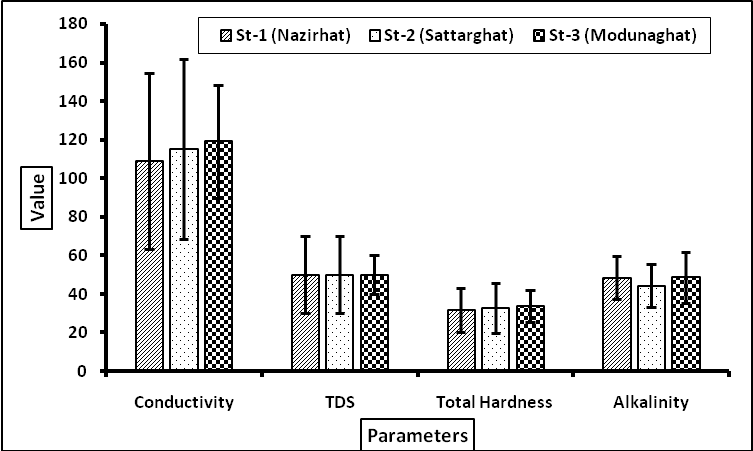 | Figure 2b. Graph showing the mean (±SD) values of physicochemical parameters [Conductivity (µS/cm), TDS (mg/l), Total Hardness (mg/l) and Alkalinity (mg/l)] at three stations (St. 1 Nazirhat, St. 2 Sattarghat and St. 3 Modunaghat) of Halda River during the two years study period |
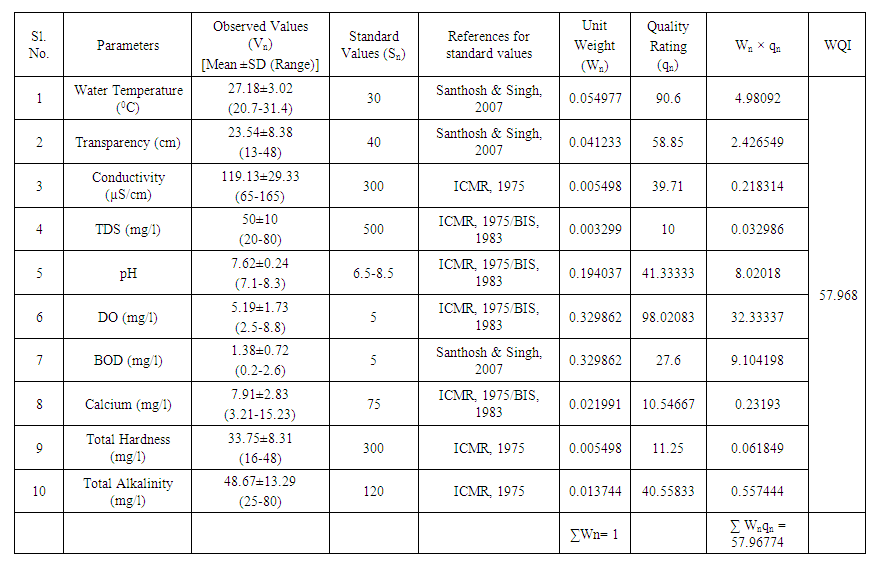
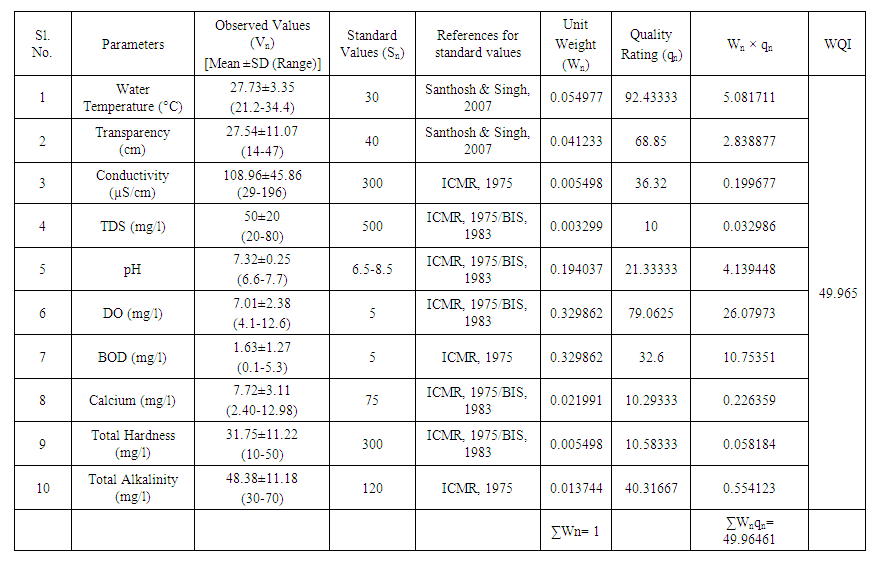 | Table 2. Mean±SD and range values of 10 physicochemical parameters, standard values and calculated Water Quality Index (WQI) of Station-1 (Nazirhat) of Halda River recorded for two years from January 2017 to December 2018 |
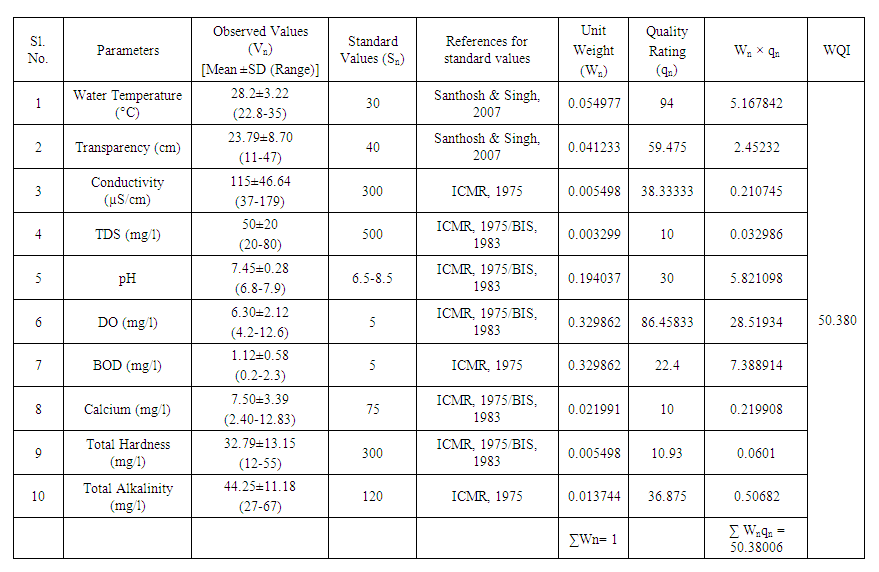 | Table 3. Mean±SD ±SD and range of 10 physicochemical water parameters, Standard values and Water Quality Index (WQI) of Station-2 (Satterghat) of Halda River recorded for two years from January 2017 to December 2018 |
 | Table 4. Mean±SD and range of 10 physicochemical water parameters, Standard values and Water Quality Index (WQI) of Station-3 (Modunaghat) of Halda River recorded for two years from January 2017 to December 2018 |
3.11. Water Quality Index (WQI)
- Water quality index (WQI) gives a brief indication of a large number of water quality parameters into a single term such as excellent, good, poor, very poor, and unsuitable for drinking for easy reporting to the concerned users [37]. Figs. 3 and 4 show the seasonal (Pre-monsoon, Monsoon, Post-monsoon, and Winter) and overall two years Water Quality Index (WQI) calculated utilizing ten physicochemical parameters from three stations of Halda River. The values for WQI (Tables 2-4) fall in the range of good in Station 1 (49.965) and Station 2 (50.380) and are poor in Station 3 (57.968) using Table-1 following the Weighted Arithmetic Water Quality Index (WAWQI) method.The Index classified the river water as good to poor during different seasons and annually (Tables-5). In Station-1 upstream, the water was good in monsoon, post-monsoon, and winter, but was poor during pre-monsoon (Fig. 3). In Station-2 at mid-stream, the water was good in pre-monsoon, and winter, and was poor during monsoon and post-monsoon (Fig. 3). In Station-3 downstream, the water was poor for the entire four seasons (Fig. 3, Tables 5). However, annually for two years, water was good in Stations 1 and 2 but was poor in Station-3 (Fig. 4). Increasing pollution in downstream was also recorded in Al-Gharraf River, Iraq [9], and in Beheshtabad River, Iran [44]. More or less similar results were also observed by Yogendra and Puttaiah [17] and Chandra et al. [16] for different water bodies in India. Among the three studied stations, Station-3 at extreme downstream was more polluted than the other two stations of Halda River. People frequently use this station for bathing, washing clothes, discharging household wastes than in the other two stations, and this station is also subjected to some industrial and poultry discharges coming through different tributaries and canals situated in the upper region (during low tide) and lower region (during high tide). Index classified the water of Stations 1 and 2 is usable for domestic, irrigation, and industrial purposes and water of Station-3 is usable for irrigation and industrial uses only, and the river water is not fit for drinking without treatment.
|
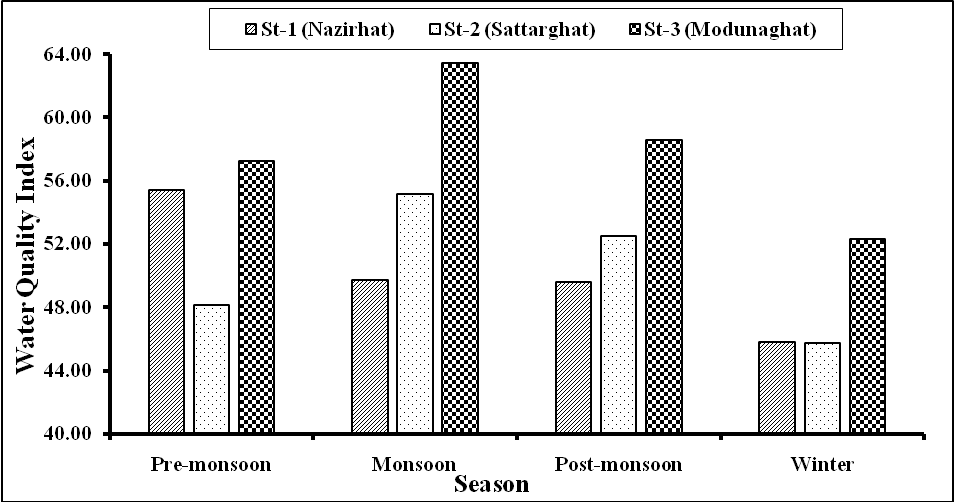 | Figure 3. Seasonal Water Quality Index (WQI) at three stations (St.-1 Nazirhat, St.-2 Satterghat and St.-3 Modunaghat) of Halda River during two years study period from Jan. 2017 to Dec. 2018 |
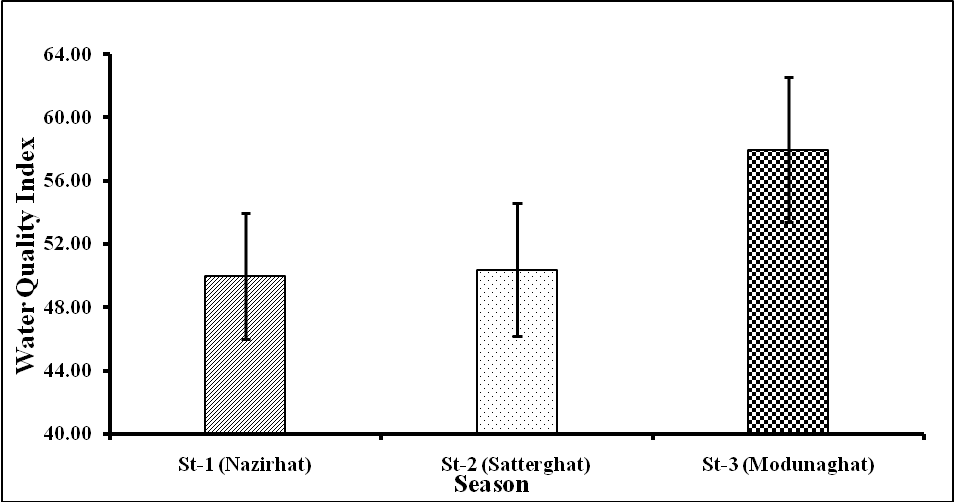 | Figure 4. Overall WQI at Stations-1, 2 and 3 of Halda River for two years period from January 2017 to December 2018 |
4. Conclusions
- WQI is a very useful tool for the assessment and management of the water quality of any water body. This study concludes that the water quality of the three stations of Halda River was not fit for drinking directly. Station-3 is used by surrounding peoples for transporting, bathing, washing, discharging household wastes and surrounding runoff, etc. This station is also contaminated by different industrial effluents coming to the different points of the River through different tributaries namely Katakhali Khal, Madari Khal, and Chengkhali Khal (during low tide) which are situated above and Khandakia Khal (during low tide) situated below this point. Most of the time DO level was low in the Station-3 (Madunaghat) indicating high contamination due to pollution caused by the above-mentioned human activities. The level of DO is the controlling factor of WQI. To keep the water body of Halda River in good condition, discharging household wastes, high use of detergent and surrounding runoff and industrial effluents should be controlled by treating the water before discharge and by creating health concern awareness among the users. To update the quality of water, continuous monitoring of the water quality of Halda River is important and its water should be treated if used for drinking, which is under practice for the water of this river and the River Karnaphuli. After treatment, the water of these two rivers is supplied to the Chattagram city dwellers for drinking. In the lower Halda, at Station 3 DO and BOD levels were sometimes found to be unsuitable for fish and aquatic lives. However, DO and BOD levels were found to be suitable for all aquatic lives in the other two stations at upper and middle regions and all other parameters were not harmful in all the three stations of the river. During monsoon, the river becomes quite favorable for Carp fish spawning. It is notable that due to daily two times tidal flush (high and low tides) and about 100 hilly streams including 16 big hilly streams (tributaries) falling to Halda with hilly water and thus mixing, flushing, and reshuffling the Halda water, which is very acute during monsoon, natural mercy for keeping the Halda water favorable for major carps spawning during monsoon and other fishery species survival and also auto stocking by natural recruitment.