Wiyono1, Jati Batoro2
1Department of Physics, Brawijaya University, Malang, Indonesia
2Department of Biology, Brawijaya University, Malang, Indonesia
Correspondence to: Wiyono, Department of Physics, Brawijaya University, Malang, Indonesia.
| Email: |  |
Copyright © 2020 The Author(s). Published by Scientific & Academic Publishing.
This work is licensed under the Creative Commons Attribution International License (CC BY).
http://creativecommons.org/licenses/by/4.0/

Abstract
The geographical location owned by Situbondo Regency has a coastal area, which could have the potential for seawater intrusion. Therefore, this study aims to explore water resources, namely groundwater in a coastal area of Situbondo Regency - Banyuwangi Regency, which can be used to determine the feasibility of life, especially for humans and animals. Interpretation of groundwater depth is obtained through processing Geoelectric Resistivity Mapping data, then matching the value with direct depth measurements, then measuring using the salinity parameter. Geoelectric measurements obtained an interpretive value of groundwater depth of 12.4 meters, and in direct measurements of the depth of groundwater, the average value was 12.04 meters below the surface, which means that the interpretation value is not much different from the direct measurement value. Then based on the salinity parameter, it can be concluded that the area measured in this study experienced intrusion, with an average salinity value of 2.6 ‰. Therefore, in general, it can be assumed that the intrusion of seawater occurred at the research location. For future improvements, it is necessary to carry out further research along the road from Situbondo District - Banyuwangi Regency to obtain a wider picture.
Keywords:
Groundwater, Geoelectric Resistivity, Salinity, Sea Water Intrusion
Cite this paper: Wiyono, Jati Batoro, Interpretation of Groundwater Depth Using Geoelectric Resistivity Mapping Methods and Groundwater Salinity Measurements Around the Situbondo - Banyuwangi Road, American Journal of Environmental Engineering, Vol. 10 No. 2, 2020, pp. 44-49. doi: 10.5923/j.ajee.20201002.03.
1. Introduction
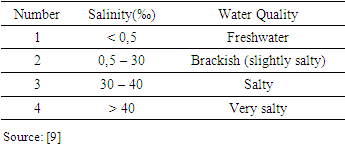
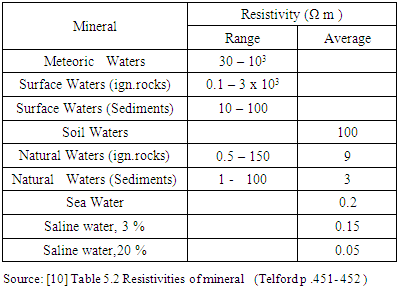
Situbondo is a regency located on the north coast of Java Island, in the horseshoe area. this area is surrounded by tobacco, sugar cane plantations, Baluran protected forest, and fishing business locations. Situbondo has an area of 1,693 km2 with geographic conditions bordering the sea and also surrounded by mountains. This regency is located at an altitude of 0 to 1,250 masl.The geographical condition of the Situbondo Regency which borders the sea has positive and negative impacts. One of the negative impacts of bordering the sea is the potential for seawater intrusion. Seawater has a density greater than freshwater, as a result, seawater will easily push groundwater.The need for water resources is very important, because humans will not be separated from the need for water energy to sustain even animals. From the preliminary survey conducted by previous research, from the results of observations of researchers and also dialogue with the coastal community of Situbondo, the use of local groundwater is very much needed for life both by local communities or animals and also agriculture. Damage to groundwater in coastal areas is indicated by the condition of the water that is not clean and tastes salty [1]. Therefore, this study aims to explore air resources, namely groundwater in a coastal area of the Situbondo Regency - Banyuwangi Regency, which can be used to see the feasibility of life, especially for humans and animals. Because this area is a coastal area due to the influence of seawater intrusion.Seawater intrusion or saltwater infiltration into aquifers on land is basically the process of entering seawater into the land which breaks up into aquifers on land or the coast. In general, seawater intrusion can occur in Indonesia for several reasons, one of which is excessive intake or use of freshwater, resulting in an imbalance between the amount of water explored and the amount of water that enters the ground to fill empty shallow aquifers. [2]. So far, seawater intrusion has not been paid much attention to by the public, although the impact is not felt directly, such as air pollution or noise. This incident is a long-term event that causes considerable losses to the surrounding environment, both in terms of health, the environment which in turn will seep into the economic impact. In line with the consequences above, seawater intrusion also disturbs health, decreases soil fertility, damages buildings and others [3].Indicators of seawater intrusion can be identified by incorrectly measuring groundwater, such as measuring salinity, which functions to determine the dissolved salt content in groundwater or residents. The content of dissolved salt water can also give a different taste to the air that we often encounter in seawater, which gives it a salty taste. Excessive salt that enters the human body will adversely affect the human kidneys [4].In research [5], sacred sites such as petren, punden, and those associated with springs and cultural traditions, have an important role in preserving traditional knowledge; has high conservation value, is a source of oxygen; preserving cultural diversity in society; have religious and traditional values; preserving species, local plant genetics that has educational and ecotourism values. The existence of large trees and springs are interrelated. Then because in the research area of this paper there are many large trees, it is hoped that this can reduce the influence of sea air intrusion.Using the GALDIT method shows that the distance from the coastline is a factor that is susceptible to groundwater to seawater intrusion in the coastal area of Cilacap. This means that areas located closer to the coastline have a high vulnerability to intrusion compared to areas further from the coastline [6].Based on research on groundwater modeling on the coast of Laizhou Bay, China, it was found that over time, groundwater chlorinity fluctuated slightly at monitoring points away from the coast, but there was an increasing trend. Groundwater chlorinity fluctuates significantly at the nearshore monitoring point and shows an increasing trend. Drought caused by a sudden drop in mean monthly rainfall in February and March 2015 resulted in insufficient groundwater supply, damaged hydrodynamic balance, and severe intrusion of seawater; As a result, groundwater chlorinity increases rapidly. Groundwater chlorinity decreases with increasing distance from the coast. Except for irregular fluctuations due to the long drought in 2015, groundwater chlorinity fell to freshwater levels when the distance from the coast was 2000 m. Over time, the seawater intrusion area gradually approached the land, and the cross-distribution of the intrusion area was uneven. In this study, the degree of seawater intrusion was observed by monitoring the chlorinity of groundwater along the coast of Laizhou Bay and analyzed the causes of seawater intrusion which is a reference for prevention and control of disasters of seawater intrusion [7].In research in the Semarang area, it is known that over time, seawater intrusion will increase using steady and unsteady modeling [8].In the explanation of some of the research results above, seawater intrusion is closely related to the salinity value in groundwater, the following is a classification is a classification of groundwater content based on dissolved salt, presented in Table 1.Table 1. Classification using salinity parameters
 |
| |
|
Based on this background and the absence of research conducted in the area around the Situbondo Regency, especially those related to the effect of seawater on groundwater. So, this research was carried out by taking samples of groundwater or well water using parameters, namely salinity and measuring the depth interpretation and measuring the depth of groundwater (well water).
2. Research Method
2.1. Research Location
Sampling was carried out in the morning to evening during working hours. For measurement of groundwater, content is carried out in the laboratory and to avoid errors given labeling each bottle of the water sample obtained. This research was conducted in the dry season, namely in July to August 2020.Selection of sampling points in the area around the coast, to the area away from it, namely the area south of the sampling point. The sampling points are shown in Figure 1 and Figure 2.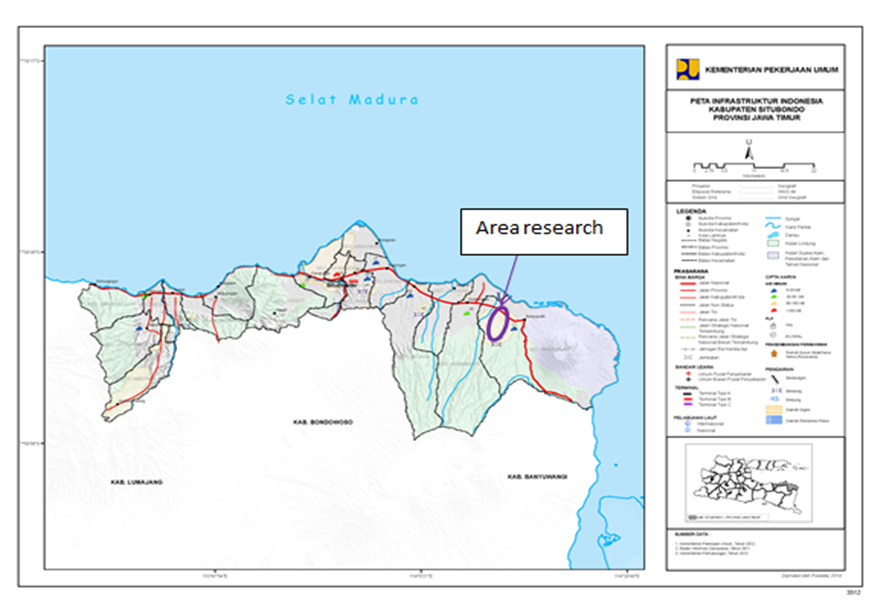 | Figure 1. Research Location |
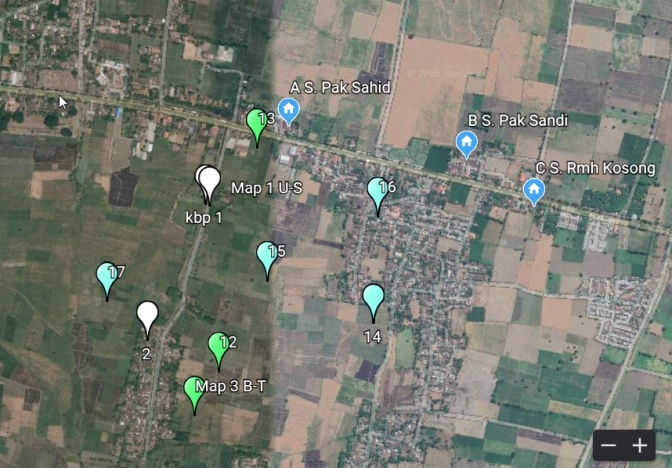 | Figure 2. Location of water sampling points |
2.2. Research Design
This research is a quantitative and qualitative experimental study, where water samples are obtained directly from the residents around the Pesisir, Situbondo Regency, then measured their salinity with a refractometer. Meanwhile, groundwater depth interpretation of Geoelectric Resistivity Mapping data processing is then matched with direct depth measurements.
2.3. Tools and Materials
The tools and materials used in this research, among others:1. 600ml sample bottle2. Measuring rope3. Refractometer4. Geoelectric Equipment
2.4. Research Variable
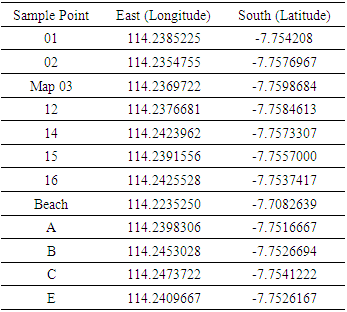
The variables in this study are parameters including well depth and salinity. The data in this study are primary data obtained from direct sampling around the coast of the Situbondo Regency.Then for the coordinates of the water sampling point can be seen at Table 2.Table 2. Groundwater sampling coordinates
 |
| |
|
3. Result and Discussion
As discussed in the previous section, the parameters measured in this study amounted to 2, namely as follows:
3.1. Interpretation of Groundwater Depth
As a reference that the groundwater resistivity value is in the range of 1 -100 ohm meters, which can be seen in the table below Table 3.Table 3. Mineral Resistivity
 |
| |
|
From the measurement of the Geoelectric Resistivity Mapping method, and for the visualization using Res2Dinv which the cross-sectional interpretation is shown in Figure 3.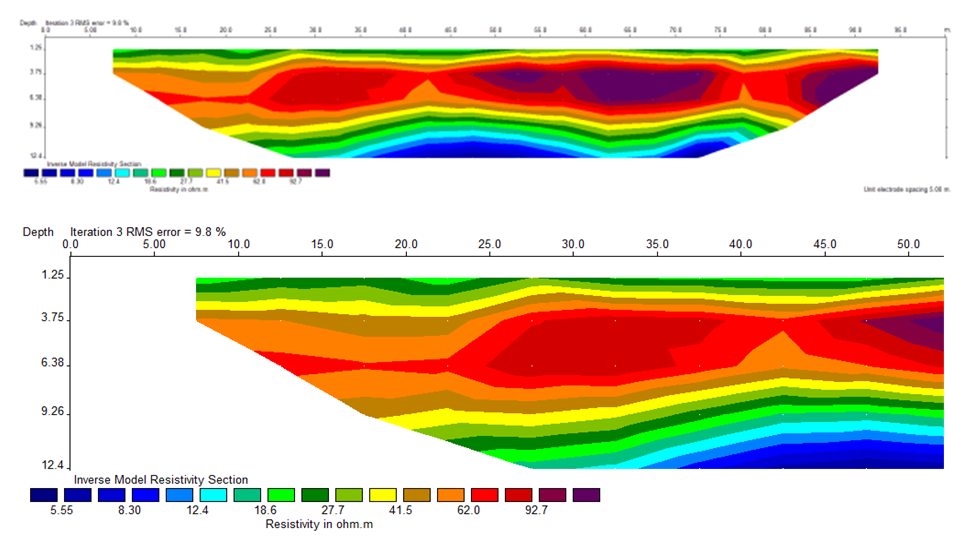 | Figure 3. Cross Section image of “Mapping1” |
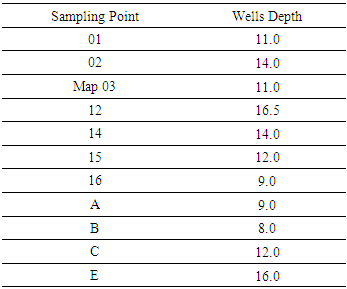
From the above figure, and regarding the groundwater survey in the field, it can be assumed that the groundwater depth is equal to 12.4 meters below the surface. Then indirect measurement, the groundwater depth is found in the value shown in Table 4.Table 4. The value of the well depth from the coastal area of Situbondo
 |
| |
|
Based on the table above, it can be seen that the difference in well water belonging to the residents varies with an average depth value of 12.04 meters below the water surface. And for the standard deviation value of 2.83 meters, which means the measurement variation is ±2.85 meters.Then, to further clarify the understanding of the distribution of groundwater depth values in the research location, the following is a picture of the groundwater depth values affixed to the research location shown in Figure 4. | Figure 4. Contour Map of the well water depth on research location |
From the data in the image above, it can be ignored that the shallowest depth of land is in the north-west and north-east cardinal directions. While the deepest depths are in the south and central north wind direction in the study area.
3.2. Salinity
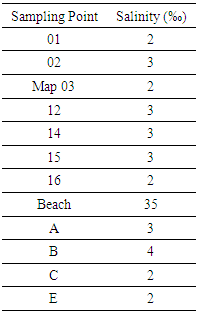
In this parameter, measurements are taken in the laboratory of Geophysics University Brawijay using a refractometer to measure the salinity in groundwater, which is shown in Table 5.Table 5. Groundwater salinity value from the coastal area of Situbondo
 |
| |
|
Based on table 5, it can be seen above that the difference between private well water and seawater is quite different from the salinity value, which is comparable to 1:10 with a value range of 2 to 35 ‰, which means that the value does not meet the standard value for air which can be reduced, namely 0‰ [11].Salinity is one of the parameters in determining whether or not water is suitable for consumption. Salinity is a parameter to measure the level of salinity or dissolved salt content in the air, which is expressed in ppt (parts per thousand) or per mile (‰), which is the same as the number of grams for each liter of solution. Classification of the level of salinity in groundwater based on its salinity is divided into 4 categories, namely freshwater with a salinity value < 0.5 ‰, brackish water ranging from 0.5 - 30 ‰, saltwater between 30 - 40‰, and the four very salty or seawater with a value > 40‰ [9]. Then to further clarify the understanding of the distribution of its contents, the following is a picture of the distribution of salinity content in air pasted to the research location shown in Figure 5.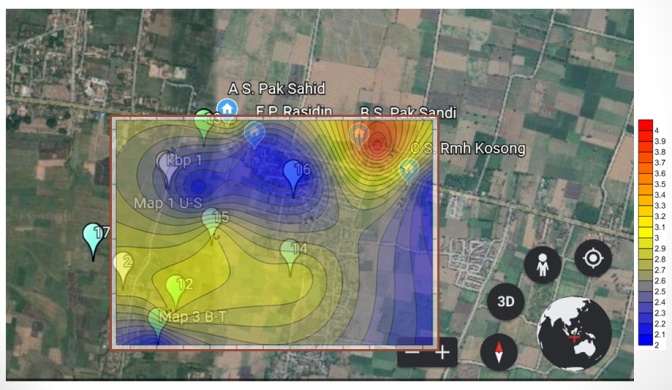 | Figure 5. Contour Map of salinity content on study location |
From the picture above, it is found that there are variations in the salinity value in groundwater in the study area. The lowest salinity values are in the southern, central, and eastern areas of the study area. This means that groundwater in this location contains the lowest salt content.From the data obtained, it can be concluded that the farther from the coastline, the salinity of groundwater will decrease, which is in line with research conducted by [6].
4. Conclusions
From the geoelectric resistivity measurement, the interpretive value of groundwater depth is 12.4 meters, and the average groundwater depth measurement is 12.04 meters below the surface, which means that the interpretation value is not much different from the direct measurement value.Then based on the salinity parameter, it can be concluded that the area measured in this study experienced intrusion, with an average salinity value of 2.6‰. Therefore, in general, it can be assumed that the intrusion of seawater occurred at the research location. And second, that the farther from the coastline, the salinity of groundwater will decrease.The level of salinity in the research area produces a distribution pattern that is not uniform, which means that there are dots and there are points with high salinity. Then in this study, we get new insights, that in a place where sea air intrusion occurs, not all of them are affected by sea air intrusion.And for recomendation, further research is needed to obtain groundwater salinity values that are close to 0 along the road from Situbondo District - Banyuwangi Regency to obtain a broader picture.
References
| [1] | Analisis Intrusi Air Laut dengan Pengukuran Total Dissolved Solid (TDS) Air Sumur Gali di Kecamatan Padang Utara. Afrianita, Reri, Edwin, Tivany and Alawiyah, Aroiya. 2017, Jurnal Teknik Lingkungan UNAND , pp. 62-72. |
| [2] | Priadharma, Mohammad Setia. Intrusi Air Laut di Kotamadya Pontianak. Depok: UI: Skripsi Sarjana Departemen Geografi, 1999. |
| [3] | Gejala Intrusi Air Laut di Daerah Pantai Kota Pekalongan. Widada, Sugeng. 2007, Jurnal Ilmu Kelautan UNDIP, pp. 45-52. |
| [4] | Analisis Faktor Risiko Kebiasaan Mengkonsumsi Garam, Alkohol, Kebiasaan Merokok dan Minum Kopi Terhadap Kejadian Dipertensi Pada Nelayan Suku Bajo Di Pulau Tasipi Kabupaten Muna Barat. Elvivin, Lestari, Hariati and Ibrahim, Karma. 2016, Jurnal Ilmiah Mahasiswa Kesehatan Masyarakat Unsyiah. |
| [5] | Perceptions of Sacred Site (Petren) and Plant Diversity in Malang, East Java, Indonesia. Batoro, Jati, Wiyono and Lutfi, Ismail. 06, s.l.: International Journal of Basic & Applied Sciences IJBAS-IJENS, 2019, Vol. 19. 190906-3535. |
| [6] | Groundwater Vulnerability from Sea Water Intrusion in Coastal Area Cilacap, Indonesia. Purnama, Setyawan. 2019, Indonesian Journal of Geography Vol 51 No. 2, pp. 206 - 216. |
| [7] | Study on seawater intrusion in Laizhou bay coastal zone based on groundwater model. Wang, Min, et al., et al. 2019, International Journal of Low-Carbon Technologies, pp. 222–226. |
| [8] | Seawater Intrusion Modeling On Groundwater Confined Aquifer In Semarang. Suhartono, Edy, Purwanto, P. and Suripin, S. Semarang: ScienceDirect, 2014. International Conference on Tropical and Coastal Region Eco-Development 2014 (ICTCRED 2014). pp. Procedia Environmental Sciences 23 (2015) 110 – 115. |
| [9] | Pemodelan Salinitas Air Tanah di Surabaya Timur. Purwanti, Ipung Fitri, Anjasmara, Ira Mutiara and Suharmadi. 2006, Prosiding Seminar Nasional Manajemen Teknologi III, pp. D-8-1 s/d D-8-9. |
| [10] | Telford, W. M., et al., et al. Electrical properties of rocks. Applied Geophysics. Cambridge: Syndics of Cam, 1976, p. 452. |
| [11] | PERMENKESRI. Peraturan Meteri Kesehatan RI tentang Persyaratan Kualitas Air Minum No 492/Menkes/Per/IV/2010. Jakarta: Menteri Kesehatan Republik Indonesia, 2010. |

 Abstract
 Reference
 Full-Text PDF
 Full-text HTML