Md. Kholilur Rahman1, Md. Shanawez Hossain2
1Roads and Highways Department, Ministry of Road Transport and Bridges, Dhaka, Bangladesh
2BRAC Institute of Governance and Development, BRAC University, Dhaka, Bangladesh
Correspondence to: Md. Kholilur Rahman, Roads and Highways Department, Ministry of Road Transport and Bridges, Dhaka, Bangladesh.
| Email: |  |
Copyright © 2020 The Author(s). Published by Scientific & Academic Publishing.
This work is licensed under the Creative Commons Attribution International License (CC BY).
http://creativecommons.org/licenses/by/4.0/

Abstract
Environmental degradation related to hazardous pollutants from economic activity became a major concern in many rapidly developing mega cities of the global South. In this study, the level of selected parameters (pH, TDS, TSS, TS, Alkalinity, Hardness, DO, BOD, COD, Na, Fe, Cr, Ni, Cd, Pb, Cl-, Cu, and SO4-2, NO3- and PO4-2) were measured to find water quality of canals in Dhaka City, Bangladesh. Samples were collected from 17 different canals in and around Dhaka City Corporation (DCC) area. Principal Component Analysis (PCA) and Cluster Analysis (CA) were used to assess the metal contamination of chemical parameters in the canals. Mean, Median, Minimum, Maximum and Standard Deviation were used to assess the variation of results of samples of canals. The analysis shows that in most of the samples physical and chemical parameters of hazardous materials were found. SO4-2, Cr, Cu and Pb were present as major pollutants with high concentration level, while Cl-, Cd, Na and Fe emerged as minor pollutants. Further, TDS, Alkalinity and Hardness were found to increase alarmingly while BOD levels were found below the acceptable limit and rests were unchanged. Finally, data for the presence of metal in the canal sediments shows Cr and Pb levels were higher than the recommended sediment quality by both guidelines of Department of Environment (DoE), Bangladesh and the United States Environment Protection Agency (USEPA). From overall findings it is evident that sustaining environmental quality needs special attention to check hazardous pollutants in the water of canals in Dhaka.
Keywords:
Water Quality, Pollutants, Physical Characteristics, Chemical Characteristics, Principal Component Analysis, Cluster Analysis
Cite this paper: Md. Kholilur Rahman, Md. Shanawez Hossain, Assessing the Water Quality of Canals in Dhaka City, Bangladesh, American Journal of Environmental Engineering, Vol. 10 No. 2, 2020, pp. 35-43. doi: 10.5923/j.ajee.20201002.02.
1. Introduction
The detrimental effects on soil ecosystems as well as its potential health risks are degrading due to accumulation of physical and chemical parameters [1,2]. Heavy metals among the parameters are necessary to plants at certain levels and exceeding its threshold can be toxic [2,3]. Sources of these elements in soils mainly include natural occurrence emerged from parent materials and anthropogenic and elements are non-biodegradable inevitably. Such elements coming from industrialization and agricultural activates, deposition, such as atmospheric deposition, waste disposal, waste incineration, emissions from traffic, fertilizer application and long-term application of waste water in agricultural land and are found to mix with water of different canals in and around Dhaka city [2,3,4,5].Dhaka, the capital of Bangladesh is one of the most rapidly urbanized cities in the world with more than 20 million people in 2019 [6] and more than 21 million in 2020 [7] According to Canback Consulting of the Economist Intelligence Unit [8], it contributed around 40% of total Gross Domestic Product (GDP) of the country in FY2019-2020. Many industries have set up in and around the city during the last decade, and the number of new industries is continually increasing. The canals of Dhaka are increasingly being polluted with the city’s thousands of industrial units and sewerage lines dumping huge volumes of toxic wastes day and night containing lot of heavy metals. Heavy metals contamination in aquatic environment is of critical concern, due to toxicity of metals and their accumulation in aquatic habitats. Heavy metals pollute water of canals and mixes into global ecological system through rivers and seas which are the main pathways of natural water. Non-internment heavy metals mixed water has catenated to some severe human disease’s such as malformation, kidney damage, cancer, abortion and so on even death in some cases of high concentration.
2. Methods and Materials
The methodology followed for this study includes utilization of data from both primary and secondary sources. Water samples were collected from 17 canals (Table 1 and 2) on the months of December, 2019 and January, 2020 and samples were analyzed for the parameters, pH, TDS, TSS, TS, Alkalinity, Hardness, DO, BOD, COD, Na, Fe, Cr, Ni, Cd, Pb, Cl-, Cu, SO4-2, NO3- and PO4-2. Above mentioned chemical and chemical characteristics concentration in the collected water samples were determined by total extraction with Aqua-Regia. Thus, primary data were collected. Secondary data and information were collected from official and unpublished documents of various organizations including Bangladesh University of Engineering and Technology (BUET), Water and Sewerage Authority (WASA), Bangladesh Water Development Board (BWDB) etc. Published journals, thesis, annual reports and newspapers were also used. Analysis of primary and secondary data provided final results which are represented numerically and graphically. The extracted aqueous solution was analyzed for selected parameters by using different types of instruments. Na, Cr, Cu, Ni, Cd and Pb were analyzed by Flame Emission Atomic Absorption Spectrophotometer (FL-AAS Model: Shimadzu, Japan, AA6800) and PO4-2, NO3-, SO4-2 by Ion Chromatograph.Standard QA/QC protocol was followed throughout, including replicate analysis (1 in every 5 samples), checking of method blanks (1 in every 10 analysis) and standards (1 in every 10 analysis). The maxillofacial results were compared with the permissible safe levels for the water sample proposed by DoE. Multivariate statistical techniques [9,10,11,12,12,13,14,15] were adopted to assess the metal contamination in the water. For assessing water quality metal concentration was the primary assessment target. The established techniques of Pearson Correlation Analysis, Principal Component Analysis (PCA) and Cluster Analysis (CA) were used.
3. Canals of Dhaka
The total land area of Dhaka city is 300.00 sq.km [7] of which the surface water area is about 10-15% [16] (Figure 1). 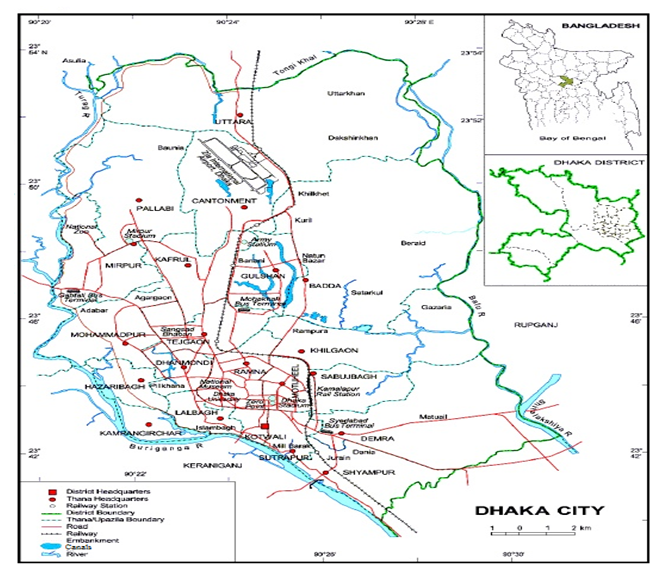 | Figure 1. Map of the Dhaka City with Canals (Source: Author) |
Until only three decades ago, Dhaka had over 50 canals surrounded by four rivers-Buriganga, Balu, Turag, and Sitalakshya [17]. The major canal systems in and around the capital are the (i) Degun–Ibrahimur–Kallyanpur canal that drains out to the Turag River; (ii) Dhanmondi–Paribagh–Gulshan–Banani–Mohacanali–Begunbari canal that drains out to the Balu River, and (iii) Segunbagicha–Jirani–Dholaicanal canal that drains out to the Balu and Buriganga rivers. In 2004 a committee identified 43 canals of which 26 canals under Dhaka WASA was recommended as recoverable [18] The 26 canals are Kalyanpur main canal, Kalyanpur Ka, Kha, Gha, Uma and Cha canals, Katasur, Ramchandpur, Abdullahpur, Diyabari, Digun, Gulshan-Banani, Mohacanali, Hazaribagh, Begunbari, Khilgaon-Basabo, Manda, Sutivola, Badda-Shahjadpur, Rupnagar, Baisteki, Kalshi, Bouniya, Ibrahimpur canals, Housing canal in Mirpur-14 and Jirani canal.However, in 2019 field investigation for this research found only 17 canals have water flow within the area of Mirpur to Jirani of DCC (Figure 2).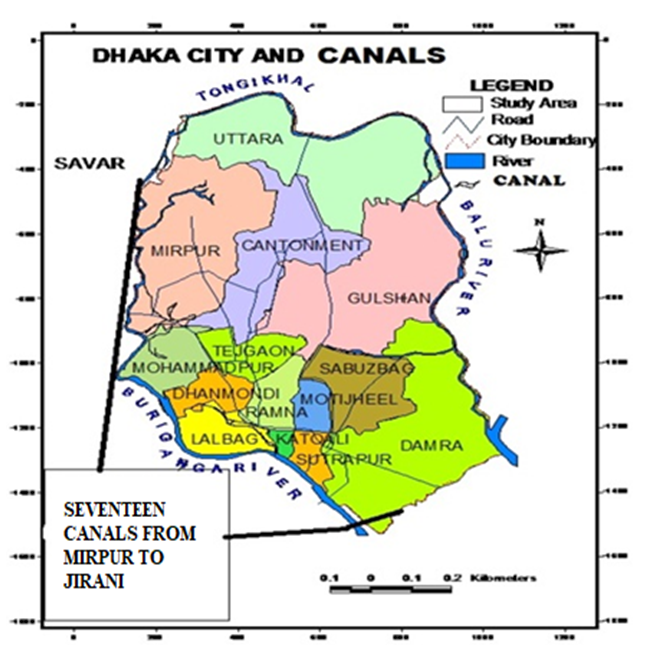 | Figure 2. Study area of canals of Dhaka City (Source: Author) |
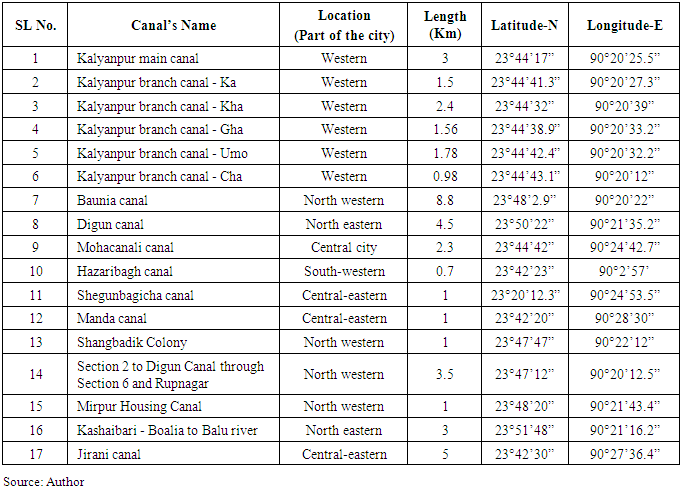
Table 1 shows location and major characteristics of these 17 canalsTable 1. Major Canals in the DCC Area
 |
| |
|
Among the 17 canals of the study area Hazaribagh, Kalyanpur and Digun canal were found highly polluted due to high concentration of industries and population in surrounding areas. Particularly, in the Hazaribag tannery area wastes coming from nearby tanneries are mixed with the water of Buriganga River through Hazaribag sluice gate (Figure 3). There are about 196 tanneries in Hazaribag area from where more than 1600 m3 tons of untreated and highly toxic effluents with a BOD₅ load of 17,600kg/day, an estimated 0.35 t/day of chromium is discharged into a lagoon of 25 ha and solid wastes are effused into canals every day [19]. Similarly, Mohakhali canal, Jirani canal and Segunbagicha canal also found polluted heavily with toxic pollutants mixing in the water from nearby industries. 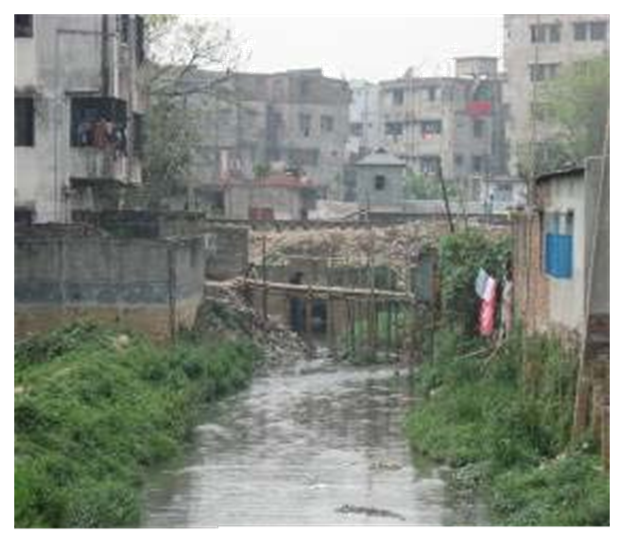 | Figure 3. Hazaribagh canal with waste water from tanneries (Source: Author) |
4. Results and Discussions
The water sample analysis results for different chemical and physical characteristics are presented in table 2 and 3. The comparison between the metal concentration present in the water samples of DCC canals with permissible metal concentration limit proposed by DoE and USEPA for the water sample shows that some canals in DCC area are facing metal pollution at an alarming level.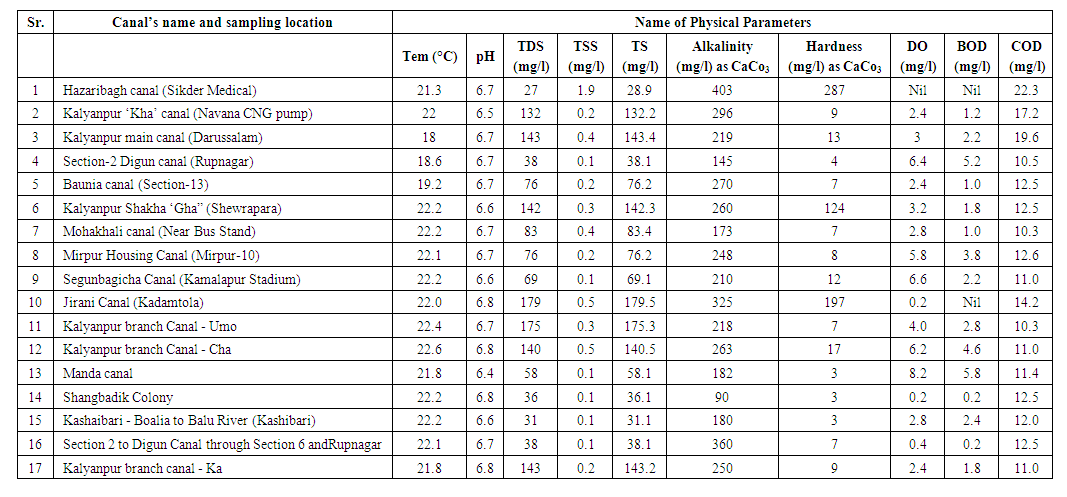 | Table 2. Physical Parameters of Water in Canals of Dhaka city |
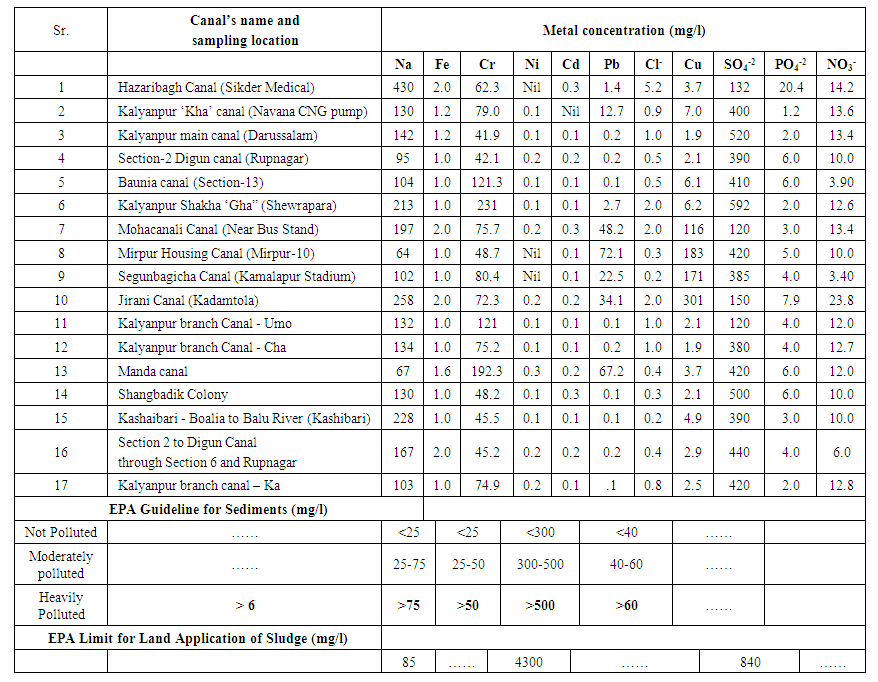 | Table 3. Metal Concentration in Water Sample of Canals of Dhaka city |
In comparison with the USEPA guidelines it was found the water samples of Mohakhali Canal, Mirpur Housing Canal, Segunbagicha Canal, Jirani Canal are heavily polluted with Cu. Baunia Canal, Kalyanpur Shakha ‘Gha” (Shewrapara), Segunbagicha Canal, Jirani Canal are heavily polluted with Cr. Furthermore, Pollution level of Pb in Mirpur Housing Canal is also exceeded the USEPA criteria.Hazaribagh Canal, Kalyanpur “Kha” Canal, Kalyanpur main Canal, Digun Canal are comparatively low for all tested heavy metals except Cr. By reviewing the pollutant limits of USEPA against the result from water samples analysis, it can be easily stated that the pollutant concentration in the water of some canals are below the prescribed hazard limit for water application but some canals exceed the EPA guideline for heavily polluted water for some metals. The standard value for drinking water of USEPA is given below in table 4 and table 5.Table 4. Standard Value for Drinking Water
 |
| |
|
Table 5. Standard Value for Drinking Water
 |
| |
|
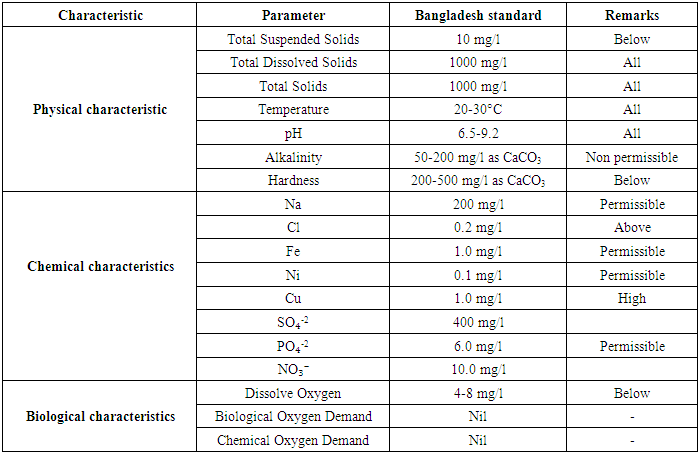
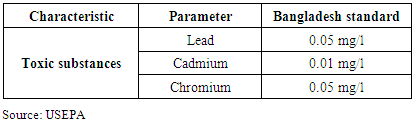
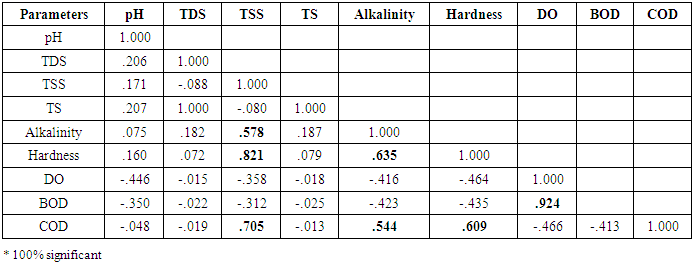
Laboratory test shows that the samples of all canals are below TSS, Hardness, DO while all samples are found above permissible limit for Pd, Cd and Cr. According to Kentucky Water Watch guideline, the samples of all canals are heavily polluted with chemical NO3-.Prior to form a judgment on the observed distribution of metal levels and interrelationship among them the metal data was first examined on the basis of linear correlation between metal pairs in terms of significant positive correlation coefficient. Strong positive correlations were observed for Hardness – TSS (r = 0.821), Hardness – Alkalinity (r = 0.635), BOD – DO (r = 0.924) and COD - TSS (r = 0.705), COD-Alkalinity (r = 0.544), COD - Hardness (r = 0.609) pairs (Table 6), indicating the existence of a common source/origin of these parameters in the water sample.Table 6. Correlation Matrix between Different Physical Parameter Pairs
 |
| |
|
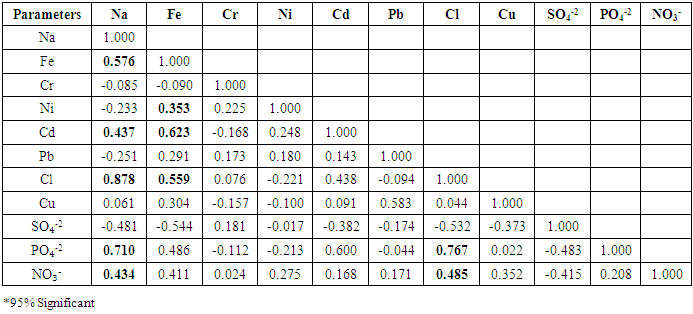
For Chemical characteristics, strong positive correlations were observed for Fe – Na (r = 0.576), Ni–Fe (r = 0.353), Cd – Na (r = 0.437) and Cd - Fe (r = 0.623), Cl--Na (r = 0.878), Cl--Fe (r = 0.559), Cu-Pb (r = 0.583), PO₄-2 -Na (r = 0.710), PO₄-2 -Cl- (r = 0.767), NO₃--Na (r = 0.434), NO₃-—Cl- (r = 0.485) pairs (Correlation matrix is shown in Table 7), indicating the existence of a common source/origin of these parameters in the sludge sample.Table 7. Correlation Matrix between Different Metal Pairs
 |
| |
|
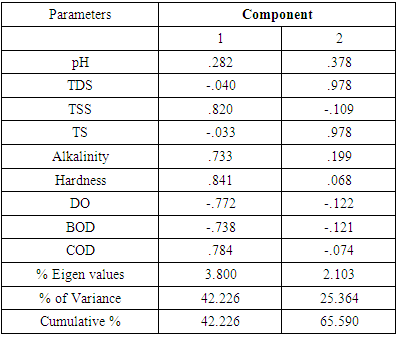
To find a solid assessment hypothesis of different physical parameters may have common origin was insured through multivariate methods of static analysis [5]. In this research, two multivariate techniques were applied: Principal Component Analysis (PCA) and Cluster Analysis (CA). The PCA has been considered as a useful tool for better understanding of the relationship among the variables (metal concentrations) and for revealing groups (or clusters) that are mutually correlated within a data body [2]. On the consequence’s PCA is a smaller number of new independent variables reduce overall dimensionality of the correlated data where each of which is a linear combination of originally correlated variables. CA solely aligns a set of observations into two or more unknown groups based on combination of internal variables. CA discovers a system of organized observation based on overall group membership that helps to define source profiles of different variables for example metal concentration and other inter-related interpretation in terms of possible parental sources [20]. Principal Component Analysis (PCA) using varimax normalized rotation was conducted for common source identification where the variables are correlated with two principal components in which 81.23% for physical and 79.01% for chemical characteristics of the total variance in the data was found. For physical parameters, the rotated Principal Component Loadings are given in Table 8. Principle component plot in a rotated space is shown in Figure 4. The first component with 15.64% of variance comprises TSS, Alkalinity (bold figures in Table 8) with high loadings. This association strongly suggests that these variables have a strong interrelationship. The corresponding Cluster Analysis Dendrogram is shown in Figure 5. Table 8. Rotated Component Matrix for Physical Characteristics (Rotation Method: Varimax with Kaiser Normalization.)
 |
| |
|
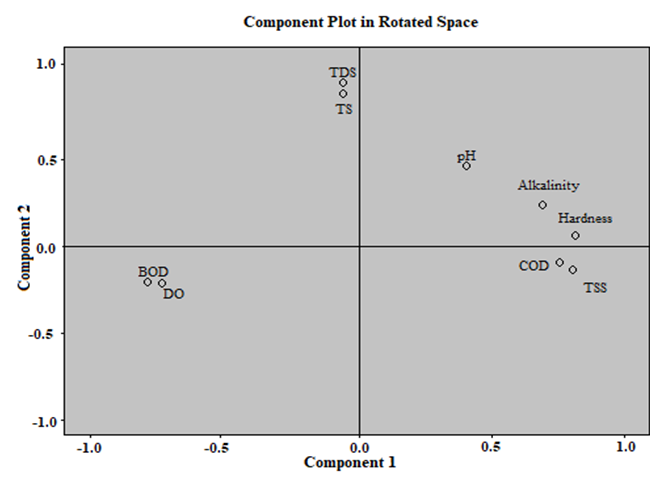 | Figure 4. Principal Component in a Rotated Space for physical characteristics |
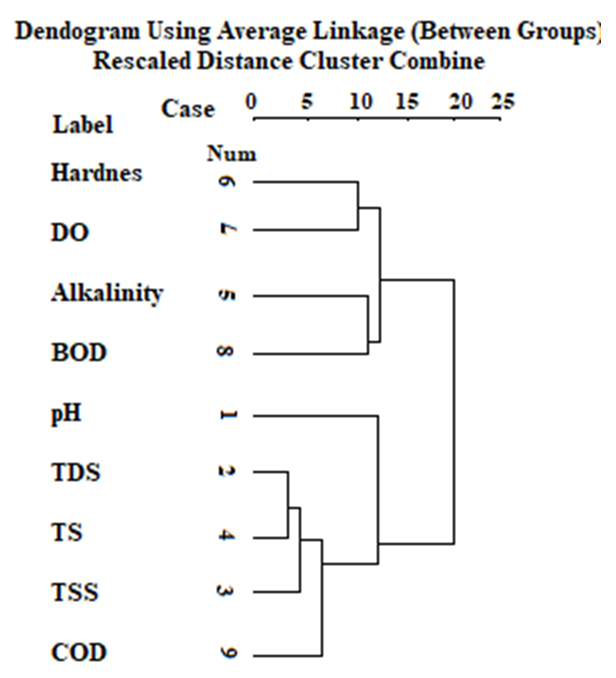 | Figure 5. Dendrogram of Cluster Analysis for Physical Characteristics |
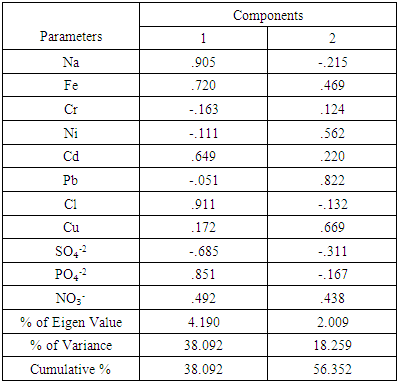
From the Cluster Analysis result it can be said that there is a strong correlation between DO-BOD Physical parameter pair, which is a good agreement with PC2, but Cluster Analysis results did not show a good agreement between TSS-Alkalinity pair. This result suggests that the strong relationship between TSS-Alkalinity pair does not confirm. On the other hand, the rotated Principal Component Loadings are given in Table 9. Principle component plot in a rotated space is shown in Figure 6. The first component with 38.092% of variance comprises Na, PO4-2 (bold figures in Table 9) with high loadings. This association strongly suggests that these variables have a strong interrelationship. The second component (PC2) contributes Cu and Pb at 3.31% variance which also infers the strong correlation between this metal pair. The corresponding Cluster Analysis Dendrogram is shown in Figure 7. From the Cluster Analysis result it can be said that there is a strong correlation between Na- PO4-2 heavy metal parameter pair, which is a good agreement with PC2, but Cluster Analysis results did not show a good agreement between Cr-NO3- pair. This result suggests that the strong relationship between Ni-SO4-2 pair does not confirm.Table 9. Rotated Component Matrix for Chemical Characteristics (Rotation Method: Varimax with Kaiser Normalization.)
 |
| |
|
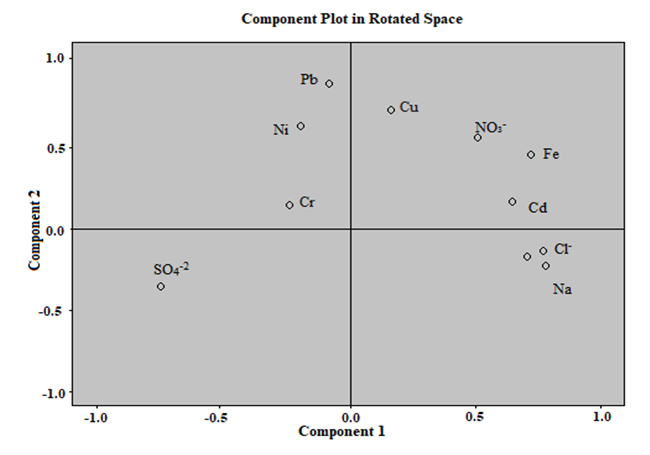 | Figure 6. Principal Component in a Rotated Space for Chemical Characteristics |
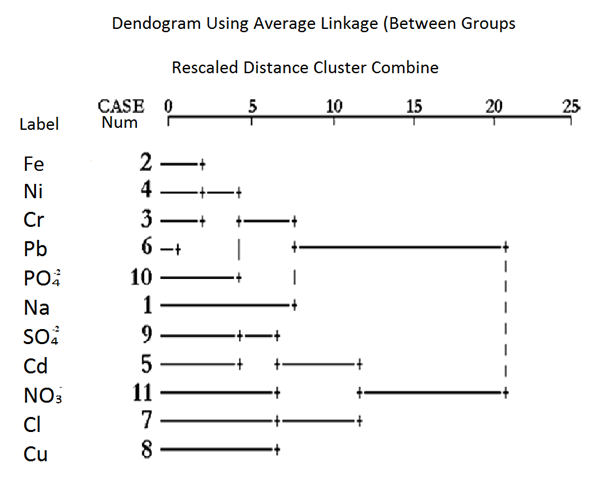 | Figure 7. Dendrogram of Cluster Analysis for Chemical Characteristics |
5. Conclusions
According to the standard value of the water, the analyses indicate serious pollution of water in canals of Dhaka city. Therefore, these canals are found not suited for fish and other aquatic animals and also highly hazardous to human health. Analysis found lower range of TSS, TDS, COD etc. from the standard value and linear regression analysis shows strong positive linear correlations among TDS, TSS and DO & SO4-2, Cu and Pb. Cr, Cu & Pb were found as major pollutants in some canals.Principle Component Analysis (PCA) shows strong interrelation between Cl- - Na pair and PO4-2 – Cl- pair in chemical characteristics. Cluster Analysis (CA) confirms relation between Na-Fe but not in Cl--Na metal pair. Comparing with standard guideline of USEPA, Cr, Pb and Cu levels are not fulfilled.Strong interrelation between BOD - DO pair and Hardness - TSS pair was found from Principle Component Analysis. Similar to Chemical Characteristics analysis, corresponding Cluster Analysis result confirms the relationship between COD–TSS pair but do not confirm the strong interrelationship between the Hardness – TSS pair. So, in most canals BOD, DO and TS levels are far from safe limit and hazardous for any physical use.
ACKNOWLEDGEMENTS
Various organizations and institutes provided data and information for conducting the research including Roads and Highways, Ministry of Road Transport and Bridges, Bangladesh; World University of Bangladesh and BRAC University, Bangladesh.
Disclosure
This paper is based on primary research conducted by the author, it is not submitted or published anywhere. Findings of the research can be used for varied purposes based on users own responsibility.
References
| [1] | McLaughlin, M.J., Parker, D.R. and Clarke, J.M. 1999. Metals and micronutrients-food safety issues. Field Crops Res., 60: 143-163. |
| [2] | Qishlaqi, A. and Farid Moore, F.2007.Statistical Analysis of Accumulation and Sources of Heavy Metals Occurrence in Agricultural Soils of Khoshk River Banks, Shiraz, Iran, American-Eurasian J. Agric. & Environ. Sci., 2 (5): 565-573. |
| [3] | Bilos C., Colombo, J.C. Skorupka, C.N. and Rodriguez, P.M.J. 2001. Sources, distribution and variability of air borne trace metals in La Plata city are, Argentina. Environ. Pollu., 11: 149-158. |
| [4] | Koch, M. and Rotard, W. 2001. On the contribution of background sources to the heavy metal content of municipal sewage sludge. Water Sci. Technol., 43: 67-74. |
| [5] | McLaughlin, M.J., Hammon, R.E. Mclaren, R. Speir G. and Rogers, T.W. 2000. A bioavailability-based rationale for controlling metal and metalloid contamination of agricultural land in Australian and New Zealand. Aust. J. Soil Res., 38: 1037-1086. |
| [6] | World Bank, 2019. Available in https://data.worldbank.org/indicator/EN.URB.LCTY?locations=BD. |
| [7] | World Population Review, 2020. Available in https://worldpopulationreview.com/world-cities/dhaka-population. |
| [8] | EIU (Economic Intelligence Unit), 2020. "Dhaka, Bangladesh GDP and Income Distribution". Available in https://www.eiu.com/n/solutions/country-analysis. |
| [9] | Facchinelli, A., E. Sacchi and L. Mallen 2001. Multivariate statistical and GIS-based approach to identify heavy metals sources in soils. Environmental Pollution, 114: 313-324. |
| [10] | Jolliffe, I. T. 1986. Principal component analysis. New York: Springer. |
| [11] | Lin, Y.P., Teng, T.P. and Chang,T.K. 2002. Multivariate analysis of soil heavy metal pollution and landscape pattern in Changhua county in Taiwan. Landscape and Urban Planning, 62: 19-35. |
| [12] | Nolte, J. 1988. Pollution source analysis of river water and sewage sludge. Environmental Technology Letters, 9, 857–868. |
| [13] | Sandhu, S. S., Warren, W. J., and Nelson, P. 1976. Trace inorganics in rural potable water and their correlation to possible sources. Water Research, 12, 257–261. |
| [14] | Tahri, M., Bounakhla, M., Bilal, E, Gruffat, J.J., Moutte J. and Garcia, D. 2005.Multivariate Analysis of heavy metal contents in soils, sediments and water in the region of Meknes (Central Morocco). Environmental Monitoring and Assessment, 102: 405-417. |
| [15] | Yeung, I. M. H. 1999. Multivariate analysis of the Hong Kong Victoria harbour water quality data. Environmental Monitoring and Assessment, 59, 331. |
| [16] | DoE, (2015). Environmental Quality Standards for Bangladesh. Dhaka: Department of Environment. GOB. |
| [17] | The Daily Star (2016). Dhaka city canals in death throes, available in https://www.thedailystar.net/city/dhaka-city-.canals-death-throes-1257046. |
| [18] | The Daily Star (2009), Over 50 canals near death, available in https://www.thedailystar.net/news-detail-96085. |
| [19] | Karim, Rezaul & Manshoven, Saskia & Islam, Md & Gascon, Juan & Ibarra, Mikel & Diels, Ludo & Rahman, Md. (2013). Assessment of an Urban Contaminated Site from Tannery Industries in Dhaka City, Bangladesh. Journal of Hazardous, Toxic, and Radioactive Waste. 17. 52-61. 10.1061/ (ASCE) HZ.2153-5515.0000139. |
| [20] | Jobson, J. D. 1991. Applied multivariate data analysis. NewYork: Springer. |

 Abstract
 Reference
 Full-Text PDF
 Full-text HTML