-
Paper Information
- Paper Submission
-
Journal Information
- About This Journal
- Editorial Board
- Current Issue
- Archive
- Author Guidelines
- Contact Us
American Journal of Environmental Engineering
p-ISSN: 2166-4633 e-ISSN: 2166-465X
2020; 10(2): 21-34
doi:10.5923/j.ajee.20201002.01

Limnology of Three Ponds in Chittagong University Campus, Bangladesh
 Abstract
 Reference
 Full-Text PDF
 Full-text HTML
Md. Saiful Islam 1, M. A. Azadi 2, Munira Nasiruddin 1, Md. Safiqul Islam 1
1Department of Zoology, University of Chittagong, Chittagong, Bangladesh
2International Islamic University Chittagong, Chittagong, Bangladesh
Correspondence to: Md. Saiful Islam , Department of Zoology, University of Chittagong, Chittagong, Bangladesh.
| Email: |  |
Copyright © 2020 The Author(s). Published by Scientific & Academic Publishing.
This work is licensed under the Creative Commons Attribution International License (CC BY).
http://creativecommons.org/licenses/by/4.0/

Physicochemical characteristics of any water body should be well known before using its water for different domestic purposes and also for different management needs. In Bangladesh, pond water is generally used by the middle to low income classes’ peoples for various purposes ignoring its quality. This study was conducted on monthly basis for two years, from January 2017 to December 2018 to find out the limnological qualities of water of three different types of ponds used by local inhabitants at Chittagong University Campus. The results of twelve limnological parameters were: air temperature (20.1-33°C), water temperature (18-33°C), transparency (14-85 cm), conductivity (22-423 μS/cm), total dissolved solids (TDS: 0-230 mg/l), pH (6.1-8.4), dissolved oxygen (DO: 0.9-16.5 mg/l), biochemical oxygen demand (BOD: 0.8-12.3 mg/l), free carbon dioxide (freeCO2: 2-26.97 mg/l), calcium (Ca++: 1.72-32.68 mg/l), total hardness (4-110 mg/l) and alkalinity (40-98 mg/l). Over use and dumping of household wastes disrupted the normal limnological features of Pond 1, in comparison with other two less (Pond 2) and almost unused (Pond 3) ponds. Extensive use by inhabitants and also physical structure of ponds were found to be responsible for variation and differences among some physicochemical properties of water. Among the three ponds, Pond 1 was found to be extensively used for household uses, than Pond 2 and Pond 3, and thus detected as high, less and not contaminated respectively. Significant direct or inverse correlations were observed among most of the factors.
Keywords: Chittagong University Campus ponds, Physicochemical parameters, Correlation, Limnology
Cite this paper: Md. Saiful Islam , M. A. Azadi , Munira Nasiruddin , Md. Safiqul Islam , Limnology of Three Ponds in Chittagong University Campus, Bangladesh, American Journal of Environmental Engineering, Vol. 10 No. 2, 2020, pp. 21-34. doi: 10.5923/j.ajee.20201002.01.
Article Outline
1. Introduction
- From prehistoric time in Bangladesh the man-made closed water bodies like ponds were excavated for the storage of water for the use of different purposes, like drinking, cooking, washing and bathing. But nowadays, most of the ponds are excavated for fish culture and many other recreational purposes like tourism, boating, swimming and also for angling. Bangladesh is one of the small but highly populated countries in the world. Besides ponds, many types of natural and artificial water bodies i.e. rivers, canals, swampy lands, big wet lands (haors, baors) and reservoirs are present in Bangladesh. However, among all the water bodies, pond water is mostly used by the rural and less by the urban inhabitants. The Chittagong University (CU) campus covering an area of 1754 acres, is situated in an urban hilly area of Hathazari Upazilla, Chittagong, where some manmade lentic and natural lotic water bodies including lakes and ponds are present. Some water reservoirs like ponds were constructed in the CU campus in different times for fulfilling the necessity of campus residents and are used by the residents for different purposes without knowing their quality status. Despite the high economic value of ponds, limnological works on the ponds are very few. Some mentionable ones on different ponds of Bangladesh and India are as follows: Sayeswara et al. [1], Bhatnagar and Devi [2], Verma and pandey [3], Yadav et al. [4], Devi and Antal [5], Mohammad et al. [6], Pandey and Tiwari [7], Rahaman et al. [8], Dhanasekaran et al. [9] and Ansari and Singh [10]. So far, no detailed works in this aspect were found on the three selected ponds at CU campus. So, the present study was undertaken. The objectives of the present investigation were to find out the physical (air and water temperature, transparency, conductivity, TDS and pH) and chemical (DO, BOD, free CO2, Ca++, total hardness, alkalinity) properties of water of three different level used ponds at Chittagong University campus which will be useful to understand the limnological status of pond waters and also to find out the extent of relationships among the parameters which was not done earlier.
2. Materials and Methods
2.1. Study Area
- Location and information of three ponds at Chittagong University campus (Fig. 1): Pond-1 is known as Shova colony pond (Latitude 22° 483778΄ and Longitude 91° 79082΄) (Fig. 1). It is a rectangular pond, covering an area of 838 m2 and an average depth of 3.1 m with muddy bottom and littoral zone. Littoral vegetation and big trees on the bank are present. It is a 25 years old manmade pond situated at North Campus, North of CU Central Playground. This was excavated for general use and is now extensively used by CU employees residing around the pond, for their household washing, bathing and also for dumping their wastes mainly during rainy season.Pond-2 is known as Gol pond (Latitude 22° 466205΄ and Longitude 91° 792128΄) (Fig. 1). It is a round shaped pond covering an area of 1288 m2 and a depth of 5 m. This pond was constructed in 1970 mainly for diving, swimming, water polo and other recreational purposes. This round shaped pond is highly deep, with sandy bottom, without littoral zone and without trees on the bank like the other two ponds. This pond is very near to CU South campus teachers’ quarters and west of South campus Mosque. The pond is not used for any household washing purposes except sometimes for swimming and water polo by the CU students.Pond-3 is known as Biological Science Faculty pond (Latitude 22° 466197΄and Longitude 91° 781166΄) (Fig. 1). This pond was excavated in 2006 mainly for washing, bathing and household use for the construction workers of CU Biological Science Faculty (CU-BSF) and also to supply water for the construction work of the same faculty. This rectangular shaped pond covered an area of 2632 m2 and a depth of 4.2 m, with a littoral zone and a few trees on the bank, located 200 m south of CU Biological Science faculty (BSF). After the construction work of CU-BSF, the pond is sometimes used for swimming and bathing by the students and some local inhabitants and local farmers for washing their locally produced vegetables and to some extent for fish culture.
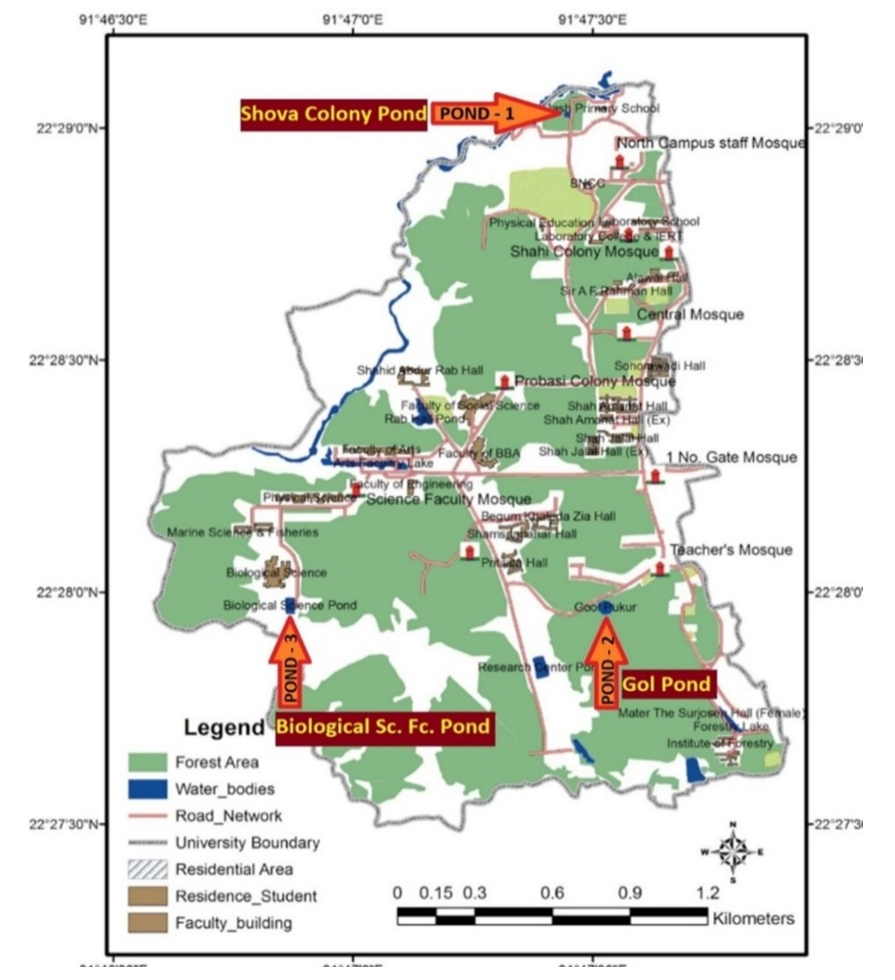 | Figure 1. Map showing location of the three experimental ponds (Pond 1: Shova colony pond, Pond 2: Gol pond and Pond 3: Biological Science Faculty pond) in the Chittagong University campus |
2.2. Sampling and Sample Processing
- Monthly water samples from subsurface layers of three experimental ponds (Pond 1, Pond 2 and Pond 3) were collected by brown color 250 and 500 ml reagent bottles between 9.00-11.30 am for two years period from January 2017 to December 2018. Some collected samples were tested in the field and some were taken to the departmental laboratory for further analysis within six hours. The parameters tested in the field were air and water temperature (by a general centigrade thermometer), Secchi disc transparency (by a 20 cm diameter Secchi disc), conductivity (by a digital EC 4 DIGIT, HM Digital Meter-China), pH (by a pHep HANNA-pH meter-Italy), TDS (by a DiST-2, HANNA Instruments, Italy). Rest of the six parameters (DO, BOD, free CO2, Ca++, Total hardness and Alkalinity) were analyzed in the laboratory of Zoology department, CU following the standard methods of APHA [11]. Results are expressed both monthly and seasonally (pre-monsoon- February to April, monsoon- May to July, post-monsoon- August to October and winter- November to January). Statistical analysis (correlation coefficient, significant level and standard deviation) was done following MS Excel version 2013.
3. Results and Discussion
- In the following account, the results and discussion on the analysis of twelve limnological parameters of the three experimental ponds of CU campus are given:
3.1. Air Temperature
- Air temperature was almost similar in all the three spots of the experimental ponds. The minimum and maximum air temperature in Pond 1, Pond 2 and Pond 3 varied from 20.1-32°C, 21-32°C and 21-33°C respectively (Fig. 2A). Minimum (20.1°C) and maximum (33°C) air temperatures were recorded in winter month January and in monsoon month June respectively. This agreed with the findings of Ghosh [12] in a pond of west Bengal, India, where the minimum (19°C) and maximum (34°C) air temperatures were recorded in January and June respectively. Mohammad et al. [6] also recorded similar results in Wyra reservoir, where they found minimum (22.8°C) and maximum (33.7°C) air temperature in January and June respectively.Minimum and maximum mean air temperatures varied from 24.43±4.01°C to 31.17±0.41°C, 25.5±3.39°C to 31.17±0.75°C and 25.83±3.66°C to 31.5±0.55°C during winter and monsoon in Pond 1, Pond 2 and Pond 3 respectively (Fig. 4). Among the three studied ponds, air temperature was higher in monsoon and lower in winter season (Fig. 4) which agreed with the findings of Baruah and Kakati [13] for a freshwater pond in India. Similar results were also recorded in Wyra reservoir [6], in a freshwater pond [4], in Santragachi and Joypur Jheel [14] and in a pond of semi-arid zone [10].
3.2. Water Temperature
- Water temperature and its seasonal fluctuations play a great role on the thermal feature and productivity of the water body. The solubility of gases in water varies inversely with temperature [15]. During the two years study period, the minimum and maximum water temperatures varied from 18–31°C, 20–32°C and 20–33°C in ponds 1, 2 and 3 respectively (Fig. 2B). Similar variations in water temperature were also recorded by Mohammad et al. [6] for Wyra Reservoir, Ghosh [12] for a pond in India and Islam and Chowdhury [16] for Trimohini Beel of Rajshahi. In aquatic ecosystem, many of the biotic organisms are influenced by water temperature directly or indirectly [17]. The standard level of water temperature range is 20 to 30°C [18], which was also observed in the present study except for a few months.The seasonal mean water temperature of Pond 1 was higher in monsoon (29.67±0.82°C) and post-monsoon (29.67±1.03°C) and lower in winter (23±4.1°C). Higher temperature in monsoon (30.58±0.66°C) and lower temperature in winter (24±3.69°C) was also recorded in Pond 2. Higher temperature (30.5±1.87°C) and lower temperature (24.83±3.54°C) were also recorded in post-monsoon and winter respectively in Pond 3 (Fig. 4). Similar results were also observed by Tidame and Thakare [19] and Ghosh [12] in different freshwater ponds of India, Islam and Chowdhury [16] in Trimohini Beel of Rajshahi, and Ansari and Singh [10] in the ponds of semi-arid zone, India.
3.3. Transparency (Secchi Depth)
- Water Transparency is one of the invaluable physical factors which have direct impact on aquatic organisms. During the two years study period, the minimum and maximum transparency varied from 14-72 cm, 20.5-85 cm and 16-75 cm in the ponds 1, 2 and 3 respectively (Fig. 2C). Nath et al. [20] working on a pond at Trivandrum, India, recorded similar range of transparency. Similar range of transparency was also recorded by Verma and Pandey [3] in an Indian pond. The transparency in Pond 1 was lower than the other two ponds which might be due to excessive washing of house hold goods, dumping of wastes and muddy bottom.Seasonal mean value of transparency in Pond 1 was observed to be higher (52.2±10.5 cm) in post-monsoon and lower (39.92±20.4 cm) in pre-monsoon (Fig. 4). Low transparency in pre-monsoon was due to low water level and waste materials entering in the pond from surrounding areas. Such low transparency in pre-monsoon season (February-April) was also recorded by Shukla [21] in Mohan Ram pond, Madhya Pradesh, India. The seasonal mean value of transparency in Pond 2 was higher (74.7±3.08 cm) in post-monsoon and lower (59.17±12.4 cm) in monsoon (Fig. 4). This agreed with the findings of Surana et al. [22] for Chimdi Lake in Nepal. The seasonal mean value of transparency in Pond 3 was higher (45.67±16 cm) in winter and lower (35.5±5.47 cm) in post-monsoon (Fig. 4). Lower value of transparency was due to rainfall, silt laden water and other dissolved particles. Lower transparency in post-monsoon was also observed by Verma and Pandey [3] in an Indian pond. Higher transparency in winter was also observed by Baruah and Kakati [13], Shukla [21] and Sahni and Yadav [17] in different Indian ponds. Maximum transparency observed in winter might be due to higher sedimentation of suspended matter in calm and quiet water environment [4,23].
3.4. Conductivity
- Conductivity indicates the ionic concentration of water which is very important for aquatic life. During the two years study period, the minimum and maximum range of conductivity in Pond 1 varied from 180 to 423 μS/cm (Fig. 2D). Highest conductivity recorded in Pond 1 might be due to the presence of more electrolytes as a result of excessive use of the pond water for different purposes by the surrounding people as well as entrance of waste materials from the adjacent areas into the pond. The range of lowest and highest conductivity in Pond 2 and Pond 3 varied from 22-85 μS/cm and 44-154 μS/cm respectively (Fig. 2D). This range was more or less similar with the findings of Bhuiyan and Gupta [24] and Sayeswara et al. [1] in their studied ponds. Conductivity of the investigated ponds was within the palatable range (50-500 μS/cm) [25]. The seasonal mean value of conductivity of Pond 1 (209±22.5 to 355.5±51.5 μS/cm) and Pond 3 (69.2±21.2 to 132.83±17.3 μS/cm) were higher in pre-monsoon and lower in post-monsoon season (Fig. 4). Dhanasekaran et al. [9] recorded more or less similar results in a perennial lake. Maximum conductivity in pre-monsoon was also recorded by Baruah and Kakati [13] and Sayeswara et al. [1] in their studied ponds. The lower value in post-monsoon was also observed by Islam and Chowdhury [16] in Trimohini Beel of Rajshahi. In Pond 2 conductivity (34.33±7.55 to 55.17±15.8 μS/cm) was higher and lower in winter and monsoon respectively (Fig. 4). Elayaraj et al. [26] recorded similar results in a pond of Tamil Nadu, India.
3.5. Total Dissolved Solids (TDS)
- Dissolved solids are very common in natural water. During the two years study period, the range of TDS varied from 10-230 mg/l, 0.0-20 mg/l and 10-70 mg/l in Pond 1, Pond 2 and Pond 3 respectively (Fig. 2E). The maximum TDS in Pond 1 was higher than the other two ponds but it was within the standard limit (500 mg/l) of ICMR [27]/BIS [28]. According to WHO [18], water is suitable when the TDS value is below 600 mg/l but is unpalatable when the TDS value is above or exceeds 1000 mg/l. Among the three ponds, higher TDS was noticed in Pond 1 due to mass use of water by local residence for different purposes. More or less similar TDS (346 to 406 mg/l) was recorded in Wyra reservoir, India by Mohammad et al. [6] and Ansari et al. [29] (312.355±28.511 mg/l) in ONGC pond, India. TDS was found to be directly related to conductivity. TDS, like conductivity indicated low amount of electrolytes in Pond 2, due to less use than the other two ponds. Thakre et al. [30] also observed lowest amount of TDS (7.381 mg/l) in their studied pond. Similar result was also observed by Sayeswara et al. [1] in Hosahalli pond, India.The seasonal mean values of TDS in Pond 1 (102±7.53 to 180±40 mg/l) and Pond 3 (30±11 to 58.33±7.53 mg/l) were higher in pre-monsoon and lower in post-monsoon (Fig. 4). This agreed with the findings of Baruah and Kakati [13] in a freshwater pond in Assam, India and Dhanasekaran et al. [9] in a perennial lake, India. In pre-monsoon most of the vegetation decays and due to evaporation of water, domestic waste water contamination may rise the TDS in water [31,32]. Seasonal mean value of TDS in Pond 2 (10±6.32 and 10±0 mg/l) was almost similar in three seasons except pre-monsoon where lower value (8.33±9.83 mg/l) was observed (Fig. 4), which agreed with the finding of Mohammad et al. [6] in Wyra reservoir, India.
3.6. pH
- The pH indicates alkalinity and acidity of water. During the two years study period, the range of pH observed was 6.7-7.8, 6.1-8.4 and 6.4-7.9 in Pond 1, Pond 2 and Pond 3 respectively (Fig. 2F). These findings showed similarities with the findings of Sayeswara et al. [1] for Hosahalli pond, India and with Jipsa et al. [33] for a lentic water body, India. Present findings of pH were within the range (6.5-8.5) of WHO [18], except for a few months.The seasonal mean value of pH in Pond 1 was observed to be higher (7.38±0.26) in post-monsoon and lower (7.1±0.27) in pre-monsoon (Fig. 4), which agreed with the finding of Thakre et al. [30] for a pond in India. The seasonal mean value of pH in Pond 2 was higher (7.75±0.08) in monsoon and lower (7.2±0.3) in post-monsoon (Fig. 4). And in Pond 3, it was higher in monsoon (7.38±0.15) but lower in pre-monsoon (7.17±0.19) and post-monsoon (7.17±0.14) (Fig. 4). Similar result was also observed in Wyra reservoir [6]. Higher pH in monsoon was also observed in different ponds of India [1,10,19].
 | Figure 2. Monthly variation in mean values (±SD) of six physical factors [air temperature (A), water tmperature (B), transparency (C), conductivity (D), TDS (E) and pH (F)] in three ponds (Pond 1, Pond 2 and Pond 3) at CU campus during January 2017 to December 2018 |
3.7. Dissolved Oxygen (DO)
- In aquatic habitat, the source of oxygen is atmosphere, rainfall and aquatic plants. During the two years study period the minimum and maximum range of DO in Pond 1 varied from 0.9 to 8.2 mg/l (Fig. 3A). Similar result was also observed by Devi and Antal [5] in a temple pond, India and Rahaman et al. [8] in two ponds of BAU campus, Mymensingh. The minimum and maximum range of DO varied from 4.4-16.5 mg/l and 4.4-14.1 mg/l in Pond 2 and Pond 3 respectively (Fig. 3A). The range of DO recorded by Patra et al. [14] was 2.39-14.76 mg/l in two Jheel water, 1.7-13.1 mg/l in two pond water [12] and 4.42-12.46 mg/l in a lake water [22]. These findings were more or less similar with the findings of the present study. A DO level of 6 mg/l of water is drinking standard for Bangladesh [18].The seasonal mean maximum value (4.57±2.15 mg/l) of DO of Pond 1 was observed in pre-monsoon and minimum (3.5±1.1 mg/l) in post-monsoon (Fig. 4). Similar results were also observed by Ansari and Singh [10] in two ponds of semi-arid zone, India. The minimum concentration of DO is dependent on the amount of rainfall and less exposure to sunlight. The reduction of DO in post-monsoon might be due to suspended organic materials entering into the pond after heavy shower. Baruah and Kakati [13] and Verma and Pandey [3] observed similar results in different pond water. The seasonal mean value of dissolved oxygen in Pond 2 was higher (12.23±3.95 mg/l) in winter and lower (7.17±1.56 mg/l) in post-monsoon (Fig. 4). And in Pond 3, it was higher (9.62±3.31 mg/l) in winter and lower (6.45±2.57 mg/l) in monsoon (Fig. 4). More or less similar result was also observed by Ghosh [12] in Mondal pond, India. Higher amount of DO in cold water during winter was due to higher holding capacity of dissolved gases by cold water [34,35].
3.8. Biochemical Oxygen Demand (BOD)
- Biochemical Oxygen Demand refers to the quantity of oxygen required by bacteria and other microorganisms in the biochemical degradation and transformation of organic materials under aerobic condition. During the two years study period, the range of BOD varied from 4.2-12.3 mg/l, 0.8-3.0 mg/l and 2.6-9.8 mg/l in Pond 1, Pond 2 and Pond 3 respectively (Fig. 3B). According to Ekubo and Abowei [36], the BOD levels between 1.0 to 2.0 mg/l is considered clean, 3.0 mg/l fairly clean, 5.0 mg/l doubtful and 10.0 mg/l definitely bad and polluted. In this context, BOD level of Pond 1 was doubtful and polluted round the year except in the months of June and July when the BOD value was below 5 mg/l. Pond 3 was also indicated near to doubtful in some months, and only Pond 2 indicated a clean water body round the year.The seasonal mean value of BOD of Pond 1 (4.95±0.92 to 8.78±2.26 mg/l), Pond 2 (1.25±0.36 to 2.73±0.22 mg/l) and Pond 3 (3.37±0.94 to 6.55±2.25 mg/l) were higher in monsoon and lower in winter (Fig. 4). This agreed with the findings of Yadav et al. [4], Elayaraj et al. [26] and Patra et al. [14] for some pond and Jheel waters of India. The minimum BOD observed in all the three ponds during winter was due to decrease in temperature which lead to decrease in microbial activity and algal blooms [19].
3.9. Free Carbon Dioxide (freeCO2)
- The source of free carbon dioxide (freeCO2) in water body is atmosphere, rainfall and respiration by aquatic animals. During the study period, the minimum and maximum freeCO2 in Pond 1 varied from 8.99-26.97 mg/l (Fig. 3C). Sayeswara et al. [1] observed similar range of freeCO2 (9.9 to 25.2 mg/l) in Hosahali Pond, India. In Pond 2 and Pond 3 minimum and maximum range of freeCO2 varied from 2.00-16.98 mg/l and 4.99-19.98 mg/l, respectively (Fig. 3C). Ghosh [12] and Surana et al. [22] observed more or less similar range of freeCO2 in a pond and lake in India. The freeCO2 level in Pond 1 was higher than the other two ponds which might be due to the entrance of waste material in the pond during monsoon and other seasons respectively and also due to absence of well protected dyke. According to Joshi et al. [37] addition of drainage is one of the main causal factors for increasing carbon dioxide in the water bodies.Seasonal mean maximum (18.31±7.14 mg/l) and minimum (12.3±2.25 mg/l) amount of freeCO2 in Pond 1 was observed in monsoon and post-monsoon respectively (Fig. 4). Whereas the seasonal mean maximum (12.15±6.24 mg/l) and minimum (8.49±2.81 mg/l) freeCO2 in Pond 3 was observed in monsoon and winter seasons respectively (Fig. 4). Surana et al. [22] recorded more or less similar result in a lake water of Nepal. The seasonal mean maximum (12±1.78 mg/l) and minimum (7.83±5.84 mg/l) freeCO2 in Pond 2 was observed in post-monsoon and pre-monsoon respectively (Fig. 4). This agreed with the findings of Sayeswara et al. [1] in a pond of Karnataka, India. The lower value of free CO2 in pre-monsoon was also observed by Ghosh [12] and Rahaman et al. [8] in other ponds.
3.10. Calcium (Ca++)
- Calcium has impact on the growth and population dynamics of freshwater flora and fauna. During the two years study period, the minimum and maximum amount of Ca++ varied from 9.46-32.68 mg/l, 1.7-18.92 mg/l and 5.16-30.96 mg/l in ponds 1, 2 and 3 respectively (Fig. 3D). The lowest amount of Ca++ in Pond 2 may be due to deficiency of Ca++ in surrounding soil and sandy bottom of the pond. In freshwater lake, Ca++ may vary from 7.21 to 41.68 mg/l [22]. A water body rich in calcium can hold above 25 mg/l calcium [38]. In this context Pond 1 and Pond 3 were found to be rich in calcium.The seasonal mean value of Ca++ in Pond 1 was observed higher (22.07±5.46 mg/l) in pre-monsoon and lower (15.5±3.77 mg/l) in post-monsoon (Fig. 4). Sayeswara et al. [1] observed similar results in Hosahali pond, India. The seasonal mean value of Ca++ in Pond 2 was observed to be higher (7.59±5.79 mg/l) in monsoon and lower (6.59±4.09 mg/l) in pre-monsoon (Fig. 4). Elayaraj et al. [26] also observed the highest amount of calcium during monsoon in a shallow pond of India. Lowest value in pre-monsoon was also observed by Mohammad et al. [6] in Wyra reservoir, India. The seasonal mean value of Ca++ in Pond 3 was higher (14.33±8.21 mg/l) in winter and lower (7.45±1.51 mg/l) in post-monsoon (Fig. 4) which was more or less similar with the findings of Shukla and Upadhyay [39] in a pond of India. The higher value of calcium in winter were also observed by Mohammad et al. [6] in Wyra reservoir and Yadav et al. [4] in an Indian pond. The seasonal mean lowest value of Ca++ in ponds 1 and 3 was observed in post-monsoon. It was probably due to dilution of pond water during rainy season. Water in calcium possibly decreased in this season. Same view was also given by Boyden et al. [40].
3.11. Total Hardness (TH)
- Hardness is the total soluble Ca++ and Mg++ salts present in water, expressed as CaCO3 equivalent. During the two years study period, the minimum and maximum amount of total hardness varied from 31-110 mg/l, 4-69 mg/l and 15-56 mg/l in ponds 1, 2 and 3 respectively (Fig. 3E). Hardness range varied from 32 to 156 mg/l in Chimdi lake, Nepal [22], which was more or less similar with present finding. The amount of total hardness in Pond 1 was more than the other two ponds. It was perhaps due to more use of soap in domestic washing and bathing by users. The lowest value of total hardness in Pond 2 was probably due to less use of soap in this pond. Total hardness in Pond 3 in most of the months was higher than Pond 2 but less than Pond 1. The use of soap for domestic washing and bathing was also observed in Pond 3. On the basis of hardness Kiran [41] classified the water body as soft (0-75 mg/l), moderately hard (75-150 mg/l), hard (150-300 mg/l) and very hard (above 300 mg/l). On the basis of this classification, Pond 1 was found to be soft except for few months when it was moderately hard and ponds 2 and 3 were found to be soft throughout the study period. Total hardness in all the three ponds was within the permissible limit (600 mg/l) of WHO [18].The seasonal mean values of total hardness in Pond 1 (44.8±2.79 to 61.67±25.1 mg/l) and Pond 3 (32±6.29 to 49±5.22 mg/l) were higher in winter and lower in post-monsoon (Fig. 4). Shukla and Upadhyay [39] observed more or less similar results in an Indian pond. The seasonal mean value of total hardness of Pond 2 (14.33±7.53 to 35±20.5 mg/l) was higher in winter and lower in pre-monsoon (Fig. 4). Lowest value of total hardness in pre-monsoon was also observed by Shukla [21] in Mohan Ram Pond, India. More total hardness in Pond 1 was due to extensive use by surrounding peoples for their household uses than the other two ponds. Total hardness in all the three ponds was higher in winter due to high evaporation and low water volume. According to Mohammad et al. [6], hardness is inversely proportional to water volume and directly proportional to rate of evaporation which agreed with the present findings.
3.12. Alkalinity
- Presence of carbonates, bicarbonates and hydroxides in water is the most common cause of alkalinity in natural water. The concentration of mainly carbonate and bicarbonate in the water, that is responsible for buffering capacity, is the total alkalinity of a water body. The minimum and maximum amount of total alkalinity during the study period varied from 42-98 mg/l, 40-82 mg/l and 42-92 mg/l in ponds 1, 2 and 3 respectively (Fig. 3F). Almost similar range of alkalinity were also observed by Mohammad et al. [6] in a reservoir, Surana et al. [22] in a lake and Sayeswara et al. [1] in a pond water. In pond water the desirable range of alkalinity as CaCO3 is considered as 50-150 mg/l but above 20 mg/l and below 400 mg/l is the acceptable range [42]. The increased alkalinity in pond water might be due to degradation of plants and organisms and organic waste materials [43,44]. The value of alkalinity in all the three ponds was within the permissible (600 mg/l) limit of WHO [18].
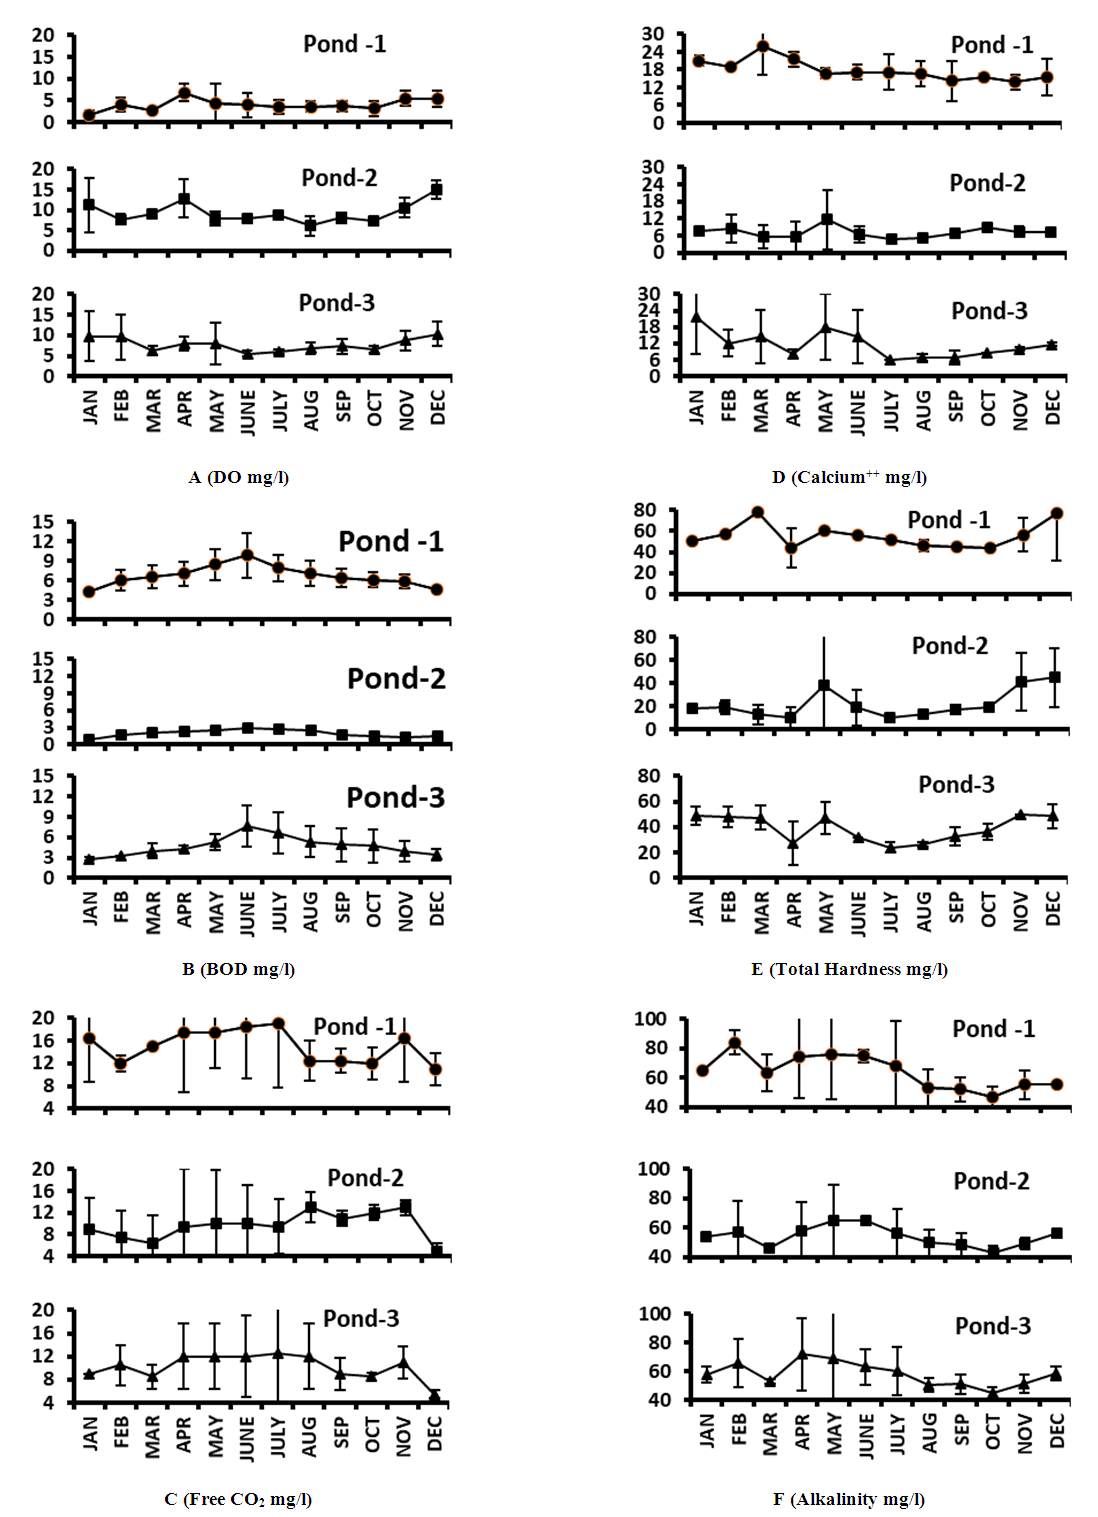 | Figure 3. Monthly variation in mean values (±SD) of six chemical factor [DO (A), BOD (B), Free CO2 (C), Calcium++ (D), Total Hardness (E) and Alkalinity (F)] in three ponds (Pond 1, Pond 2 and Pond 3) at CU campus during January 2017 to December 2018 |
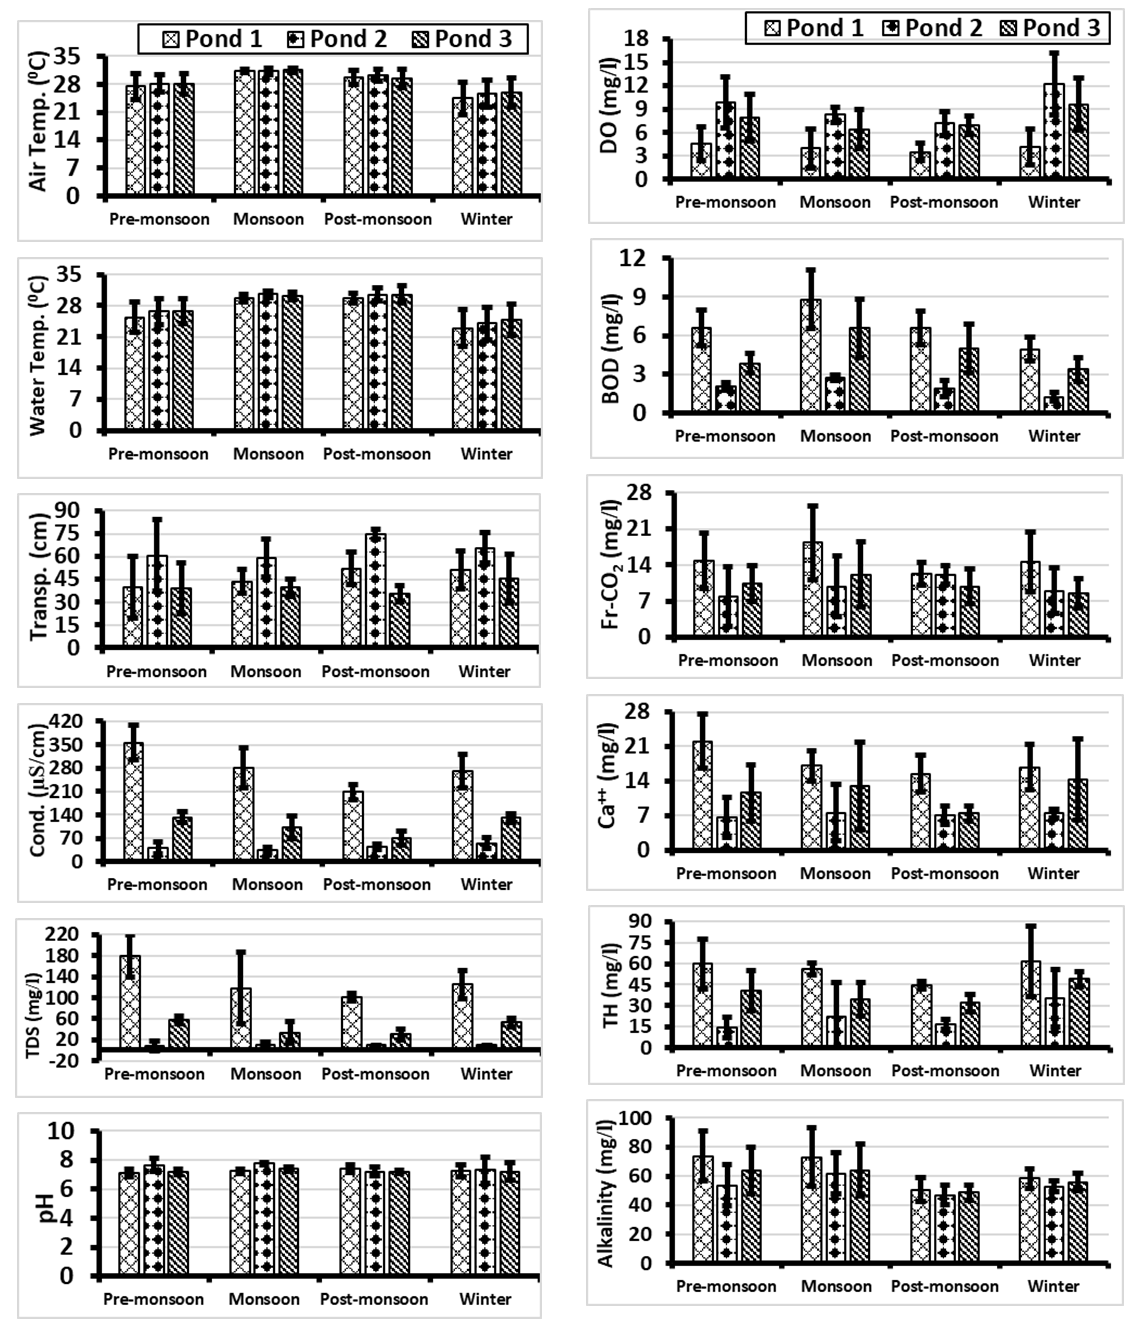 | Figure 4. Seasonal variation of mean air and water temperature, transparency, conductivity, TDS, pH, DO, BOD, freeCO2, calcium, total hardness and alkalinity of Pond 1, Pond 2 and Pond 3 during January 2017 to December 2018 |
3.13. Correlation among the Limnological Parameters
- Correlation coefficients amongst the mean values of physicochemical parameters of the three studied ponds are given in Tables 1, 2 and 3. Highly significant relationships existed between air and water temperatures of Pond 1 (r = 0.96, P<0.001), Pond 2 (r = 0.97, P<0.001) and Pond 3 (r = 0.92, P<0.001) (Tables 1-3). According to Surana et al. [22] air temperature showed a strong positive significant correlation (r = 0.94) with water temperature in Chimdi lake, Nepal. Similar result was also observed by Mohammad et al. [6] in Wyra reservoir and Kant and Anand [45] in Ansar Lake, India. Air temperature in pond 2 also showed positive significant relationship with freeCO2 (r = 0.51, P<0.1) and inverse relationship with conductivity (r = -0.52, P<0.1) and DO (r = -0.57, P<0.1) (Table 2). The mean value of air temperature in Pond 3 showed positive significant relationship with pH (r = 0.67, P<0.05) and freeCO2 (r = 0.50, P<0.1) and inverse relationship with DO (r = -0.64, P<0.05) and total hardness (r = -0.56, P<0.1) (Table 3). Surana et al. [22] also observed positive significant relationship of air temperature with freeCO2 and inverse relationship with DO.Mean water temperature showed positive significant relationship with BOD in Pond 1 (r = 0.69, P<0.05), in Pond 2 (r = 0.64, P<0.05) and in Pond 3 (r = 0.73, P<0.01) and with pH in Pond 1 (r = 0.63, P<0.05) and in Pond 3 (r = 0.56, P<0.1) and also showed inverse relationship with conductivity in Pond 1 (r = -0.51, P<0.1) and in Pond 3 (r = -0.66, P<0.05) (Tables 1 and 3). This agreed with the findings of Elayaraj et al. [26] for a shallow pond in India. Mean water temperature of Pond 2 showed positive significant relationship with freeCO2 (r = 0.54, P<0.1) (Table 2). Mean water temperature in Pond 3 showed inverse relationship with DO (r = -0.69, P<0.05), calcium (r= -0.68, P<0.05), TDS (r = -0.63, P<0.05) and total hardness (r = -0.68, P<0.05) (Table 3). Surana et al. [22] reported positive significant relationship of water temperature with freeCO2 and inverse relationship with calcium and total hardness. Whilst Elayaraj et al. [26] reported inverse relationship of water temperature with DO thus agreeing with the present study.Water transparency in Pond 1 showed inverse relationship with conductivity (r = -0.67, P<0.05), calcium (r = -0.56, P<0.1), TDS (r = -0.60, P<0.05), BOD (r = -0.52, P<0.1) and alkalinity (r = -0.57, P<0.1) (Table 1), which agreed with the findings of Patra et al. [14] for two Jheels in West Bengal, India. Transparency showed positive significant relationship with freeCO2 (r = 0.52, P<0.1) in Pond 2 (Table 2) and with DO (r = 0.71, P<0.01), conductivity (r = 0.57, P<0.1) and TDS (r = 0.51, P<0.1) in Pond 3 (Table 3) which showed similarities with the findings of Mohammad et al. [6] for a Reservoir in India.Mean water conductivity showed highly significant relationship with TDS in Pond 1 (r = 0.89, P<0.001) and Pond 3 (r = 0.92, P<0.001) and also showed positive significant relationship with DO in Pond 2 (r = 0.69, P<0.05) and Pond 3 (r = 0.56, P<0.1), with total hardness in Pond 2 (r = 0.66, P<0.05) and Pond 3 (r = 0.81, P<0.001), with calcium in Pond 1 (r = 0.79, P<0.01) and Pond 3 (r = 0.74, P<0.01), with transparency in Pond 3 (r = 0.57, P<0.1) and with alkalinity in Pond 1 (r = 0.76, P<0.01) (Tables 1-3). Similar results were also observed by Mohammad et al. [6] in an Indian reservoir. Conductivity also showed inverse relationship with pH (r = -0.71, P<0.01) and transparency (r= -0.67, P<0.05) in Pond 1, BOD in Pond 2 (r = -0.60, P<0.05) and Pond 3 (r = -0.53, P<0.1) and with water temperature in Pond 1 (r = -0.51, P<0.1) and in Pond 3 (r = -0.66, P<0.05) (Tables 1 and 3). Inverse relationship between conductivity and water temperature, pH, transparency and BOD was also reported by Elayaraj et al. [26] in other water bodies.Mean TDS in Pond 1 showed highly significant relationship with conductivity (r = 0.89, P<0.001), positive significant relationship with calcium (r = 0.65, P<0.05) and alkalinity (r = 0.57, P<0.1) and inverse relationship with transparency (r = -0.60, P<0.05) and pH (r = -0.59, P<0.1) (Table 1). The mean TDS in Pond 2 showed positive significant relationship with calcium (r = 0.77, P<0.01) and total hardness (r = 0.53, P<0.1) (Table 2). In Pond 3, mean TDS showed highly significant relationship with conductivity (r = 0.92, P<0.001) and total hardness (r = 0.82, P<0.001), also showed positive significant relationship with transparency (r = 0.51, P<0.1), DO (r = 0.67, P<0.05) and calcium (r = 0.62, P<0.05) and showed inverse relationship with water temperature (r = -0.63, P<0.05) and BOD (r = -0.72, P<0.01) (Table 3). Mohammad et al. [6] observed a positive significant relationship of TDS with conductivity, calcium, total hardness, turbidity, DO and alkalinity and an inverse relationship with pH and water temperature thus agreeing with the present study.The mean pH in Pond 1 showed significant relationship with water temperature (r = 0.63, P<0.05) and DO (r = 0.53, P<0.1), and inverse relationship with conductivity (r = -0.71, P<0.01), calcium (r = -0.71, P<0.01), TDS (r = -0.59, P<0.1) and alkalinity (r = -0.60, P<0.05) (Table 1). This agreed with the findings of Mohammad et al. [6] and Singh [46] for different water bodies in India. Mean value of pH in Pond 2 showed a positive significant relationship with BOD (r = 0.50, P<0.1) (Table 2). Mean value of pH of Pond 3 showed positive significant relationship with air temperature (r = 0.67, P<0.05) and water temperature (r = 0.56, P<0.1) (Table 3), which agreed with the findings of Elayaraj et al. [26] for a shallow pond in India.Mean DO of Pond 1 showed positive significant relationship with pH (r = 0.53, P<0.1) (Table 1). Mean DO of Pond 2 showed significant relationship with conductivity (r = 0.69, P<0.05) and inverse relationship with air temperature (r = -0.57, P<0.1) and freeCO2 (r = -0.54, P<0.1) (Table 2). Mean DO of Pond 3 showed significant relationship with transparency (r = 0.71, P<0.01), conductivity (r = 0.56, P<0.1), TDS (r = 0.67, P<0.05) and total hardness (r = 0.67, P<0.05) and inverse relationship with BOD (r = -0.83, P<0.001), air temperature (r = -0.64, P<0.05) and water temperature (r = -0.69, P<0.05) (Table 3). Mohammad et al. [6] also reported positive significant relationship of DO with conductivity, TDS, total hardness and turbidity and inverse relationship with water temperature in Wyra reservoir, India. Elayaraj et al. [26] observed an inverse relationship between DO and BOD in a shallow pond water body in India. Surana et al. [22] reported an inverse relationship of DO with freeCO2, and air temperature whilst Singh [46] observed positive significant relationship of DO with TDS and an inverse relationship of DO with air and water temperature thus agreeing with the result of present study. The mean value of BOD in Pond 1 showed positive significant relationship with air temperature (r = 0.77, P<0.01), water temperature (r = 0.69, P<0.05), freeCO2 (r = 0.56, P<0.1) and inverse relationship with transparency (r = -0.52, P<0.1) (Table 1). In Pond 2, BOD showed more significant relationship with air temperature (r = 0.69, P<0.05), water temperature (r = 0.64, P<0.05), pH (r = 0.50, P<0.1), alkalinity (r = 0.50, P<0.1) and inverse relationship with conductivity (r = -0.60, P<0.05) (Table 2). In Pond 3 BOD showed more positive significant relationship with air temperature (r = 0.79, P<0.01), water temperature (r = 0.73, P<0.01), positive significant relationship with freeCO2 (r = 0.59, P<0.1) and highly inverse relationship with DO (r = - 0.83, P<0.001) and inverse relationship with TDS (r = -0.72, P<0.01), total hardness (r = -0.68, P<0.05) and conductivity (r = -0.53, P<0.1) (Table 3). These findings are more or less similar with the findings of Elayaraj et al. [26] for a shallow pond in India where BOD showed a positive significant relationship with temperature, pH, alkalinity and inverse relationship with DO and conductivity.In pond 1, FreeCO2 showed a significant relationship with BOD (r = 0.56, P<0.1) (Table 1). FreeCO2 in Pond 2 showed positive significant relationship with air temperature (r = 0.51, P<0.1), water temperature (r = 0.54, P<0.1) and transparency (r = 0.52, P<0.1), and inverse relationship with DO (r = -0.54, P<0.1) (Table 2). Mean freeCO2 in Pond 3 showed positive significant relationship with air temperature (r = 0.50, P<0.1) and BOD (r = 0.59, P<0.1) and inverse relationship with total hardness (r = -0.53, P<0.1) (Table 3). Surana et al. [22] reported freeCO2 to show positive significant relationship with air and water temperature and inverse relationship with DO and total hardness in Chimdi lake, Nepal, while Rahaman et al. [8] observed inverse relationship of freeCO2 with DO in two ponds in BAU Campus, Mymensingh thus agreeing with the present finding. Patra et al. [14] reported positive significant relationship of freeCO2 with BOD, temperature and inverse relationship with DO in Jheel water of India.Calcium in Pond 1 showed positive significant relationship with conductivity (r = 0.79, P<0.01) and TDS (r = 0.65, P<0.05) and inverse relationship with pH (r = -0.71, P<0.01) and transparency (r = -0.56, P<0.1) (Table 1). Calcium in Pond 2 showed significant relationship with TDS (r = 0.77, P<0.01) and total hardness (r = 0.57, P<0.1) (Table 2). Calcium in Pond 3 showed positive significant relationship with conductivity (r = 0.74, P<0.01), TDS (r = 0.62, P<0.05) and total hardness (r = 0.67, P<0.05), and inverse relationship with water temperature (r = -0.68, P<0.05) (Table 3). This agreed with the findings of Mohammad et al. [6] in Wyra reservoir, India.Total hardness in Pond 1, did not show any significant relationship with any physicochemical parameters (Table 1), whereas total hardness in Pond 2 showed positive significant relationship with conductivity (r = 0.66, P<0.05), calcium (r = 0.57, P<0.1) and TDS (r = 0.53, P<0.1) (Table 2) and in Pond 3 showed highly significant relationship with TDS (r = 0.82, P<0.001) and conductivity (r = 0.81, P<0.001), positive significant relationship with DO (r = 0.67, P<0.05) and calcium (r = 0.67, P<0.05) and inverse relationship with air temperature (r = -0.56, P<0.1), water temperature (r = -0.68, P<0.05), BOD (r = -0.68, P<0.05) and freeCO2 (r = -0.53, P<0.1) (Table 3). Total hardness in ponds 2 and 3 showed positive significant relationship with conductivity, TDS and DO which agreed with the findings of Mohammad et al. [6] for Wyra reservoir, India. Surana et al. [22] also observed a positive significant relationship of total Hardness with calcium and an inverse relationship with air and water temperature and freeCO2 in a lake water.Total alkalinity in Pond 1 showed positive significant relationship with conductivity (r = 0.76, P<0.01) and TDS (r = 0.57, P<0.1) and inverse relationship with transparency (r = -0.57, P<0.1) and pH (r = -0.60, P<0.05) (Table 1) which agreed with the findings of Mohammad et al. [6] for Wyra reservoir, India, where they observed a positive significant relationship of alkalinity with conductivity and TDS and inverse relationships with pH and turbidity. Similar positive significant relationship of alkalinity with conductivity and TDS and inverse relationship of alkalinity with pH and transparency was also observed by Singh [46] for a pond in India. Total alkalinity in Pond 2 showed a positive significant relationship with BOD (r = 0.50, P<0.1) (Table 2). This agreed with the findings of Elayaraj et al. [26] for a shallow pond in India. In Pond 3, alkalinity did not show any significant relationship with other parameters (Table 3).
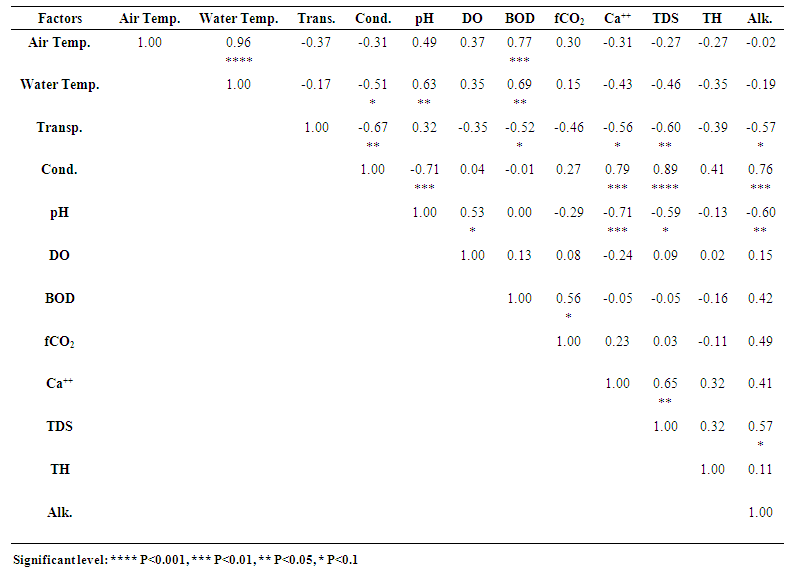 | Table 1. Correlation amongst the mean values (2017 & 2018) of different limnological factors of Pond 1 |
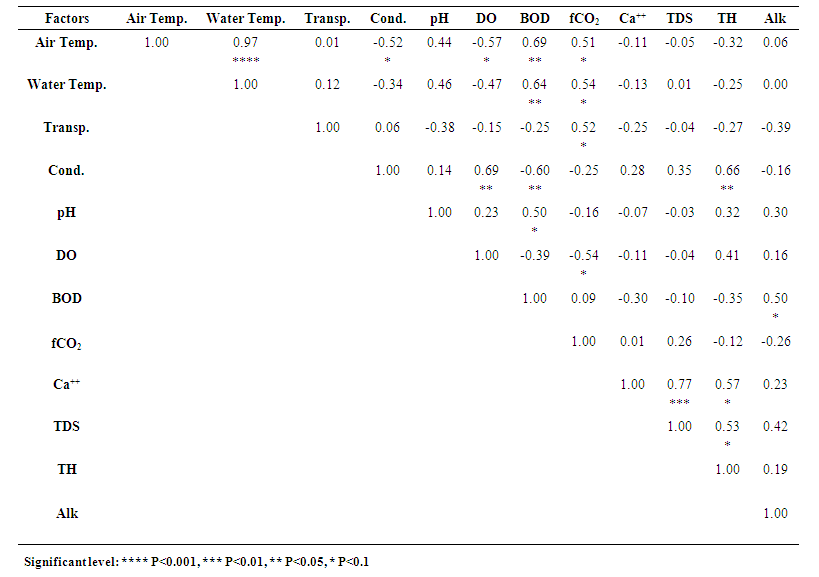 | Table 2. Correlation amongst the mean values (2017 & 2018) of different limnological factors of Pond 2 |
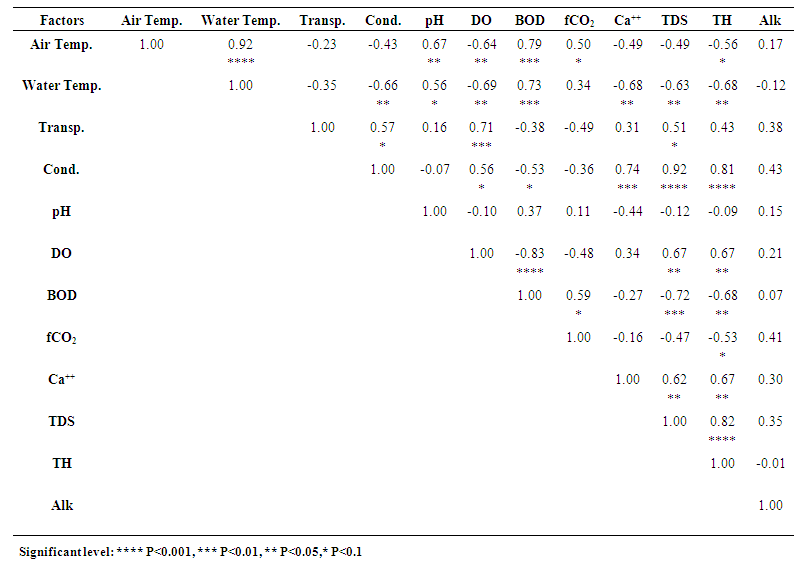 | Table 3. Correlation amongst the mean values (2017 & 2018) of different limnological factors of Pond 3 |
4. Conclusions
- The important physicochemical parameters like BOD, free CO2, calcium, total hardness, alkalinity, conductivity and TDS were higher for most of the time in Pond 1 than the other two ponds. DO and Secchi disc transparency was lower in Pond 1 than the other two ponds. For most of the time DO level was low and BOD, free CO2, total hardness, conductivity, alkalinity and TDS levels were high in Pond 1 indicating high contamination due to pollution which occurred due to human interference. Among the three ponds, Pond 1 was intensively used by the surrounding people for different purposes including bathing, washing clothes and utensils, fishing, discharging household wastes and surrounding runoff etc. Due to human health concern, if the pond water is to be used for drinking and other domestic purposes then activities such as discharging the household waste materials, surrounding runoff and high use of detergent should be stopped and without treatment these pond water should not be used for drinking.