-
Paper Information
- Paper Submission
-
Journal Information
- About This Journal
- Editorial Board
- Current Issue
- Archive
- Author Guidelines
- Contact Us
American Journal of Environmental Engineering
p-ISSN: 2166-4633 e-ISSN: 2166-465X
2018; 8(5): 167-173
doi:10.5923/j.ajee.20180805.01

Assessment of Inhalable Particulate Matter (PM) Associated with a Cement Factory in Tema, Ghana
 Abstract
 Reference
 Full-Text PDF
 Full-text HTML
Benjamin Afotey1, Ayatulai Abdul Mumin2
1Department of Chemical Engineering, Kwame Nkrumah University of Science and Technology, Kumasi, Ghana
2Wilmar Africa Limited, Tema, Ghana, West Africa
Correspondence to: Benjamin Afotey, Department of Chemical Engineering, Kwame Nkrumah University of Science and Technology, Kumasi, Ghana.
| Email: |  |
Copyright © 2018 The Author(s). Published by Scientific & Academic Publishing.
This work is licensed under the Creative Commons Attribution International License (CC BY).
http://creativecommons.org/licenses/by/4.0/

Atmospheric pollution and inhalation studies have focused on particulate matter due to correlations with various adverse health effects and mortalities. This research analyzed ambient concentrations of inhalable particulate matter (PM10) around a cement factory in Tema, a suburb in Ghana, in order to evaluate the potential health risks to the factory workers and residential settlements. Hourly, daily and monthly PM10 measurements made at two sampling stations, using MiniVol air samplers from January to March, were assessed. Mean daily, 24-hour concentrations of ambient PM10 level between 125.4090 – 514.0443 μg/m3 were recorded at the AFKO monitoring station, while mean daily 24-hour concentrations between 55.5360 – 429.0520 μg/m3 were recorded at the entering point of the plant. Daily 24-hour averaging PM concentrations at the exit monitoring station of the cement factory exceeded recommended guidelines for measured PM10 concentration of NAAQS for each day for all three months of data collection, and at the entering monitoring station for 27 of 45 days. In the month of March, at the entering monitoring station, PM10 concentrations were compliant for all days measured, and this may be partly due to the frequent rainfall events during this month. Finally, for all the days for the three months, data collected at both monitoring stations exceeded the WHO recommended guidelines for PM10.
Keywords: Inhalable particulate matter, PM10, Cement Factory, MiniVol Tactical Air Sampler, Tema
Cite this paper: Benjamin Afotey, Ayatulai Abdul Mumin, Assessment of Inhalable Particulate Matter (PM) Associated with a Cement Factory in Tema, Ghana, American Journal of Environmental Engineering, Vol. 8 No. 5, 2018, pp. 167-173. doi: 10.5923/j.ajee.20180805.01.
Article Outline
1. Introduction
- Air pollution may be considered an environmental health risk, having been associated with a number of acute and chronic effects [1-3]. The effects are seen in overall mortality and specific areas such as chronic bronchitis, respiratory and cardiovascular diseases and cancer [3, 4-6]. The association between air pollution and deaths from respiratory diseases and cardiovascular disease is of general concern to epidemiological researchers [4, 7, 8]. In the last few decades, many studies [4, 5, 9-14] have applied time-series methods to search for associations between air pollution and its health effects. It has been suggested that up to 8% of premature mortalities globally are related to both indoor and outdoor concentrations of particulate matter (PM), though these findings are difficult to interpret given the uncertainties present in the respective study design [1, 6, 15-17]. Several studies have suggested association between long-term exposure to PM and various health effects, including accelerated cardiovascular and respiratory mortality, compromised lung function and relative increase of lung cancer risk [1, 9-22]. Inhalable particulate matter (PM10), specifically, has been associated with increases in daily mortality and hospital admissions for respiratory distress (pneumonia, asthma and decreased lung function in children) [1, 20, 23].Particulate air pollution is a mixture of particles that vary in size, composition and origin. Commonly used indicators describing PM that are relevant to health concerns refer to the mass concentration of particles with aerodynamic diameter of less than 10 µm and of particles with aerodynamic diameter of less than 2.5 µm often called fine particulates [5, 6, 24]. Many factors contribute to the chemical composition of PM, including combustion sources, climate, season, and type of urban and/or industrial pollution [1, 25]. Particulate matter can be emitted from both natural and anthropogenic sources with both primary (directly emitted) and secondary (atmospherically derived) components [1, 26]. Primary sources include wildfires, sea spray, organic matter and the combustion of both fossil fuels and biofuels. Secondary sources of PM include wood smoke, gaseous vegetative emissions and vehicular emissions and other condensates from atmospheric chemistry [1]. The major components of PM consist of inert compounds, semi volatile organic compounds, metals, carbonaceous material mainly from combustion and vehicle exhaust, biological material, and minerals. The density, concentration, and composition of PM can vary widely among geographical locations [1, 6].Cement production operations have been associated with air emissions of a wide variety of criteria air pollutants, but most significantly, particulate matter. The cement production processes, including controlled technology and refined products, influence the variability, composition and amount of emissions from one cement industry to the other. One of the largest and oldest cement factories in Ghana is Ghacem, which is located at Tema, close to the Port (Tema Harbor). The objective of the study was to monitor and analyze hourly, daily and monthly concentrations of PM10 generated within and around the cement factory, compare measured concentrations to standards and determine any health risks to workers and settlements around the factory, in order to recommend air pollution control measures for implementation.
2. Materials and Methods
2.1. Site Selection: Profile of the Study Area, Tema Metropolis
- Tema Metropolis was established from the erstwhile Tema Municipality in 2007 with the promulgation of Legislative Instrument (LI) 1929. In 2012, the Kpone-Katamanso Sub Metropolitan Council was carved out of the Tema Metropolis to establish the Kpone-Katamanso District. The Tema Metropolis has three Sub-Metropolitan Councils, namely Tema West, Tema East and Tema Central.Tema Metropolis is a coastal district situated about 30 kilometers East of Accra, the Capital City of Ghana. It shares boundaries in the northeast with the Dangme West District, southwest by Ledzokuku Krowor Municipal, north-west by Adentan Municipal and Ga East Municipal, north by the Akuapim South District and south by the Gulf of Guinea. The Ashaiman Municipal is an enclave within the Tema Metropolis. The Metropolis covers an area of about 87.8 km2, with Tema as its capital. The metropolis lies in the coastal savannah zone. The Greenwich Meridian (i.e. Longitude 0°) passes through the Metropolis, which meets the equator or latitude 0° in the Ghanaian waters of the Gulf of Guinea. The Metropolis proximity to the sea, with its low lying terrain which projects into the sea makes it a natural endowment for a harbor. This evidently informed the decision of the construction of the Tema Harbor in 1957, making the Metropolis “the Eastern Gateway of Ghana”. The topography of the Tema Metropolis is generally flat and forms part of the coastal plains. The terrain of the district barely rises up to 35m above sea level. The flatness of land has made it flood prone, but this also makes it a good agricultural/developmental terrain. However, the only major constraint to this strength is the erratic rainfall pattern in the region. The Metropolis lies in the coastal savannah zone and therefore enjoys a dry equatorial climate. The rainy season is usually from April to July (major rainy season) and from September to November (minor rainy season). The highest amount of rain is experienced in May, June and early July. Temperatures are high all year round with significant daily and seasonal variations. Tema being an industrial hub, some areas have been demarcated to serve as greenbelts as a result of the absence of forest reserves (zones), to control the micro climate of Tema (climatic condition in relatively small area). Also, areas reserved as green belts are being encroached upon. This has led to changes in weather conditions with its associated effects, such as erratic rainfall patterns and loss of biodiversity. An area photograph indicating the location of the cement factory is shown in Figure 1.
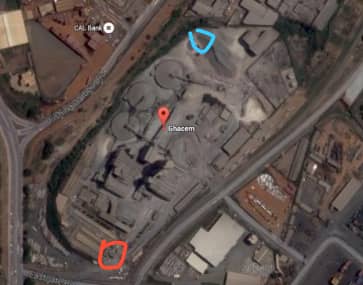 | Figure 1. Map of Tema Metropolis showing the location of the Cement Factory, Ghacem with the two monitoring stations [27] |
2.2. Local Sampling/Monitoring Station Description
- Since 2007, two ambient air monitoring stations, located at the entrance point to the factory and the exit point storage area (AFKO: AFrican-KOrean), have been collecting accurate and continuous measurements of air quality parameters, PM10 and TSP. The MiniVol Tactical Air Samplers (TAS) at both monitoring stations are located at the northern side of the sea, by the cement factory within the industrial area, and measure PM10 and TSP. The TAS was placed at an elevated height of at least 10 ft above the ground to sample PM10.
2.3. Data Collection and Analysis
2.3.1. Mini Vol Tactical Air Sampler (TAS)
- The MiniVol Portable Air Sampler, shown in Fig. 2, is an ambient air sampler for particulate matter and non-reactive gases. The patented low-flow technology used in the MiniVol was developed jointly by the U. S. Environmental Protection Agency (EPA) and the Lane Regional Air Pollution Authority in an effort to address the need for portable air pollution sampling technology.
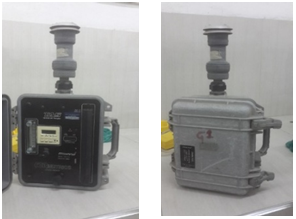 | Figure 2. A MiniVol Tactical Air Sampler (TAS) [28] |
2.3.2. Process of Data Collection and Calculations
- Monitoring was conducted for 15 days in January 2016, as well as 15 days for February and March 2016. The amount of dust that collects on the filter paper each day was determined with an analytical balance and recorded in micrograms. Additional parameters such as the flowrate, atmospheric pressure, ambient temperature, height of monitoring post and volume of air, required were obtained.2.3.2.1. Ambient PM10 Concentration EstimationTo calculate air flow rate at ambient conditions Qact, the slope of the calibration curve (mvol) and the intercept (bvol) are taken from the calibration curve and eqn. 1 is used.
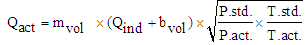 | (1) |
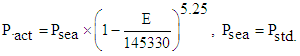 | (2) |
 | (3) |
 | (4) |
3. Results and Discussion
3.1. Ambient Concentrations of Inhalable Particulate Matter
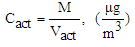
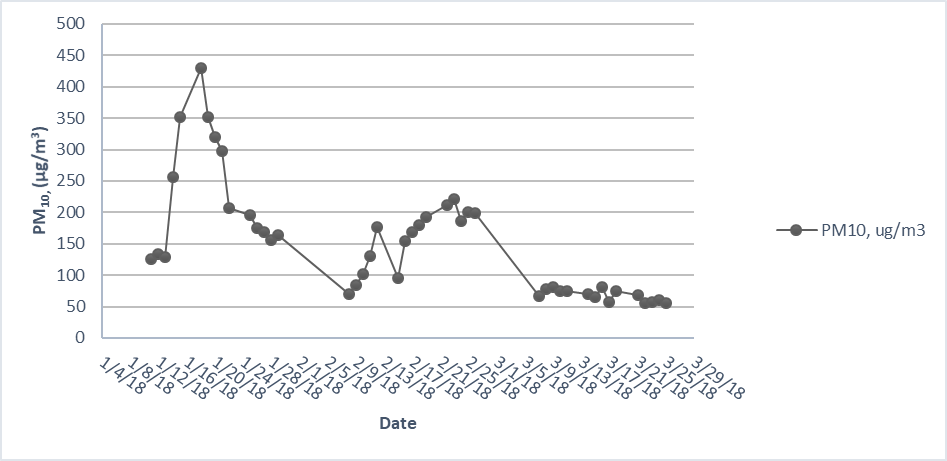
- Daily PM10 concentrations were obtained from the monitoring stations (entering point to plant and exit point of plant) from January 2016 to March 2016. The 24-hour daily mean concentrations ranged from 55.54 – 429.05 µg/m3 for the entering monitoring station and 125.41 – 514.04 µg/m3 for the exit monitoring station. Figure 3 and 4 show the mean daily 24-hour ambient concentrations of PM 10 for the plant entering point and exit point (AFKO) monitoring station, respectively.
 | Figure 3. Daily 24-hour mean PM10 concentrations (µg/m3) collected at plant Entering point air monitoring station at Ghacem from January to March, 2016. Current daily 24-hour guidelines recommended by NAAQS-EPA GH and the WHO occur at 100 µg/m3 and 50 µg/m3 respectively |
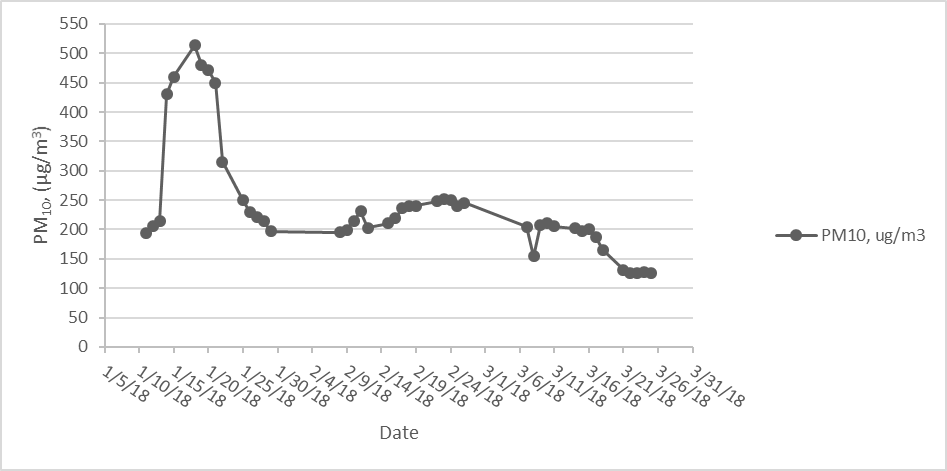 | Figure 4. Daily 24-hour mean PM10 concentrations (µg/m3) collected at Exit air monitoring station at Ghacem from January to March, 2016. Current 24-hour guidelines recommended by NAAQS-EPA GH and the WHO occur at 100 µg/m3 and 50 µg/m3 respectively |
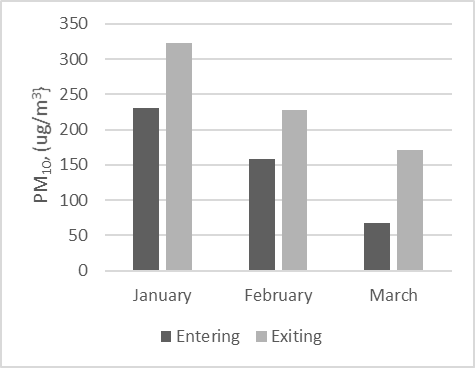 | Figure 5. Average monthly concentration of PM10 at the entering monitoring station and exiting monitoring station |
3.2. Air Quality Index (AQI) - A Guide to Air Quality and Human Health Pertaining to Ghana
- AQI is a measure of the quantity of harmful particles and other pollutants in the air. The AQI is an index for reporting daily air quality, and whether the associated short-term health effects might be a concern. EPA-Ghana calculates the AQI for five major air pollutants regulated by the Clean Air Act: ground-level ozone, particulate matter, carbon monoxide, sulfur dioxide, and nitrogen dioxide. For each of these pollutants, EPA has established national air quality standards to protect public health. Ground-level ozone and airborne particles are the two pollutants that pose the greatest threat to human health in this country. [29]The AQI is a yardstick that runs from 0 to 500 (µg/m3) on a scale. The higher the value, the greater the value of air pollution and the greater the health concern. For example, the AQI value of 50 represents good air quality with little potential to affect public health, while an AQI value over 300 represents hazardous air quality. An AQI value of 100 generally corresponds to the national air quality standard for pollutant, which is the level EPA has set to protect public health. AQI values below 100 are generally thought of as satisfactory. When AQI values are above 100, air quality is considered to be unhealthy - at first for certain sensitive groups of people, then for everyone as AQI values get higher. [29]For better understanding of the AQI, it is divided into six categories. Each category corresponds to a different level of health concern. The six levels of health concern are color-coded and their meaning are shown in Figure 6.Figures 7 & 8 show the number of days in the month that PM10 concentrations exceeded recommended guidelines for both air monitoring stations at the entering and exit points of the plant. Mean 24-hour daily maximum concentrations of PM10 recommended by NAAQS-EPA is 100 µg/m3 (corresponds to AQI of 100) for satisfactory air quality, the WHO is 50 µg/m3 (corresponds to AQI of 50) for good air quality. Also according to Figure 6, an AQI value of between 101-300 represents unhealthy air quality and above 300 corresponds to hazardous air quality. The number of days that have exceeded the 24-hour daily maximum concentration of PM10 for the recommended values of 50 & 100 were all the 15 days monitored during the study for the months of January and February (Figure 8). Seven days in January exceeded unhealthy AQI with none of the days in February and March exceeding (Figure 8). The majority of March (100%), few of February (20%) were compliant with the recommended guidelines for measured PM10 concentrations of NAAQS-EPA (Figure 7). Conversely, a total of 100% of January exceeded recommended 24-hour daily maximum guidelines for PM10 concentrations for the NAAQS-EPA and all 15 days in each of the three months monitored exceeded the WHO recommended guidelines (Figure 7).
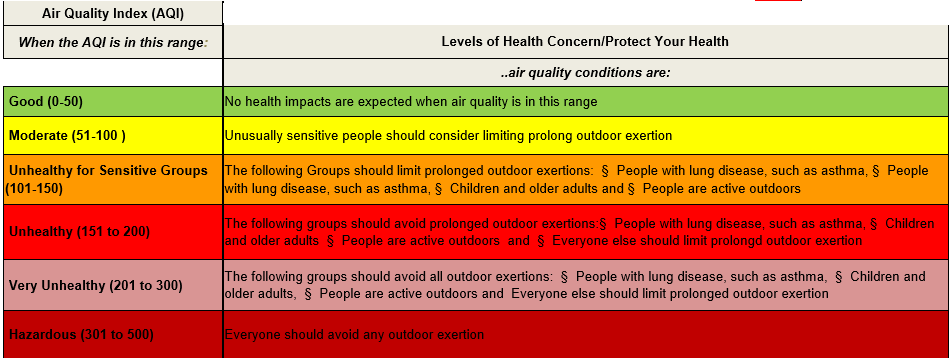 | Figure 6. Air Quality Index [29] |
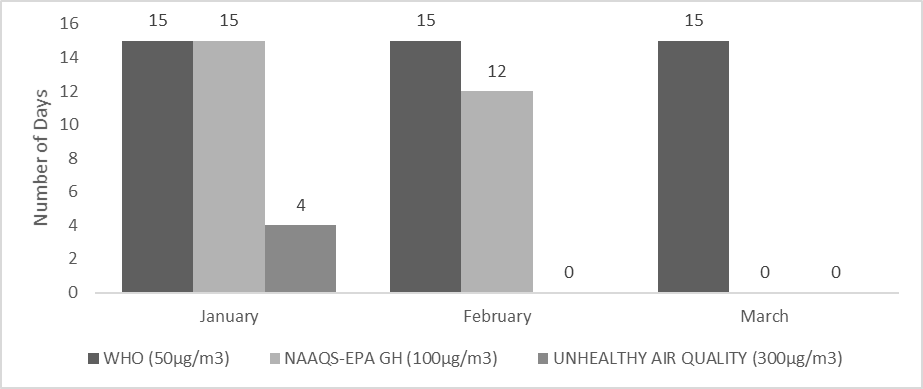 | Figure 7. Number of days per month PM10 concentrations exceeded recommended guidelines at entering monitoring station |
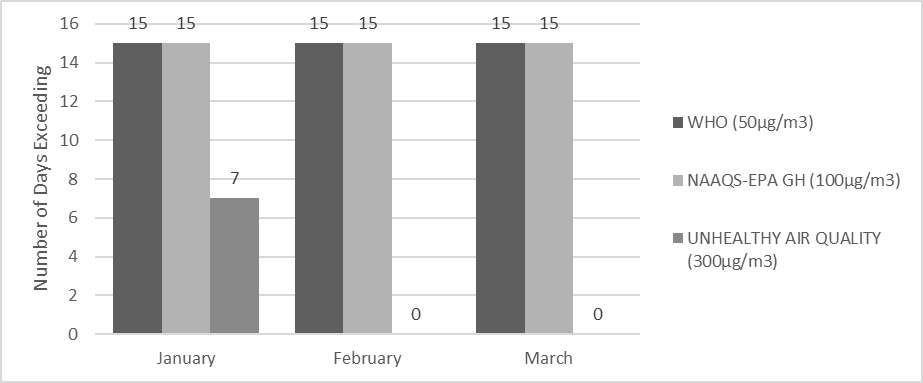 | Figure 8. Number of days per month PM10 concentrations exceeded recommended guidelines at exiting monitoring station |
4. Conclusions and Recommendations
- Daily 24-hour averaging PM concentrations at the exit monitoring station of the cement factory exceeded recommended guidelines for measured PM10 concentration of NAAQS for each day for all three months of data collection, and at the entering monitoring station for 27 of 45 days. In the month of March, at the entering monitoring station, PM10 concentrations were compliant for all days measured, and this may be partly due to the frequent rainfall events during this month. Additionally, for all the days for the three months, data collected at both monitoring stations exceeded the WHO recommended guidelines for PM10. The PM10 emissions results therefore present health risk to factory workers and closest population to the factory.It is however recommended that future research work should collect additional PM10 measurement data at a site downwind to confirm whether nearby population are at health risk from the factory’s operations. Further, analysis of weather patterns affecting downwind circulation of PM10 for a period of twelve months should also be considered.Finally, for better knowledge of PM10 concentration generated in the industrial area and within the cement factory, it is recommended that future research work should consider a twelve-month data collection. Further, data monitoring equipment should be equipped with software to enable daily 24-hour averaging data be automatically recorded on the internet to be downloaded when needed for analysis.
ACKNOWLEDGEMENTS
- I wish to thank the Safety team at the cement factory for their assistance with the use of the MiniVol Tactical Air Sampler device and data collection.