-
Paper Information
- Next Paper
- Previous Paper
- Paper Submission
-
Journal Information
- About This Journal
- Editorial Board
- Current Issue
- Archive
- Author Guidelines
- Contact Us
American Journal of Environmental Engineering
p-ISSN: 2166-4633 e-ISSN: 2166-465X
2018; 8(4): 128-134
doi:10.5923/j.ajee.20180804.07

A Platform for Data Handling, Analysis and Evaluation of Environmental Engineering Issues and Simulation Control
 Abstract
 Reference
 Full-Text PDF
 Full-text HTML
Pedro Niederhagebock Sidou, Bardo Ernst Josef Bodmann
Departamento de Eng. Mecânica, Universidade Federal do Rio Grande do Sul, Porto Alegre, Brazil
Correspondence to: Pedro Niederhagebock Sidou, Departamento de Eng. Mecânica, Universidade Federal do Rio Grande do Sul, Porto Alegre, Brazil.
| Email: |  |
Copyright © 2018 The Author(s). Published by Scientific & Academic Publishing.
This work is licensed under the Creative Commons Attribution International License (CC BY).
http://creativecommons.org/licenses/by/4.0/

Computer clusters are getting more and more employed for highly demanding computational tasks in environmental engineering, as the new parallel computing technologies are improving steadily and have attained a high standard. Nevertheless, for a task to execute in a cluster, it needs to be written following paradigms of parallelism, which is not necessarily dominated by the implementer of a specific problem, such as analysis of meteorological data, simulation of pollution dispersion among many others. Therefore, the aim of this work is to develop a computer platform capable of parallelizing, manipulating, analyzing and evaluating meteorological observational data and controlling simulation. Task specific features can be added to the platform through plugins, rendering it flexible and extensible for a large range of tasks. A simple plugin was created to validate and evaluate the functionality of the platform with satisfactory results. The test application considers a simple function to carry out the calculation of the four statistical moments (mean, variance, skewness and kurtosis) of a given variable in a given time scale. Despite its simplicity, this plugin can already be used for exploring the relevance of some variables in order to use this information in a procedure for data reduction.
Keywords: Climate data analysis, Parallel computing, Plugins
Cite this paper: Pedro Niederhagebock Sidou, Bardo Ernst Josef Bodmann, A Platform for Data Handling, Analysis and Evaluation of Environmental Engineering Issues and Simulation Control, American Journal of Environmental Engineering, Vol. 8 No. 4, 2018, pp. 128-134. doi: 10.5923/j.ajee.20180804.07.
Article Outline
1. Introduction
- Working with climate models and weather prediction in environmental engineering issues normally involves the manipulation of data which expands in usually more than three dimensions, i.e. time, longitude and latitude, and others. When dealing with many variables, long time spans and big regions, this kind of data can sometimes reach the magnitude of terabytes (TB). That is why (quasi-)real time simulations require very powerful computers and very well designed tools to provide good results in a reasonable time.Nowadays, the observation made by Moore in 1965 [1], which states that chips’ performances should double each two years, is approaching its limit due to the physical limitations involved in the processor components’ heat dissipation. Therefore, the computer science community came to the conclusion that the only way to overcome this fact and improve computer performance is by using more than one processing unit and make them work together to solve a given task. This technique is known as parallelization and is getting more and more common in applications such as web servers, graphic processing units (GPU’s) and scientific programming.Obviously, for a task to be treated in parallel, it does not suffice to tell the computer to do so. Software needs to be written in a parallel fashion and normally it involves considerable experience from the programmer. Note, that the environmental engineer or scientist is not necessarily a specialist in power computing, so that the present development is a project to open pathways so that non-specialists in parallel programming can implement their projects making use of parallel computing. To this end a platform is in developments allowing algorithms to use more than one processor and sharing common variables by synchronizing and carefully controlling memory access. However, there exist many technologies for parallelization, like the Message Passing Interface [2], POSIX threads [3], OpenMP [4], the OpenCL standard [5] and it can be very cumbersome to learn and decide which one is the most suited for a given application.Another issue faced by environmental engineers, scientists and/or programmers is the handling of data file formats. Some of the most known ones are the GRIB [6], HDF and netCDF [7]. For simple serial operations and data dumping, there are a couple of existing software like GrADS [8], NCL [9] and NCO [10] that are available for data access, manipulation and storage. However, when programming more complex applications, the developer is obliged to learn the respective application programming interface (API) and the file format’s conventions that are in use.Hence, the specific goal of this work is to report on the progress of developments of a tool capable of reducing efforts in creating computer applications oriented to meteorological and environmental data using paradigms of power computing. The purposed platform will be released under the GNU General Public License (GPL) with open source code, so that in future shared developments and further improvements by the users community may take place. Note, that this work reports on the very first β-version of the platform and that some improvement is still needed to provide the community with a fully functional and bug free software. In the following sections a description of the platform’s structure as well as a simple application case are provided to demonstrate its potential usage.
2. Platform Description
- For the first base version, it was stipulated that the platform should attain the following characteristics:Ÿ Have a light and intuitive user interface so that it can be easily handled by end users.Ÿ Extend its functionalities by loading third party written plugins. These new developed functions can produce results to other plugins by an exchangeable data format, making it easier to reuse solutions provided by others.Ÿ Be capable to read meteorological data files and load its content to a variable that can then be used by the developed functions. In this manner, the platform abstracts from the user avoiding the need for learning complicated API’s.Ÿ Automatizing, as far as possible, the parallelization of operations on meteorological and environmental data. The plugin developer needs to check only for the synchronization of some variables when needed.The platform was developed within the C++ programming language, a language created by Bjarne Stroustrup and first released in 1985. Despite it has lately lost attention in favour of some higher level languages like Java and Python, concerning power computing it is still superior compared to the latter two when high performance is the key issue, due to its support to low level C features on the one hand and the object oriented model paradigm on the other hand, which allows the creation of more complex structures in software. In the present version, the platform will support only plugins written in C++, but will be upgraded to support other languages in the future.The platform structure is composed by a core and five distinct and independent modules: a data manager, a user interface (UI), a parser, a plugin manager and a task manager. A brief description of them is provided in the following.Ÿ The core is the part of the framework that is responsible for managing and providing resources to the other parts of the program. It is the core which initializes and terminates all other modules and runs the main loop of the framework.Ÿ The UI, as its name suggests, is the communication door of the platform with the user. Given that this software was designed to be used in clusters, and often those are used remotely, it is imperative that the user interface can be transmitted through a connection. For the first version of the platform, the user interface was written with the lightweight library for manipulating terminal characters, ncurses. Therefore it can easily be transmitted with a protocol like Secure Shell Protocol (SSH) [11].Basically, the UI consists of a command prompt that waits for inputs from the user and a result window to show some output from the tasks. In the future, this interface will be upgraded to a more sophisticated scheme so that it better supports graphic visualization.Ÿ The data manager is simply a module responsible for storing, creating and deleting the variables in use. The data model of the platform supports five data types: integer, numeric, string, point and region. Integer and numeric variables can have a unit and a time scale associated to it. The interfaces responsible for holding the variables have methods to lock them through a mutex to ensure thread safety in parallel applications.The point data type is responsible for holding information relative to a position in space and it can store any number of variables (for instance: temperature, pressure, humidity, etc.) and each one of them also have a time scale associated to them, which may differ from the other scales). A region is a collection of points, which can be passed as a special argument to some functions so that operations on them are treated in parallel.Ÿ Parsing is the process of analysing and interpreting a given text segment according to a grammar. Parsers are used in compilers and interpreters to translate a high level language to machine code and its implementation can be very complex depending on the context. The one used in this platform is just an expression parser [12].The parsing process is divided in two phases. At first, a lexical analyser splits the input string in basic units of text called tokens. Each token may be an operator, a variable’s name, a function´s name, a number or even a string. To do so, the parser has to constantly communicate with the data manager and the plugin manager to be sure that a given symbol exists or not. Secondly follows a procedure that evaluates the meaning of the tokens followed by taking the string and generating a parse tree.Ÿ Plugins are the safest way to add functionality to a software without the need to recompile the whole system and hence reducing the risk of breaking the system. These can be written by third party developers in compliance with a respective application programming interface (API). After compilation they may be included into a dynamic library that may be called by the software.When the core initializes the plugin manager, it reads all the libraries stored in the plugins’ directory. Once loaded, the registered functions are available to be used by the platform.Ÿ The last but not less important module, the task manager, has the role of controlling and ensuring that the function’s tasks are executed in the correct order. At a first instance, the task manager will only support simple thread parallelization of tasks over regions. When initialized, the task manager creates a thread pool with the number of threads depending on the environment used.Functions are composed of one or more tasks. These tasks can be serial or parallel, depending on the nature of the problem. For parallel tasks, the task manager ensures that the execution is repeated and finished over all the points of a given region before starting to execute a new one.In the future, the task manager will also support the MPI standard, allowing this platform to parallelize tasks over all nodes of a cluster. Other features like parallelization over time and numeric calculations (which requires a much more sophisticated synchronization scheme) will be added as well.
3. An Application
- To validate the platform, we create a simple application. Motivated by the task of working with very large data sets, it becomes interesting to extract some information of its variables before applying analysis. Here, we use a simple statistical reasoning to reduce the original data set to a smaller set, that contains only variables that show some relevance for the specific problem in a given time scale.To this end we consider the distribution of a random variable
 that can be characterized by its statistic moments. An effective approach to reduce a data set is calculating its first moments in different time scales and observe how they behave. The
  moment is defined as
  and can be obtained in a unique way from the moment generating function (MGF)
 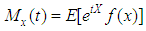 . MGFs have great practical relevance because they uniquely determine the probability distribution and also have useful analytical properties that can be handy do solve several problems. For instance
  and
and  is given by equation (1) .
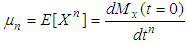 | (1) |
 are known as: mean
  standard deviation
  skewness
  and kurtosis
  where the last two are given in equations (2) and (3).
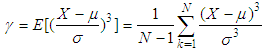 | (2) |
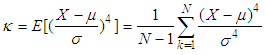 | (3) |
4. Testing the Plugin
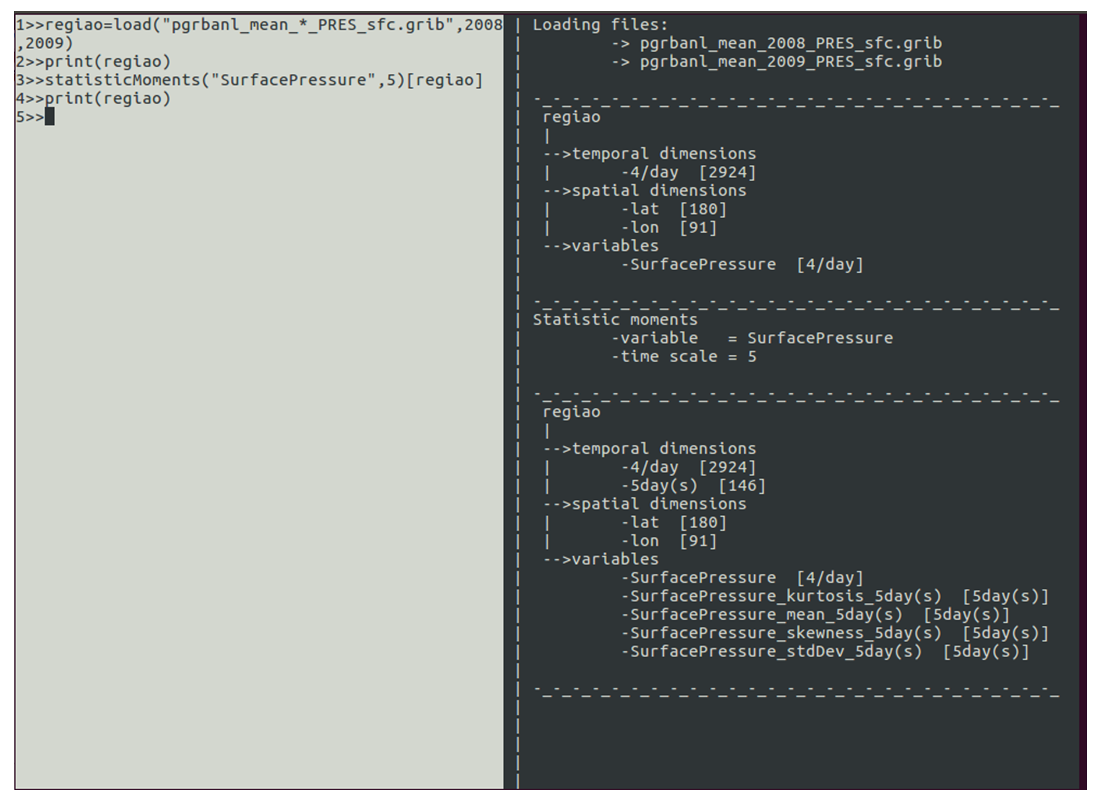
- In order to test the new developed plugin, we applied the statistic moment function on the 20th century reanalysis version 2 data set [13]. This data set is an effort between universities and atmospheric research organizations to elaborate a data set spanning half of the twentieth and the 21st century until today (1851 - present) assimilating synoptic pressure [14]. This data set contemplates many climate variables, some of them are available as a uniform grid with 2 of spatial separation in latitude and longitude, and time sampled each six hours and as gaussian T62 grids with sampling period of three hours. In both cases, the data is provided in the grib file format.The platform was run on CentOS Linux based operating system with 24 cores. The usage of the function can be seen in Figure 1. At first, the load built-in function reads a file spanning the years 2008-2009 and puts all the information into the newly created variable region. If its content is printed, one observes that it carries the variable surface pressure sampled four times a day. It also has a 180x91 latitude vs. longitude grid. Then, the function statistic moments is applied to the variable surface pressure and four new variables were created. It is also noticeable that these new variables follow a new time scale, sampled each 5 days.
 | Figure 1. Usage of the new function |
5. Results
- The result of the applied new function was compared with some actual data from the weather station of Vitória-ES (Brazil). This region was chosen due to some research projects on pollution dispersion the authors are involved in. The data from this weather station is sampled once a day, therefore the calculation of the statistic moments was carried out on this time scale and a point was chosen in the neighbourhood (20°S 40°W) and both were compared. The results are shown in Figure 2, where a considerable agreement may be observed. This result is nothing extraordinary, since this data set uses the surface pressure as the only assimilated parameter, so that it is natural to believe that for this variable the data set is very precise. Nevertheless, these results imply that the reanalysis data set is a useful data set for the parameter surface pressure, that the built-in load function works properly and that the mean was well calculated with the function statistic Moments.
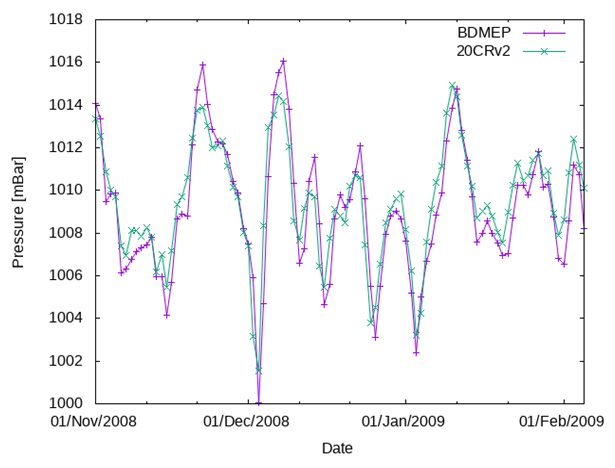 | Figure 2. Comparison between the Vitória-ES weather station data and the calculated mean from the reanalysis data |
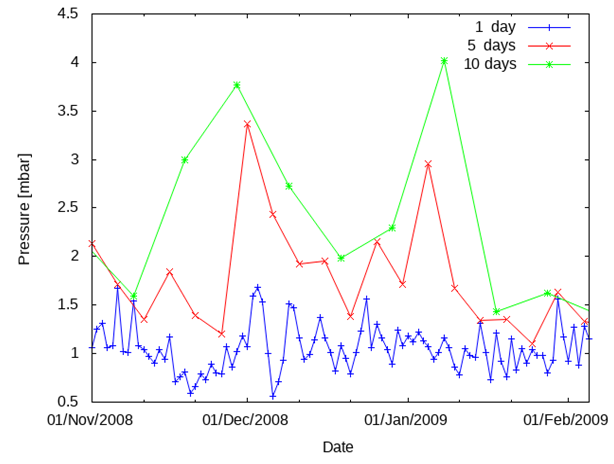
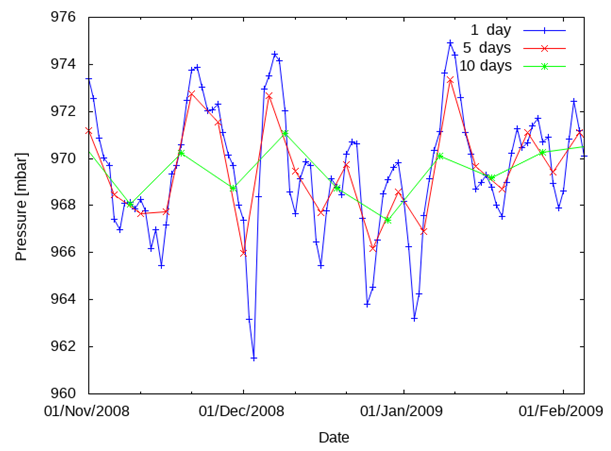 | Figure 3. Behaviour of the surface pressure mean for varying time scales |
 | Figure 4. Behaviour of the surface pressure standard deviation for varying time scales |
6. Scalability
- In order to evaluate the scalability of the platform, the statisticMoments was run with one, 5, 10, 15 and 20 threads and the results are provided in Figure 5.
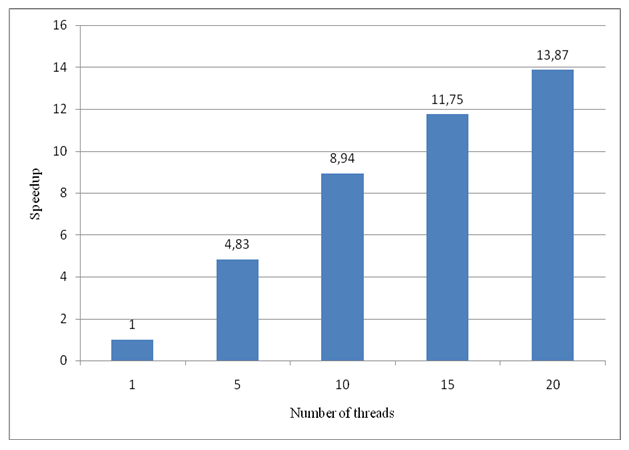 | Figure 5. Scalability of the function statisticMoments under the developed platform |
7. Conclusions
- The present work reported on the status of the development of a new platform for controlling parallelized simulations of environmental scenarios as well as manipulating meteorological observational data. The authors of this work are aware of the fact that there are still many improvements to be implemented before releasing this software, but a first building block to develop a potentially powerful tool was concluded. A simple test plugin was created to validate and evaluate the platform. The plugin works fairly well and can be easily reused with different file formats due to the ability of the platform to abstract from the developer the loading of new data with its specific data formats. The scalability of the plugin is not a benchmark yet, but acceptable. There may be many reasons for the actual scaling behaviour, either due to problems of the communication of the framework with the data server of the used cluster but also the need to still improve parts of the plugin/platform design. For future works many opportunities emerge, namely, the platform’s standard library shall be extended with tools, other parallelization paradigms shall be supported, among many other features that are to be included over the next years.
Appendix
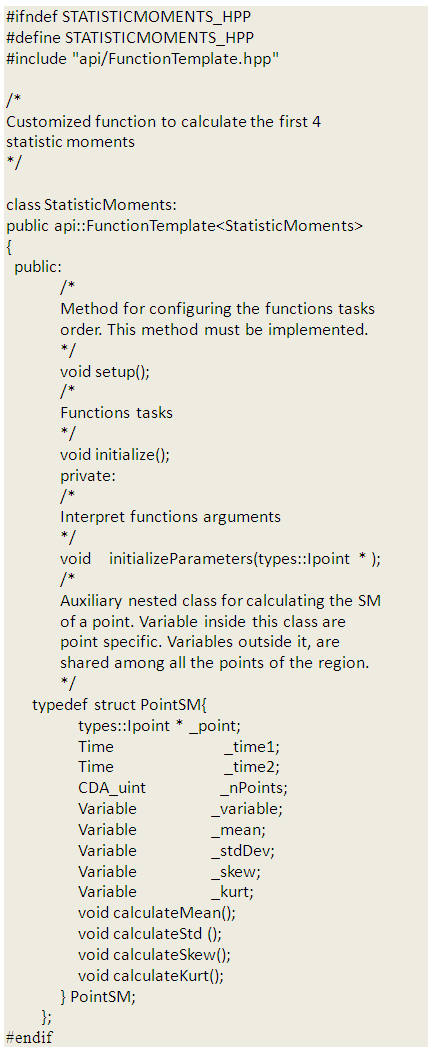
- When writing a plugin, a developer should include the api/FunctionTemplate.hpp. This file provides some functions and classes to interact with the platform. For making a customized function, the developer should create a class that is inherited from the template FunctionTemplate <Type>, which defines some important methods called by the platform and some steps of the function registration. The simplified fragment of code below illustrates it for the statistic moments case.
 The only method that the programmer needs to implement is the one inherited from the function´s interface, setup(), that is gonna be called by the platform before executing the function. In this method one should register the function´s tasks that are gonna be called.To add a serial task, the template method addSerialTask <Task>([](*)) inherited from FunctionTemplate should be called. Similarly, to add a parallel task, the method addSerialTask<Task> ([](Ipoint * point)). The tasks are the lambda functions passed as arguments to the templated method. One should notice that the lambda function of parallel tasks receives a point interface as argument. This point is the one passed by the task manager when it parallelizes a given task and consequently it´s possible to access its data. The variadic template method checkParametersTypes<typename... Args allows us to check the types of arguments passed by the user and call different methods depending of its order. For instance, when called with 2 string as arguments, operator + must concatenate them, on the other hand, when called with numbers it should sum them (the same function, but different tasks instances are called). To print some output to the screen, the print templated method should be called.For the statistic moments function, the simplified setup() method is shown:
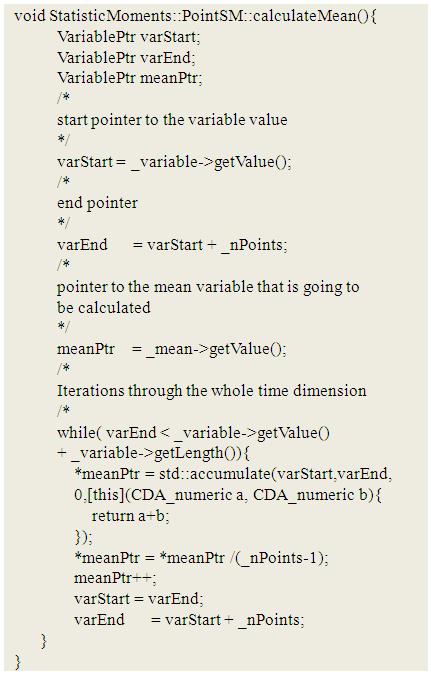
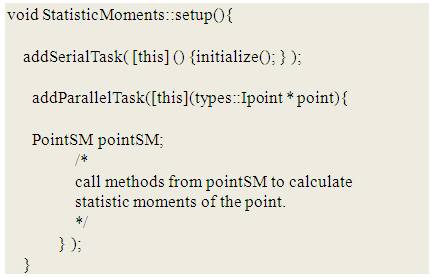 As it can be seen 2 tasks are registered. First a serial one to set the arguments common to all points and then a parallel one to calculate the moments. The function uses an auxiliary nested class to make sure that the point´s own properties are not shared. This can demand more memory, but should run faster than when sharing them. The parallel task only start it´s execution when the serial one is finished.Finally, the code below shows the PointSM calculateMean() method. The calculation of the other statistic moments is similar and are not going to be shown.