Luis Felipe Andrade1, Arcilan T. Assireu2, Cláudio C. Pellegrini1
1Depto. Ciências Térmicas e dos Fluidos, UFSJ, São João del Rei, Brazil
2Instituto de Recursos Naturais, UNIFEI, Itajubá, Brazil
Correspondence to: Cláudio C. Pellegrini, Depto. Ciências Térmicas e dos Fluidos, UFSJ, São João del Rei, Brazil.
| Email: |  |
Copyright © 2018 The Author(s). Published by Scientific & Academic Publishing.
This work is licensed under the Creative Commons Attribution International License (CC BY).
http://creativecommons.org/licenses/by/4.0/

Abstract
This work presents a numerical study of the wind in hydropower plants reservoir under non neutral stability atmospheric conditions, through high resolution WRF runs. The Richardson number was used to evaluate the dynamic stability. The simulations were run for Furnas reservoir, where anemometric data were available at 20 and 40 m above the surface of the water, during a one week period. The results were considered encouraging.
Keywords:
Wind potential, Hydropower plants reservoir, WRF mesoscale model
Cite this paper: Luis Felipe Andrade, Arcilan T. Assireu, Cláudio C. Pellegrini, A Numerical Study of the Wind over a Hydroelectric Reservoir: Effects of the Atmosphere Stratification, American Journal of Environmental Engineering, Vol. 8 No. 4, 2018, pp. 99-104. doi: 10.5923/j.ajee.20180804.03.
1. Introduction
The benefits of the insertion of wind power in the maintenance of the clean and renewable character of the Brazilian electrical matrix are indisputable. The main advantage is the possibility to avoid crises such as the 2001 blackout but also important is the Brazilian winds’ recognized seasonal complementarity with hydroelectricity. Even though costs vary due to political and fiscal issues, wind power is the only form of power generation to present costs that are close to those of the fossil fuels generation [1].Presently in Brazil, wind energy conversion is mainly located in flat and coastal regions. Much is still to be exploited in places of complex terrain regarding this source of energy. Amongst these places, hydroelectric power stations reservoirs have shown promising results [2] as they introduce regions of wind convergence, favouring its intensification and directional persistence. Several factors, however, still need to be studied in this problem and the influence of atmospheric stratification is one of them. The effects of dynamic stability were recently studied by microscale simulation in the region of the Furnas reservoir [3]. In this work, one year (12/2013 to 11/2014) of monthly runs were carried out and, later on, sorted by season. The influence, studied through the Richardson number was, therefore, of seasonal character.The present study is, therefore, an extension of the previous result. Here the Richardson number is also used to quantify the dynamic stability of the atmosphere, but the study is focused on a week, during which the data are separated in day and night hours. The final objective of this contribution, and of the larger project where it is inserted, is to try to understand better the extraction of wind power in lakes of large hydro power plants under the most diverse conditions.
2. Methodology
The Guapé reservoir, located in the Furnas hydroelectric power complex, Minas Gerais state, Brazil, was chosen for this study. In order to validate the simulations, they were compared to data observed in a field experiment, obtained from an anemometric tower located at 20°44'26.07"S and 45° 57'27.03"W, near one of the reservoir margins. Data were collected at 20 and 40 m above the water between days 0706/2009 and 14/06/2009.All simulations were performed using WRF atmospheric model V3.5. The model was run for the seven days of the experiment period, divided into seven individual runs of 36 hours, to reduce the propagation of errors. The first six hours of each run were considered model adjustment time (spin off) and discarded. This period is larger than it is necessary for sound waves to cross the largest of the domain used, adjusting the wind to the topographic variations, as suggested by [4]. As there were no indication of deep convection actuating during the simulated period, six hours were considered sufficient for the study. Individual runs were started at 00:00 UTC of one day and finished at 12:00 UTC of the next day. The day and night periods were defined as the intervals between 07:00 and 18:00 (local time) of one day and 18:00 and 06:00 (local time) of the following day respectively, according to the approximate time of sunrise and sunset at the time of the year and location of the study.The domain configuration chosen was composed of three nested and centralized domains, to detail the region under study (Figures 1 and 2). The centre of the grids was positioned over the anemometric tower to minimize interpolation errors when comparing simulated data to observations.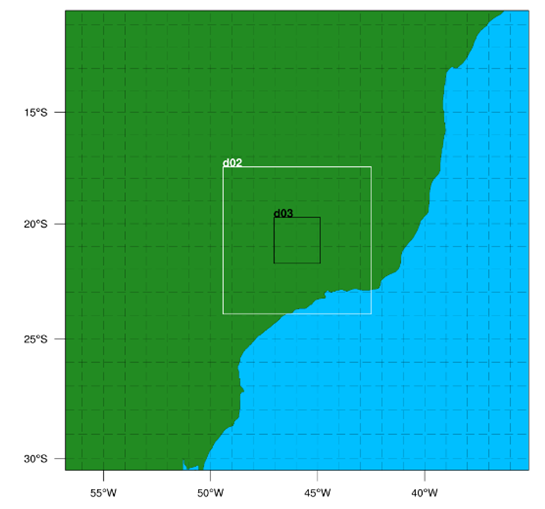 | Figure 1. Nested domains |
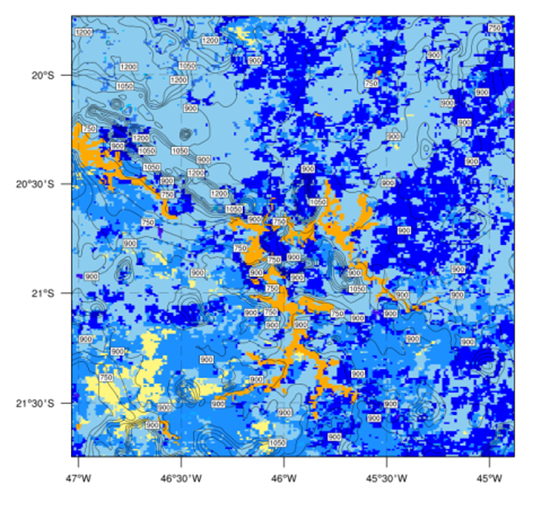 | Figure 2. Position of Guape reservoir (in orange) in the smallest domain |
The resolution of the smaller grid, Δx = 0.9 km, was chosen to match the maximum resolution of the static geographic data available (USGS, with 30 sec. resolution). In order to progressively increase the resolution of the smaller grid to the initialization data, a 5:1 ratio was used between the resolutions of the domains. This led to the following configuration: a 101x101 points largest domain with 22,5 km grid resolution, a middle domain with 161x161 points and 4,5 km resolution and a smallest domain with 251x251 point and 0,9 km resolution. A time step (Δt) of 120 seconds was used for the largest domain, according to the WRF manual that recommends Δt = 6Δx, with Δx in km and Δt in seconds. All simulations were initialized with FNL data from the NCEP Global GFS Model, with a resolution of 1° (approx. 108 km) and 6 hours. These data were also used as boundary conditions during the integration, as usual.A vertical resolution of 47 levels was used, with concentration close to the surface. Two levels were specifically positioned at 10 m and 120 m AGH so that the bulk Richardson number could be calculated on this layer with no further interpolations. The bulk Richardson number was calculated according to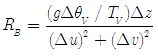 | (1) |
where g is the acceleration due to gravity, TV is the virtual temperature, θV is the potential virtual temperature, u and v are the horizontal velocity components and the symbol Δ indicates 120-10 m differences. In spite of the fact that the flux Richardson number, Rf, is traditionally used as parameter to evaluate the local stability on the planetary boundary layer, RB was used here for simplicity. In statically stable conditions, negative buoyancy tends to suppress turbulence, whereas negative shear tends to feed it, and therefore Rf > 0. In a statically unstable atmosphere, the buoyancy is reversed but the shear does not, thus Rf < 0. Of course, Rf = 0 implies a neutral atmosphere. For the dynamic situation, this limit usually goes to Rf = 1. In micrometeorology, there is seldom enough information for the calculation of Rf, and thus equation (1) is used. In this case, the dynamically neutral limit can be set at 0.25 if the layer considered is thin enough, which is the case here, between 10 and 120 m AGH. The physical parameterizations used were the same in all domains, except on the smaller one, where cumulus parameterization was not used. The schemes adopted were not entirely WRF’s default but have been shown to work well in high resolution runs in previous studies, [5-8]. The following schemes were used: Lin scheme for cloud microphysics, RRTM for long wave radiation, Dudhia for short wave radiation, Eta Similarity for the surface layer, Mellor-Yamada-Janjic for the planetary boundary layer, NOAH-LSM for the exchanges processes with the surface and Betts-Miller-Janjic for cumulus clouds. Their use and applicability is well documented in the WRF manual.
3. Results and Discussion
Figure 3 shows the time series of observed and simulated wind velocity at 20 m AGH, with the initial spin up period excluded. The description of the data by the model is qualitatively good, with localized quantitative differences. In the daily average the predicted and observed values agree well, so that predictions of the average daily wind speed and potential (Figures 4 to 7) can be considered reliable. A time series for 40 m was generated, but it is not presented here, due to its similarity.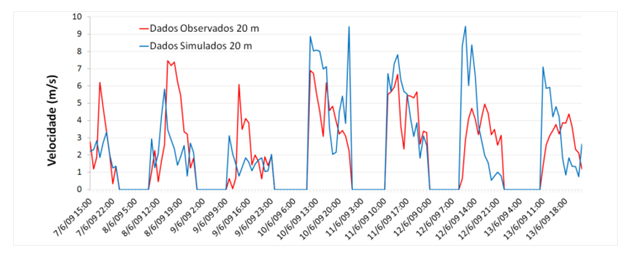 | Figure 3. Wind magnitude time series, 20 m AGH. Observed data in red; simulation in blue |
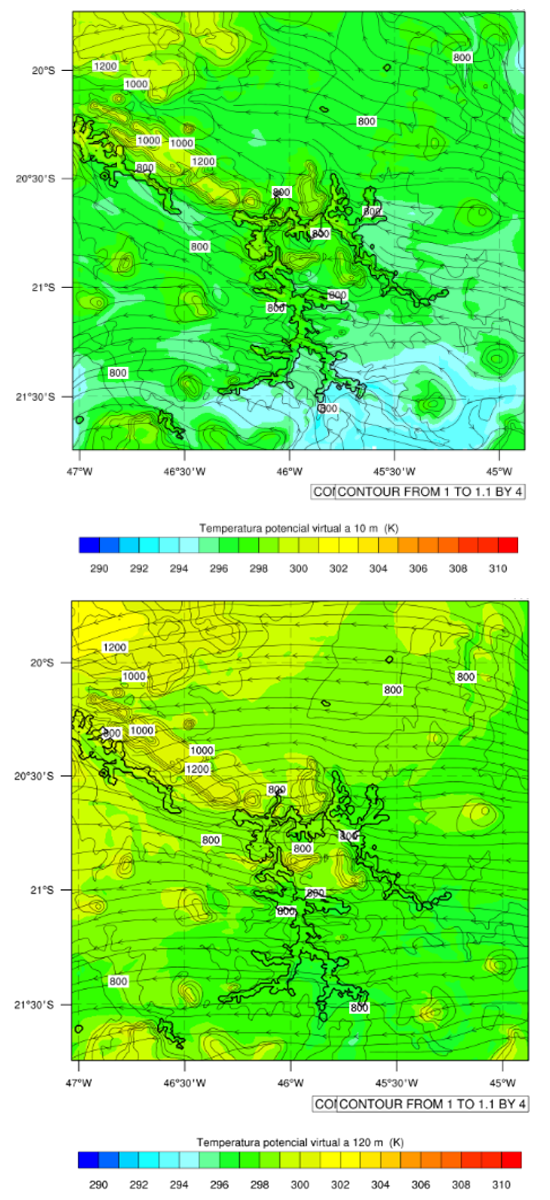
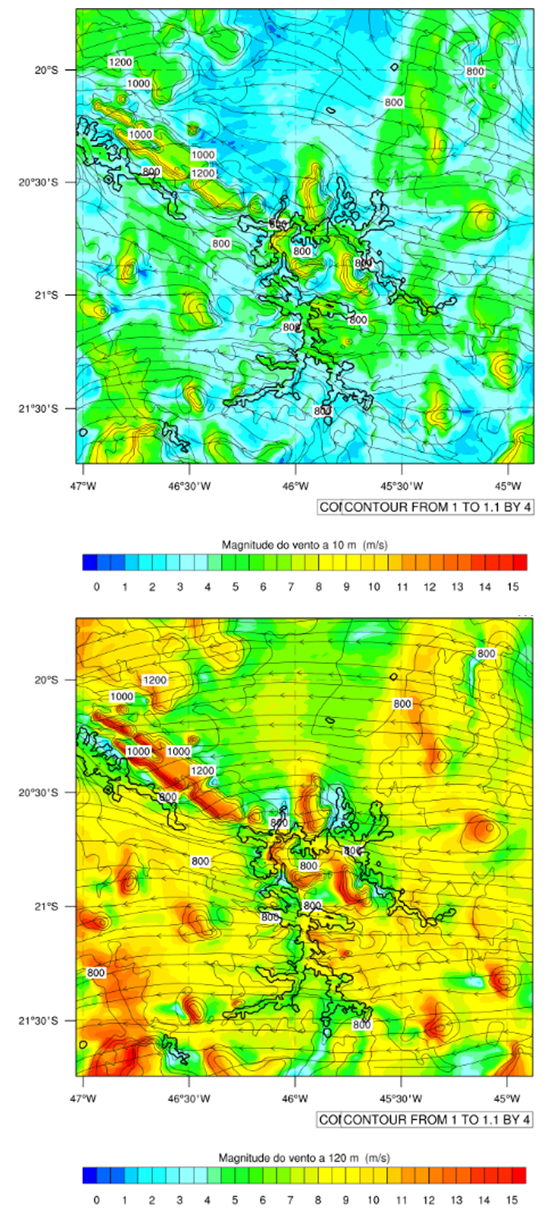
The expected behaviour of a large reservoir over the lower part of the atmosphere is to reverse the atmospheric stability over land. Due to the high specific heat of the water, the reservoir tends to be cooler than its surroundings under unstable conditions (usually during the day) and warmer under stable conditions (usually at night). The vegetation around the reservoir acts in the same way due to its water content. In addition, the reservoir tends to cool the air and increase its humidity under unstable conditions and to warm the air and increase its humidify under stable conditions, changing TV and ΔθV and affecting RB in a way difficult to predict. Due to its low roughness, the reservoir generally causes wind acceleration, thus increasing the vertical velocity gradient and consequently reducing RB. The topography may have the same effect, depending on its details. Hills, for example, tend to speed the wind up on its tops. The abovementioned influences have been found on most simulated results, as exemplified in the figures that follow. All results are discussed but, for reasons of space, not all figures are shown.In the day hours of the day 07/06/2009 simulated results, the expected behaviour of the reservoir was verified with isolated points of high stability in the north-western reservoir arm (Figure 4) due to the deceleration downstream of the mountain ridge to the northwest. The traditional acceleration effect of the reservoir was hardly observed (Figure 6). On the other hand, a virtual potential temperature drop occurred at both 10 and 120 m (Figure 5). During the night (not shown), the expected behaviour also occurred, with very low speeds in the domain, except for the sloping terrain of the northwest crest, which exhibits high RB values due to deceleration of the flow at the crest. The reservoir presents virtual potential temperature slightly larger than the surroundings, particularly visible at 10 m.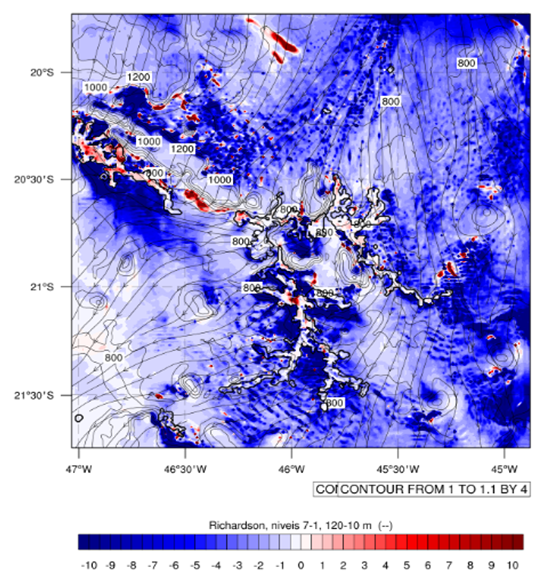 | Figure 4. Bulk Richardson number. Time-average of daytime 07/06/09 |
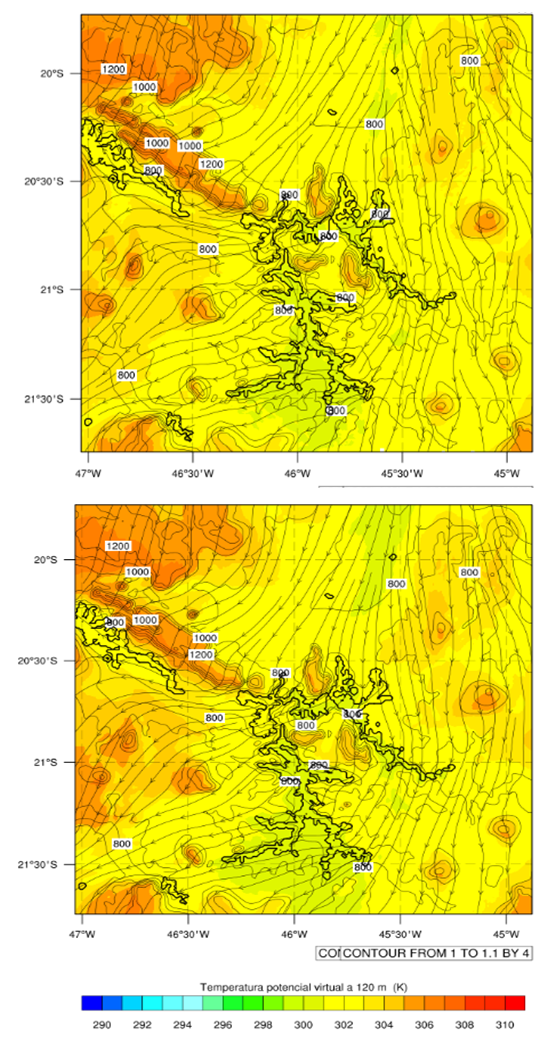 | Figure 5. Potential virtual temperature at 10 m (up) and 120 m (down). Time-average of daytime 07/06/09 |
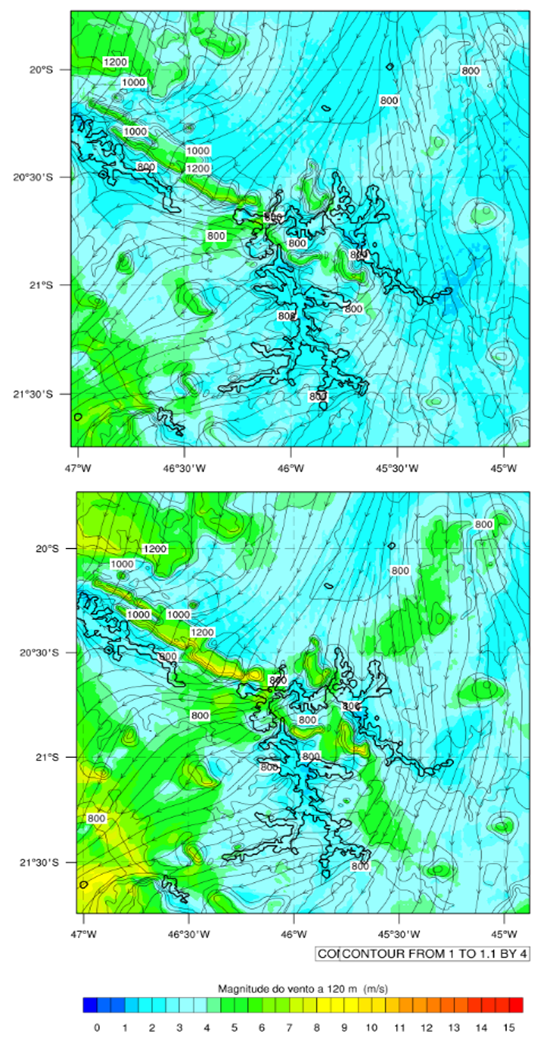 | Figure 6. Wind magnitude at 10 m (up) and 120 m (down). Time-average of daytime 07/06/09 |
In the day hours of day 08/06/2009 (not shown) almost no wind acceleration is seen over the reservoir, but the velocity slow down observed upstream and downstream of the northwest crest generates high RB values. The temperature drop shows more on the eastern arm at 120 m. At night, the behaviour observed during the day in relation to RB and potential virtual temperature reverses, as expected. The RB anomaly in the northwest arm remains, due to the associated low speeds.In the day hours of 10/06/2009 (not shown), there is little spatial variation of RB values during the day across the domain, except in the southern region, due to locally low wind speeds. During the night, again the low speed region lies in the domain south areas but, compensated by a temperature drop, does not create significant differences in RB values.In the day hours of day 11/06/2009 (not shown), the behaviour of RB does not seem clearly associated with the presence of the reservoir, since the speed and the temperature do not seem either. It is a period of relatively intense winds (5 to 6 m / s at 10 m). In the nocturnal period, Figures 7-9, the destabilizing presence of the reservoir was more distinct, due to the occurrence of a colder night. The velocity variations seem more associated with the surrounding topography than with the reservoir. Only one of the reservoir arms (second from south to north, located in the south-western part) is aligned to the predominantly easterly wind, showing a localized increase in velocity, an effect previously verified by [6] in a similar study.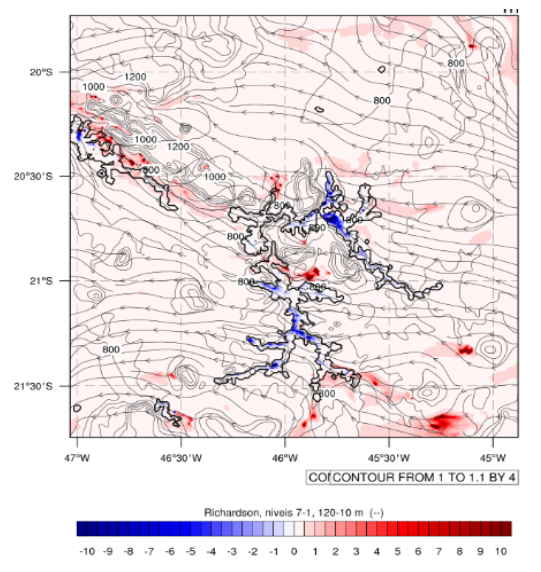 | Figure 7. Bulk Richardson number. Time-average of nighttime 11/06/09 |
 | Figure 8. Potential virtual temperature at 10 m (up) and 120 m (down). Time-average of nighttime 11/06/09 |
 | Figure 9. Wind magnitude at 10 m (up) and 120 m (down). Time-average of nighttime 11/06/09 |
In the day hours of day 12/06/2009 (not shown), RB was negative both over the land and the reservoir. The temperature was almost homogeneously high throughout the domain. The velocity presented a drop throughout the reservoir, except in the arms aligned to the prevailing easterly wind. During the night, the reservoir temperature was higher than the surroundings, leading to the expected behaviour of RB, in spite of the low velocities simulated.Finally, in the day hours period of 13/06 (not shown), there was little influence of the reservoir on the temperature, so that the differences observed in RB are more associated to variations in wind velocity. At night, the reservoir was warmer and the velocity did not change significantly. Thus, temperature was the main factor for the variation of RB, which exhibited the expected behaviour.
4. Conclusions
Numerical simulations were performed for the Guapé-Furnas reservoir region, using WRF atmospheric model V3.5. The time-mean horizontal distributions for velocity and potential virtual temperature were obtained at the heights of 10, 30, 50, 80 and 120 m AGH for daytime and night-time periods. The time-mean horizontal distribution of RB between 10 and 120 m were also obtained. Not all results were shown but may be obtained from the authors by request. The simulations showed the nocturnal destabilizing and diurnal stabilizing effects of the reservoir as expected. It was clear, however, that the interaction between atmospheric stratification and topography is rather complex. The steep topography near the north-western arm of the reservoir, for example, is responsible for variations in velocities that affect RB on almost every simulated day. The expected wind acceleration effect of the reservoir, however, was only verified in a few cases, probably due to the complex surrounding topography. The velocity only showed a considerable increase in the arms of the reservoir aligned to the prevailing wind.
ACKNOWLEDGEMENTS
The authors wish to acknowledge CNPq, CAPES e LGSA for their financial help.
References
| [1] | Pellegrini, C. C. , L. Neto, A. V. , Assis, J. V. B., Assireu, A. T. Um Estudo Numérico da Intensificação do Vento em Reservatórios de Centrais Hidroelétricas da Região Sudeste do Brasil. Ciência e Natura, v. 36, p. 121-, n. 2015. |
| [2] | Assireu, A., Pimenta, F., Souza, V. Assessment of wind power potential of hydroeletric reservoirs. Em: Energy resources: development, distribution and exploitation, pp. 1-28. 2011. |
| [3] | Campos, B. The Wind Energy Resource of a Large Tropical Aquatic System: High Resolution Numerical Assessment and the Atmospheric Stability Effects to Power Production. 2015. Monografia (Trabalho de Conclusão de Curso) – Curso de Graduação em Ciências Atmosfériacas, Universidade Federal de Itajubá, Itajubá, 2015. |
| [4] | Wang W., Dudhia J., Chen M., 2017 University Corporation For Atmospheric Research, Best Practices of WRF. Avail. in: <http://www2.mmm.ucar.edu/wrf/users/tutorial/201701/best_prac.pdf> Acesso em: Acessado em 28 ago 2017. |
| [5] | Assireu, A. T.; Pellegrini, C. C.; Pimenta, F. M. Intensificação do Vento Devido a Influências do Relevo: Evidências a Partir de Modelos Numéricos e Medidas In Situ. Ciência e Natura, v. Especial, p. 60-62, 2013. |
| [6] | Pellegrini, C. C.; L. Neto, A. V.; Assis, J. V. B.; Assireu, A. T. Um Estudo Numérico da Intensificação do Vento em Reservatórios de Centrais Hidroelétricas da Região Sudeste do Brasil. Ciência e Natura, v. 36, p. 121, 2015. |
| [7] | Araujo, C. C. S.; Pellegrini, C. C.; Assireu, A. T. Avaliação do WRF enquanto ferramenta decisória sobre potencial eólico. In: Congresso Nacional de Engenharia Mecânica e Industrial, 2017, Aracaju, SE. Anais do Congresso Nacional de Engenharia Mecânica e Industrial. Aracaju, SE, 2017. |
| [8] | Pellegrini, C. C.; Assireu, A. T. ; Andrade, L. F. . Um Estudo Numérico Do Vento Em Reservatórios De Centrais Hidroelétricas: Efeitos Da Estratificação Atmosférica. In: X Workshop Brasileiro de Micrometeorologia, 2017, Santa Maria? RS. Anais do X Workshop Brasileiro de Micrometeorologia. Santa Maria ? RS, 2017. |

 Abstract
 Reference
 Full-Text PDF
 Full-text HTML