-
Paper Information
- Paper Submission
-
Journal Information
- About This Journal
- Editorial Board
- Current Issue
- Archive
- Author Guidelines
- Contact Us
American Journal of Environmental Engineering
p-ISSN: 2166-4633 e-ISSN: 2166-465X
2018; 8(1): 1-3
doi:10.5923/j.ajee.20180801.01

Investigating the Levels of Ammonia and Nitrates in Dillon Lake and Their Effects on the Environment
 Abstract
 Reference
 Full-Text PDF
 Full-text HTML
Shadi Abu-Baker , Christopher Russell , Joshua Doudna
Ohio University Chemistry Department, Ohio University Zanesville, Zanesville, Ohio, USA
Correspondence to: Shadi Abu-Baker , Ohio University Chemistry Department, Ohio University Zanesville, Zanesville, Ohio, USA.
| Email: |  |
Copyright © 2018 Scientific & Academic Publishing. All Rights Reserved.
This work is licensed under the Creative Commons Attribution International License (CC BY).
http://creativecommons.org/licenses/by/4.0/

It’s a well-known fact that groundwater contamination is a problem in freshwater lakes. Ammonia and nitrates are two of these contaminants, which can cause the premature aging of the lakes and deoxygenation by causing algae to grow out of control. Our goal in this experiment is to determine the levels of ammonia and nitrates in Dillon Lake and their effects on the environment. With this information, we hope to find a way to reverse some of the damage to the lake's ecosystem and raise awareness about this issue. We also hope to connect it to the larger problems in this area. Based on our results, the nitrate and ammonium levels are mostly within the acceptable limits. However, in some areas the nitrate values are high enough to cause spots of excessive algal buildup around the Lake.
Keywords: Ecology, Water Quality, Algal Blooms, South-eastern Ohio
Cite this paper: Shadi Abu-Baker , Christopher Russell , Joshua Doudna , Investigating the Levels of Ammonia and Nitrates in Dillon Lake and Their Effects on the Environment, American Journal of Environmental Engineering, Vol. 8 No. 1, 2018, pp. 1-3. doi: 10.5923/j.ajee.20180801.01.
Article Outline
1. Introduction
- Water quality in Ohio has been a growing concern in recent years. From algal blooms to groundwater contamination, the health of Ohio's water has an impact on everyone. Inorganic compounds such as nitrate (NO3-), ammonium (NH4+), and phosphorous (PO43-) in the water cause a wide range of adverse side-effects. These contaminants are most commonly found in fertilizers and agricultural wastes, though they can come from urban pollution, namely sewage and industrial wastes [1]. The problem with having these pollutants are the damage they can cause, both to the environment and personal health. The acceptable limit of nitrate in the water is 10 mg/L, however damage starts to occur even before that, starting at 3.5 to 5 mg/L [2-5]. The algae, uses it along with ammonium as a fertilizer. At those levels, the algae has an abundance, and begins to overgrow, causing the lake to be overrun by algal blooms. Typically these blooms are made of green or blue-green algae, although sometimes very toxic red algae can be present. Not only do these blooms deoxygenate the lake (known as eutrophication), but they also can produce toxins that are harmful to both the wildlife and humans [3, 4]. The harmful side effects of nitrate in aquatic life can range from odd reproductive behavior to death, where as in people it can cause digestive issues or blue baby syndrome (also known as methemoglobinemia), resulting from the blood's decreased ability to carry oxygen. Therefore, it is imperative that inflow of these contaminants to be diminished. The aim of this research is to both raise public awareness about the potential dangers of rising nitrate and ammonia levels and to search for a potential solution.Our research is designed to connect to pre-existing research, in the hopes of drawing attention to a larger problem. One such piece of research is a paper written by a few of our colleagues about nutrient pollution in the Muskingum River. Their results indicated the presence of excess nutrients, but within the legal limits [3].
2. Experimental Procedure
- First, we began with scouting out a location suitable for testing that is safe and accessible. Then, five locations were selected around the lake sides to cover most of lake surroundings. We made the trip around the lake and collected samples from at least 3 foot depth. We stopped to collect samples at Dillon Dam (A, South side), Big Run Boat Ramp (B, South-east side), Dillon Park Beach (C, East side), North Road 7 (D, North side) and finally Pinecrect Road (E, West side). Samples places are shown in Figure 1 and 2 maps. Sufficient planning was involved to ensure the samples were able to be obtained in succession and in triplicates. Plastic bottles were washed and dried as many plastic bottles as was needed to correspond to the number of sites tested, multiplied by three tests. Three tests are used to ensure consistent and reliable data. In our case, we tested five locations and took three samples at each. No soap residue was left inside the plastic bottles, as it may skew results. Next came actually collecting the samples. Again, enough time should be allotted so that all of the samples can be obtained in one outing so that minimal outside factors can interfere with the nutrient levels in the time of collecting, and conditions remain consistent. We filled up three bottles at each testing location with at least two and a half inches of water.This ensures that the testing electrode head will be fully submerged. Once all of the samples were acquired, we began testing. There are several different systems available for testing water quality and nutrient levels like nitrate, ammonia, and phosphorus such as the Pasco colorimeter and the Vernier Nitrate and Ammonium Ion-Selective Electrodes (separate electrodes for both Nitrate and Ammonium) with the LabQuest 2 data-collection device. This procedure was designed for use with the latter system, due to it being slightly easier to use and more readily available. The electrodes were calibrated to manufacturer specifications. Once calibrated, we rinsed the electrode thoroughly with distilled water and tested each sample for three minutes. This is done because the probe needs time toacclimate to and read the water. Results were recorded in milligrams per liter and written on a spreadsheet. In between tests, we always rinsed the electrode head with distilled water and gently patted dry to avoid cross-contamination. This procedure was repeated until all samples were been tested and both nutrients had been tested for. The results of each test on a site were averaged and compared to the acceptable limits.
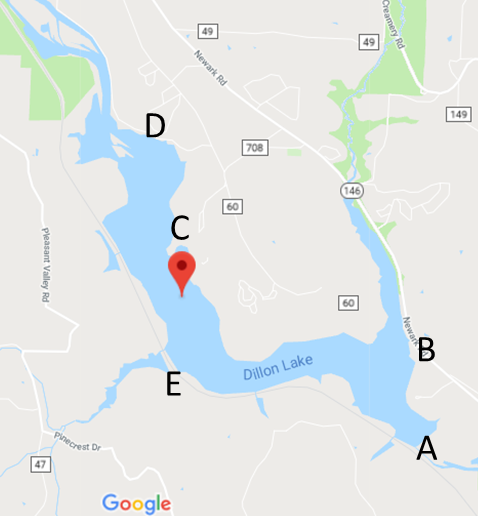 | Figure 1. Map showing the five testing locations. (Map courtesy of Google Maps, inset images by Audrey Lafferty.). Samples’ locations are (A, B, C, D and E) [6] |
3. Result
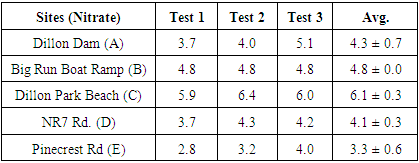
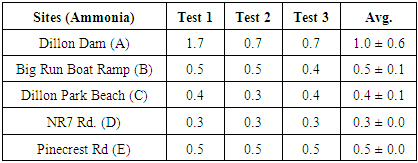
- According to the Environmental Protection Agency (EPA) and the National Academy of Science (NSF), the Maximum Nitrate Contaminant Level (MCL) is 10 milligrams per Liter (mg/L) and the Maximum Ammonia Contaminant Level for Drinking Water (MCLDW) is 0.5 mg/L [2-4]. Table 1 and 2 shows the measured Nitrate and Ammonia level at 5 different spots. Most of the results we calculated were within the range of the EPA acceptable limits. We have noticed that at least one location (Dillon Dam), the Ammonia level was above the Drinking Water acceptable limit. Although our results are within range, the level of Ammonia and Nitrate is above the typical values we noticed when we did out study on Muskingum River last year and the typical values for Ohio River [4]. This indicates that most of the Dillon Park lake areas we tested has not been exposed to high concentration of nitrate and ammonia at the time and season we tested.
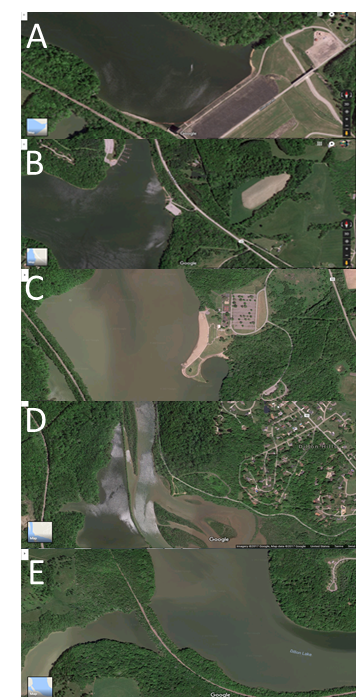 | Figure 2. Satellite Maps showing the five testing locations. (Map courtesy of Google satellite Maps). Samples’ locations are (A, B, C, D and E) [6] |
|
|
4. Conclusions
- Based on our results, we've determined that both the nitrate and ammonium levels are mostly with in the acceptable limits. However, the values are enough to cause spots of excessive algal buildup and affect the health of the lakes and surrounding wildlife, but not over the acceptable limits to where it is toxic to humans. We would like to urge use of fertilizers with lower levels of these chemicals or the use of filtration systems to diminish the inflow of these pollutants.
5. Future Directions
- In the future, we plan to collect and test another round of samples at the same sites during the third week of September. That will mark six months since we took the first samples, and nutrients should be at their peak levels. We plan to do microbial analysis of the lake water, in addition to thin layer chromatography in order to determine the species of algae growing in Dillon Lake, as well as whether or not it's a threat to humans and/or wildlife.
ACKNOWLEDGEMENTS
- We would like to thank Ohio University Zanesville and the Ohio University Zanesville Chemistry Department for their support, guidance and funding throughout this project.