-
Paper Information
- Paper Submission
-
Journal Information
- About This Journal
- Editorial Board
- Current Issue
- Archive
- Author Guidelines
- Contact Us
American Journal of Environmental Engineering
p-ISSN: 2166-4633 e-ISSN: 2166-465X
2017; 7(4): 93-105
doi:10.5923/j.ajee.20170704.03

Detection of Drought Cycles Pattern in Two Countries (Sudan and South Sudan) by Using Standardized Precipitation Index SPI
 Abstract
 Reference
 Full-Text PDF
 Full-text HTML
Yousif Elnour Yagoub1, 2, 3, Zhongqin Li1, Omer Said Musa2, Muhammad Naveed Anjum4, Feiteng Wang1, Zhang Bo3
1State Key Laboratory of Cryospheric Sciences, Tian Shan Glaciological Station, Northwest Institute of Eco-Environment and Resources, Lanzhou, China
2University of Khartoum, Faculty of Forestry, Department of Forest Protection and Conservation, Shambat, Sudan
3Northwest Normal University, College of Geography and Environmental Science, Lanzhou, China
4Division of Hydrology Water-Land Resources, Northwest Institute of Eco-Environment and Resources, Lanzhou, China
Correspondence to: Yousif Elnour Yagoub, State Key Laboratory of Cryospheric Sciences, Tian Shan Glaciological Station, Northwest Institute of Eco-Environment and Resources, Lanzhou, China.
| Email: |  |
Copyright © 2017 Scientific & Academic Publishing. All Rights Reserved.
This work is licensed under the Creative Commons Attribution International License (CC BY).
http://creativecommons.org/licenses/by/4.0/

The aim of this research was to investigate the drought cycles in two countries (Sudan and South Sudan) by using characteristics of Standardized Precipitation Index (SPI) during 1961-2013 to provide valuable information for better adaptation and mitigation of consequences of drought to create a strategically good planning. This study compared the effectiveness of SPI on a long-term scale of (1, 3, 12, 24, 36 and 48 months lead time) drought conditions. The SPI 12-month showed high frequency of droughts in 1966 - 1968, 1974, 1984 - 1985, 1991 - 1992, 2000 - 2003, 2005 - 2006 and 2010. A high frequency of an annual-SPI mild drought was found in: Portsudan, Dongala, Shendi, Khartoum, Alfashir, Geneina, Malakal, Juba and Wau; moderate drought in: Portsudan, Halfawadi, Karrima, Abuhamed, Atbara, Gadarif and Edduim; severe drought in: Aroma, Kassala, Wadmedani, Edduim, Elobeid, Zalingei and Geneina; and extreme drought in: Gadarif, Singa, Abunama, Edduim, Elobeid, Alfashir and Zalingei. Increasing trend of drought, which was associated with the decreasing tendency of precipitation, would reduce the natural vegetation and crop covers as well as livestock production. In fact, this research has revealed that ongoing droughts caused by a decrease in precipitation would eventually reduce the natural vegetation cover, croplands, and livestock production.
Keywords: Climate Change, SPI, Precipitation, Sudan, South Sudan
Cite this paper: Yousif Elnour Yagoub, Zhongqin Li, Omer Said Musa, Muhammad Naveed Anjum, Feiteng Wang, Zhang Bo, Detection of Drought Cycles Pattern in Two Countries (Sudan and South Sudan) by Using Standardized Precipitation Index SPI, American Journal of Environmental Engineering, Vol. 7 No. 4, 2017, pp. 93-105. doi: 10.5923/j.ajee.20170704.03.
Article Outline
1. Introduction
- Climate change is one of the biggest threats to nature and humans in the 21st century. It is well reported that increase in the use of fossil fuel will accelerate global warming and eventually will lead to the extinction of civilizations with the passage of time [1]. Generally, variations in regional ecosystems are the consequences of both climate change and local anthropogenic activities, but it is almost impossible to directly differentiate between these two factors [2]. Particularly in arid and semi-arid areas, increased anthropogenic activities can easily lead to the degradation of certain ecosystems, even causing serious ecological and economic losses [3]. Due to the ongoing global warming and intensified anthropogenic activities over the last century [4-5], the socioeconomic drivers have started to overwhelm the great forces of nature for some selected processes regionally or even on the global scale [6]. Several meteorological and socioeconomic implications of this situation have been discussed [7]. In semi-arid Sudan, water availability is the primary constraint upon human habitation and activity. Large areas of central Sudan have an inadequate supply of water to meet even the basic daily requirements of human and livestock [8]. [9] defined the drought by using two types of drought indicators: (a) environmental indicators, which measure the direct effect of the hydrological cycle, precipitation, temperature, evapotranspiration, river flow, etc., and (b) water resources indicators, which measure the severity in terms of the impact on water supply, e.g. water supply for domestic, agricultural, industrial, fisheries and recreational purposes. Although “drought indices can only reflect drought conditions based on hydro-meteorological variables and unable to quantify the economic losses” [10] indices for monitoring climate variability and drought impacts are useful tools for designing drought response plans, assessing the need for domestic and international aid decision to affected populations and declaring drought emergency [11]. The drought index is the basis for arid climate research, and also to measure the extent of the drought key [12]. [13] proposed a new drought index, considering a number of elements including precipitation, temperature, soil moisture, evapotranspiration. Standardized precipitation index (SPI) is the most widely used drought index. The calculation of SPI is simple and multiple time scales can be used anywhere. Meteorological drought results from the reduction of precipitation, while agricultural drought is related to a shortage of available water for plant growth. Hydrological drought refers to a deficiency of surface and subsurface water supply. Finally, socioeconomic drought is associated with insufficient supply to meet the demand of some economic good with the above three types of drought [14]. Meteorological drought occurs more frequently and commonly than other three kinds of droughts, meanwhile, it normally triggers other types of drought, including agricultural, hydrological and socioeconomic drought [15]. The Sahara Desert has described as encroaching southwards at an increasing rate. This desertification phenomenon is considered as mainly human-induced. Sudan is one of the driest but also the most variable countries in Africa in terms of precipitation. Extreme years (either good or bad) are more common than average years [16]. The devastating Sahelian desiccation over the last generation of the 20th century [17] has motivated many scientists to identify the changes in drought conditions in Sudan, perhaps due to the diversified vegetation and climatic features of the country. Several studies show that the Sudan is suffering from degradation of its land resources through overgrazing, range fires, deforestation, inappropriate agricultural practices and the highly variable precipitation and recurrent droughts [18].The objective of this research is to show the drought pattern in two countries (Sudan and South Sudan) during 1961-2013 by using characteristics of Standardized Precipitation Index (SPI). The usefulness of results is to provide valuable information for better adaptation and mitigation of consequences of drought to create a strategically good planning.
2. Material and Methods
2.1. Study Area
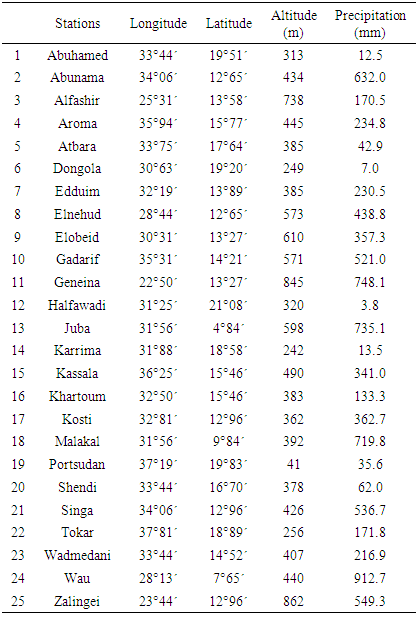
- Sudan and South Sudan are located in the northeastern part of Africa (Fig 1), combined cover area is 2501010 km2, extending from the latitude of 2° 40' - 22° 30' N and from longitude 21° 50 ' - 38° 50' E, altitude 40 - 870 m. Literature indicates that drought has become more frequent in recent decades. Early to mid-1970s, mid-1980s; early 1990s and early 2000s were reported as common drought years and were among the 10 driest years in the central region of Sudan [19]. Table 1 showed the geographical location, altitude and annual precipitation of meteorological stations in Sudan and South Sudan. Most of the observed precipitation occurs during the rainy season from March to October. Humidity level is very high in a rainy season. The Nile River traverses through the length of South Sudan and Sudan. The Nile River basin contributes most of Sudan’s available surface water, transporting over 93 billion cubic meters (bcm) of water per year on average, though only a one-fifth of this may be used in accordance with a 1959 water use treaty with Egypt [20].
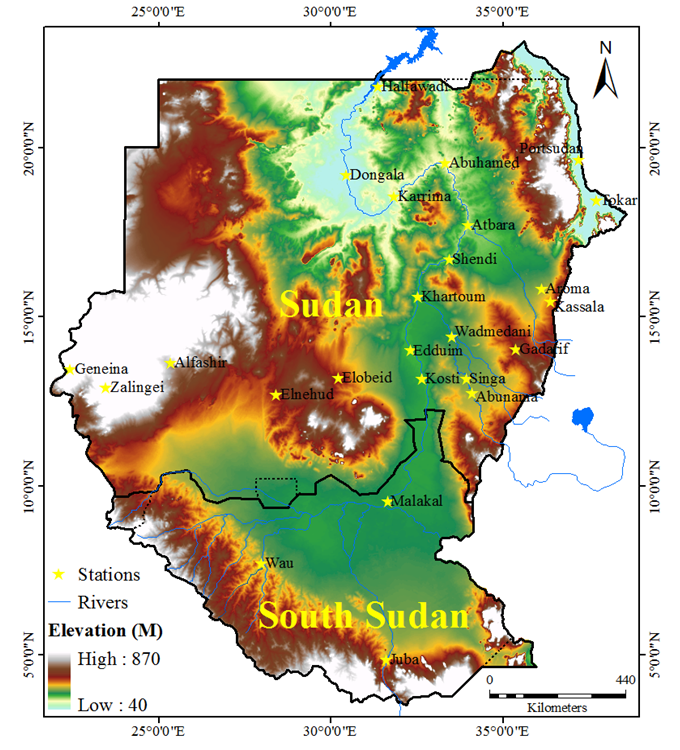 | Figure 1. The distribution of meteorological stations in Sudan and South Sudan |
|
2.2. Standard Precipitation Index (SPI)
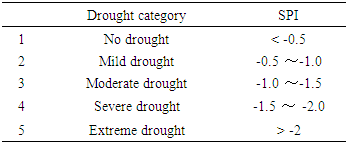
- The SPI was developed by [14], it is a meteorological drought index and is based solely on precipitation data. Two main advantages arise from the use of the SPI index. First, as the index is based only on precipitation data so its evaluation is relatively easy [21]. Second, the index makes it possible to describe drought on multiple time scales [22]. Details about the SPI index computation can be found in several papers including [23]. SPI index is a simple calculation based on the concept that precipitation deficits over varying periods or time scale influence groundwater, reservoir storage, soil moisture, snowpack, and streamflow. Computations for flexible multiple time scales provides early warning of drought and help to assess drought severity. Several datasets could be used for drought monitoring. However, there are few technical requirements, a data set should be suitable for an operational monitoring and forecasting chain employing the SPI index. Firstly, it should be long enough (at least 30 yr, as recommended by [14]. SPI index calculation can be calculated on 1, 3, 12, 24, 36 and 48 months equal time scales. Table 2 showed classification criteria of SPI index.
|
2.3. Mann-Kendall (K-K) Test
- Testing the significance of observed trends in hydrologic and climatic time series has received a great deal of attention recently. Mann-Kendall test, developed by [24] and [25] is used for trend analysis. The rank-based M-K test is the most widely used nonparametric test for trend detection. This test can be applied to a time series data without considering the probability distribution. Distribution-free tests have the advantage that their power and significance are not affected by the actual distribution of the data. This is in contrast to parametric trend tests, such as the regression coefficient test, which assume that the data follow the normal distribution, and so their power can be greatly reduced in the case of skewed data [26].
3. Result and Discussions
3.1. SPI
- As already described in the detail comparative studies of many scholars on a variety of meteorological drought indices, exploration of each index area is not a simple adaptation of the linear trend of each index. As reported by [27], the high drought in Sudan and South Sudan was observed in 1973, 1981, 1984, 1990, 1991, 2000, 2001, 2002, 2005, 2006, 2007 and 2008. Fig. 2 showed that the SPI 12-month had a high frequency of drought in 1966 - 1968, 1974, 1984 - 1985, 1991 - 1992, 2000 - 2003, 2005 - 2006 and 2010. SPI 24-month showed a high frequency of drought in 1966 - 1968, 1974, 1984 - 1986, 1992 and 2000 - 2008. SPI 36-month showed a high frequency of drought in 1967 - 1968, 1974, 1984 - 1987, 1992 and 2000 - 2007. SPI 48-month showed a high frequency of drought in 1967 - 1968, 1985 - 1986 and 2001 - 2007.
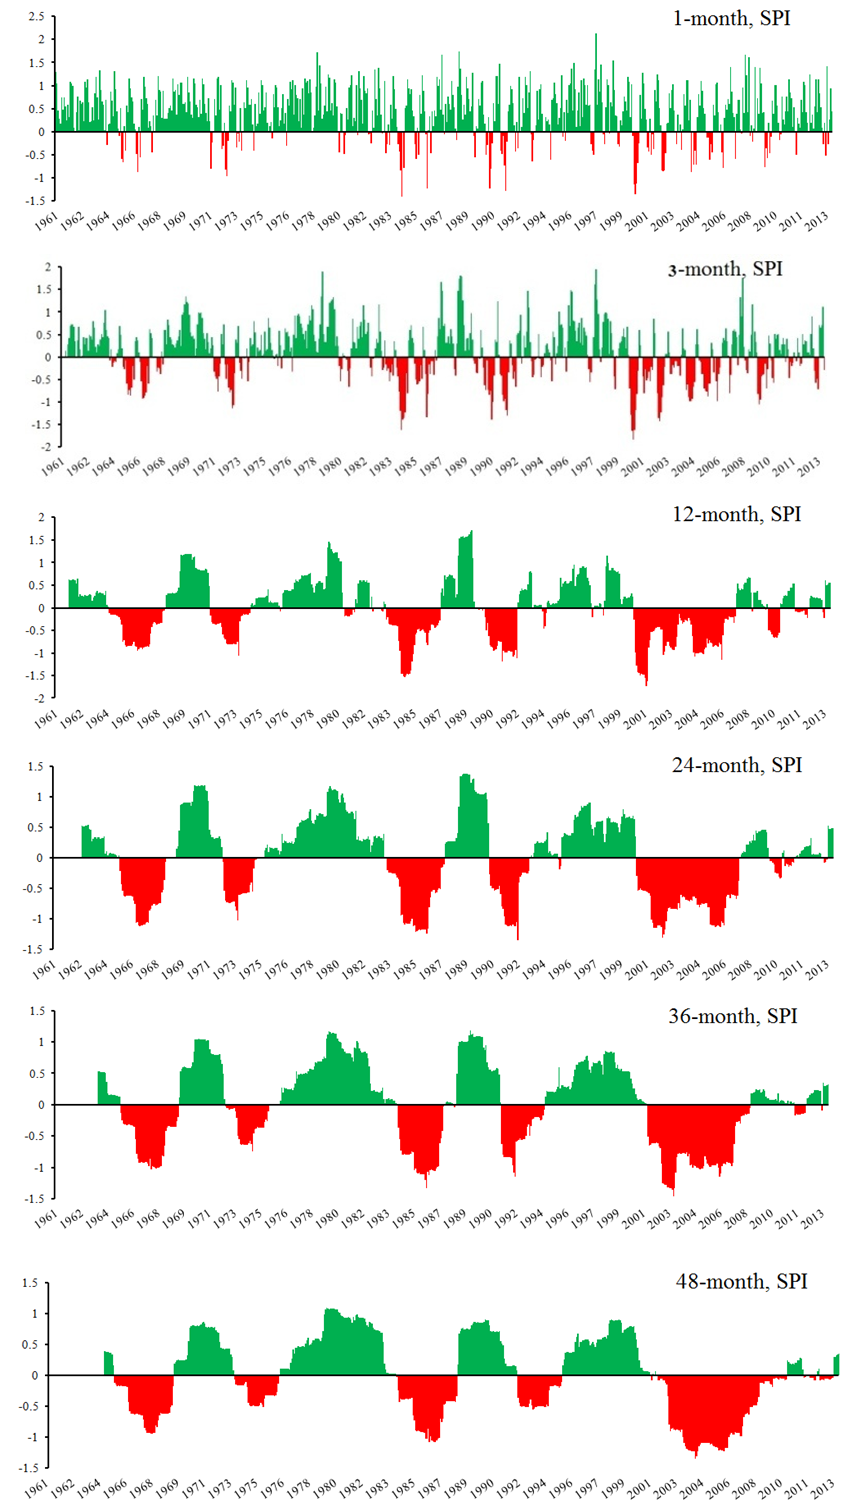 | Figure 2. SPI values in Sudan and South Sudan during 1961-2013 |
3.2. Mann-Kendall (M-K) Test
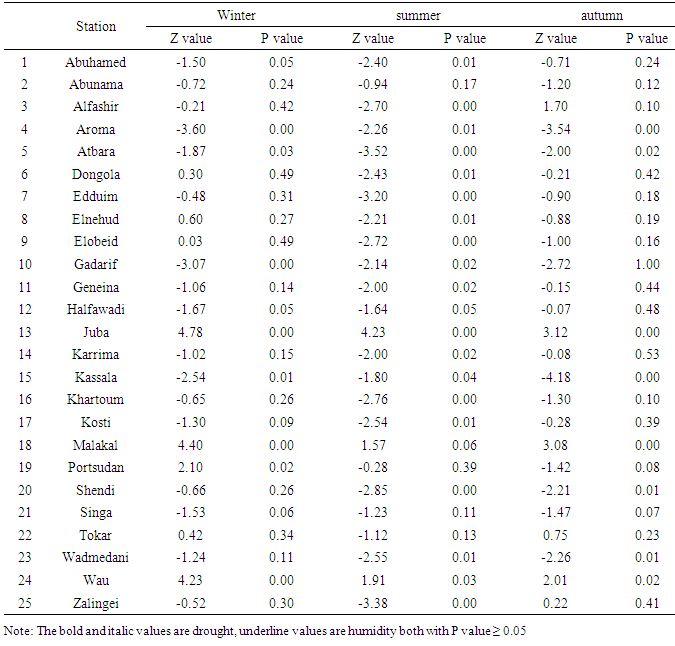
- Table 3 showed that the winter-SPI drought trend had a significant trend in Aroma (P = 0.00), Gadarif (P = 0.00), Kassala (P = 0.01) and in Abuhamed (P = 0.05). Summer-SPI drought trend was significant at P = 0.00 in Zalingei, Atbara, Edduim, Elobeid, Khartoum, Shendi, and Alfashir; at P = 0.01 in Abuhamed, Aroma, Dongola, Elnehud, Kosti, and Wadmedani; at P = 0.00 in Karrima, Gadarif and Geneina; at P = 0.04 in Kassala; and at P = 0.05 in Halfawadi. Autumn-SPI drought trend was significant at P = 0.00 in Kassala and Aroma; at P = 0.01 in Shendi and Wadmedani; and at P = 0.02 in Atbara. Winter-SPI humid trend was significant at the 0.05 confidence level in Juba, Wau, Malakal, and Portsudan. Summer-SPI humid trend was significant at the 0.05 confidence level in Juba and Wau. Autumn-SPI humid trend was significant at the 0.05 confidence level in Juba, Malakal, and Wau. Juba, Malakal, and Wau are locating in South of Sudan.
|
3.3. Spatial Variation of Drought Frequency
- Fig 3 showed the frequency distribution of four annual-SPI drought categories in Sudan and South Sudan during 1961-2013. The high frequency of an annual-SPI mild drought was found in Portsudan, Dongala, Shendi, Khartoum, Alfashir, Geneina, Malakal, Juba and Wau; moderate drought in Portsudan, Halfawadi, Karrima, Abuhamed, Atbara, Gadarif and Edduim; severe drought in Aroma, Kassala, Wadmedani, Edduim, Elobeid, Zalingei and Geneina; extreme drought in Gadarif, Singa, Abunama, Edduim, Elobeid, Alfashir and Zalingei.
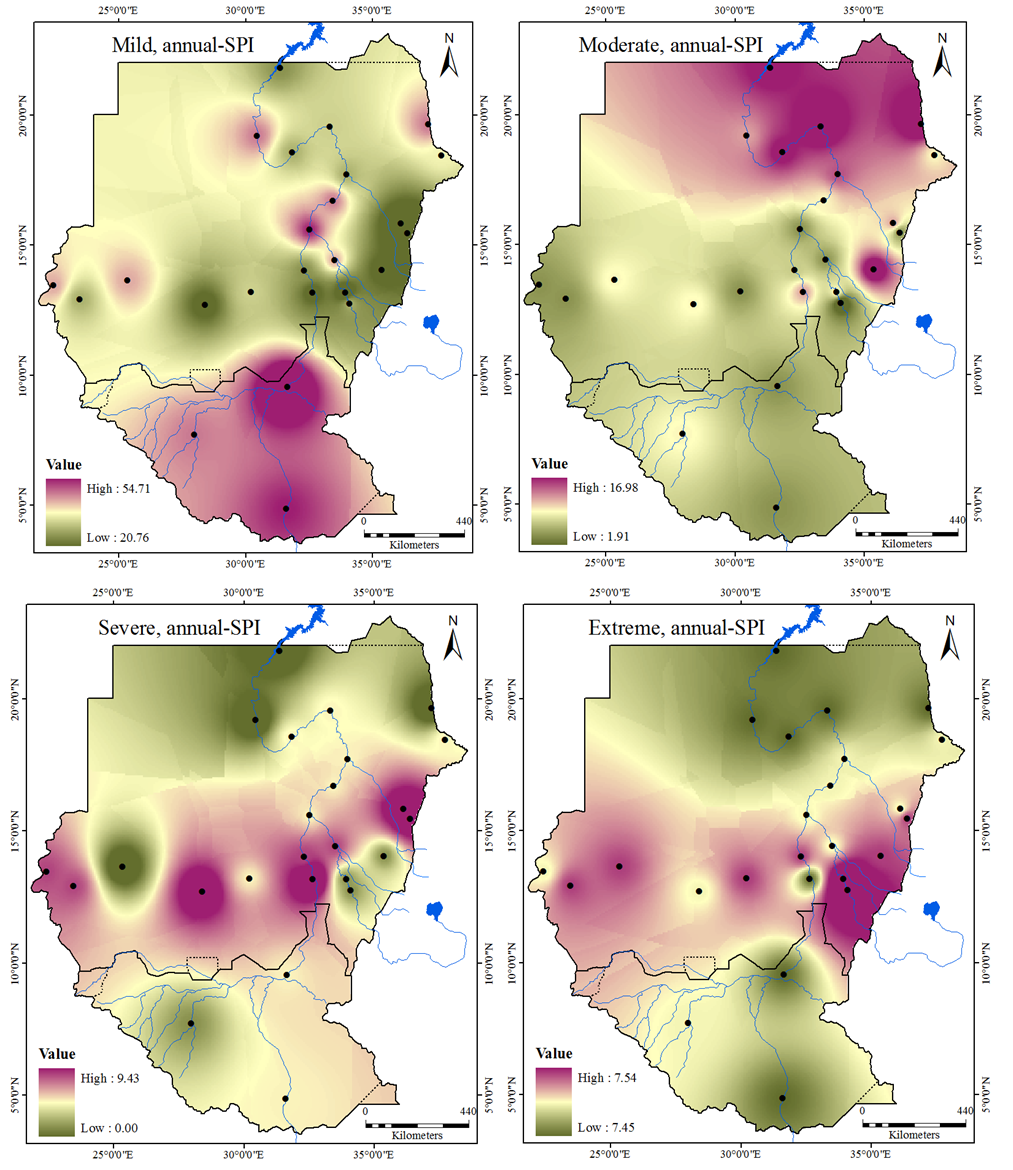 | Figure 3. The frequency distribution of an annual-SPI of a four drought categories in Sudan and South Sudan during 1961-2013 |
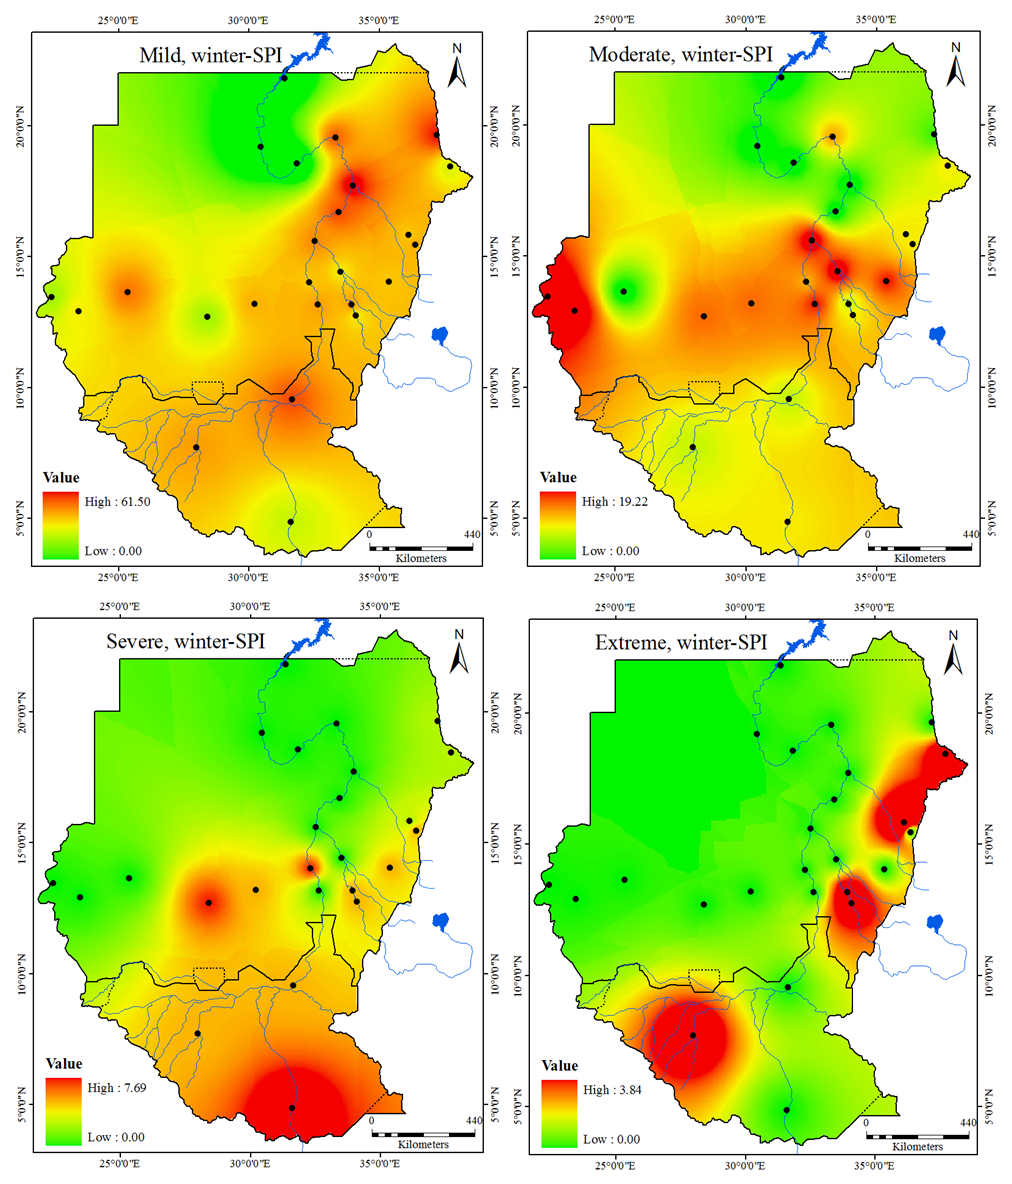 | Figure 4. The frequency distribution of a winter-SPI of a four drought categories in Sudan and South Sudan during 1961-2013 |
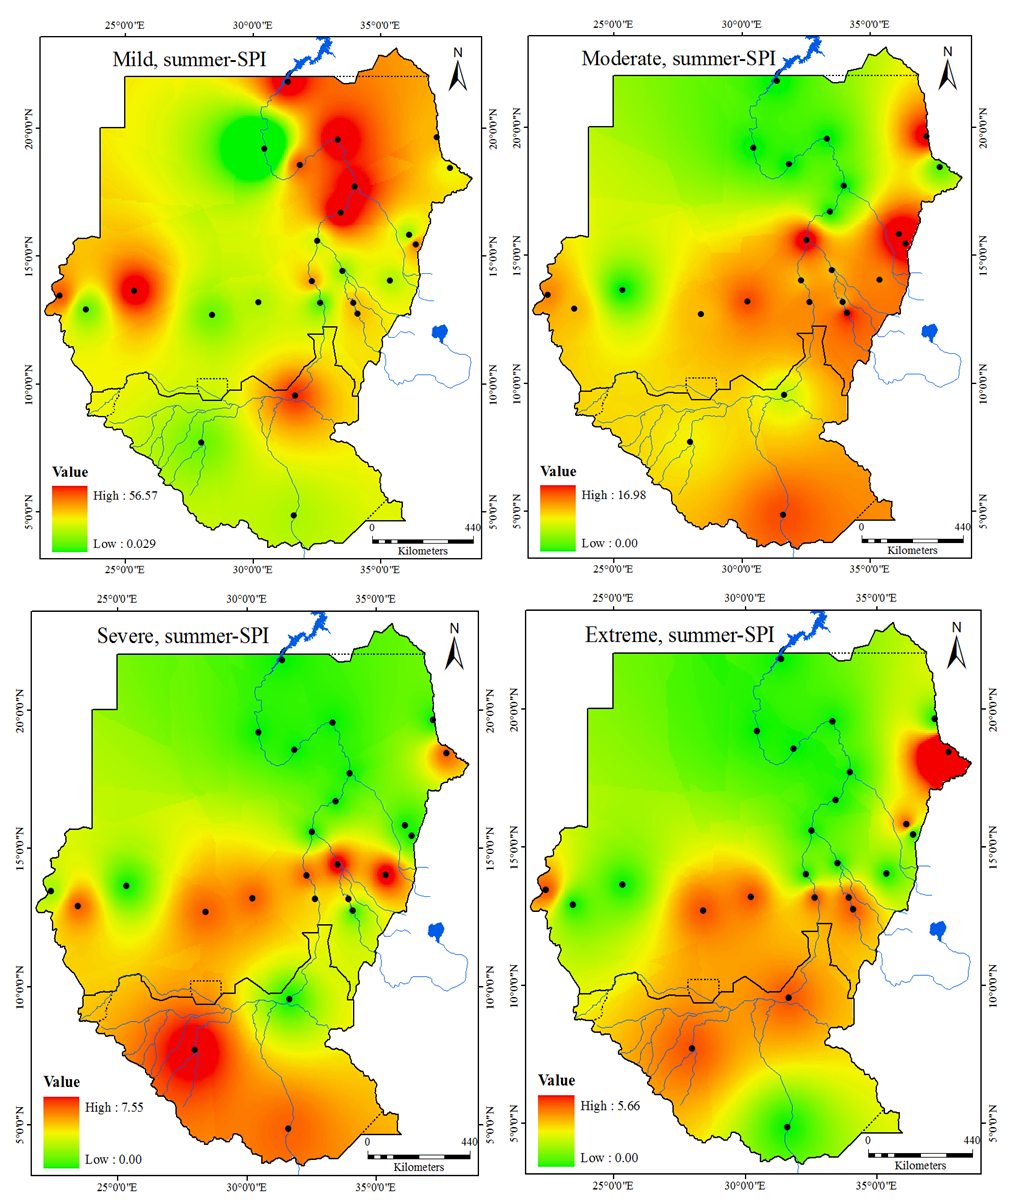 | Figure 5. The frequency distribution of a summer-SPI of a four drought categories in Sudan and South Sudan during 1961-2013 |
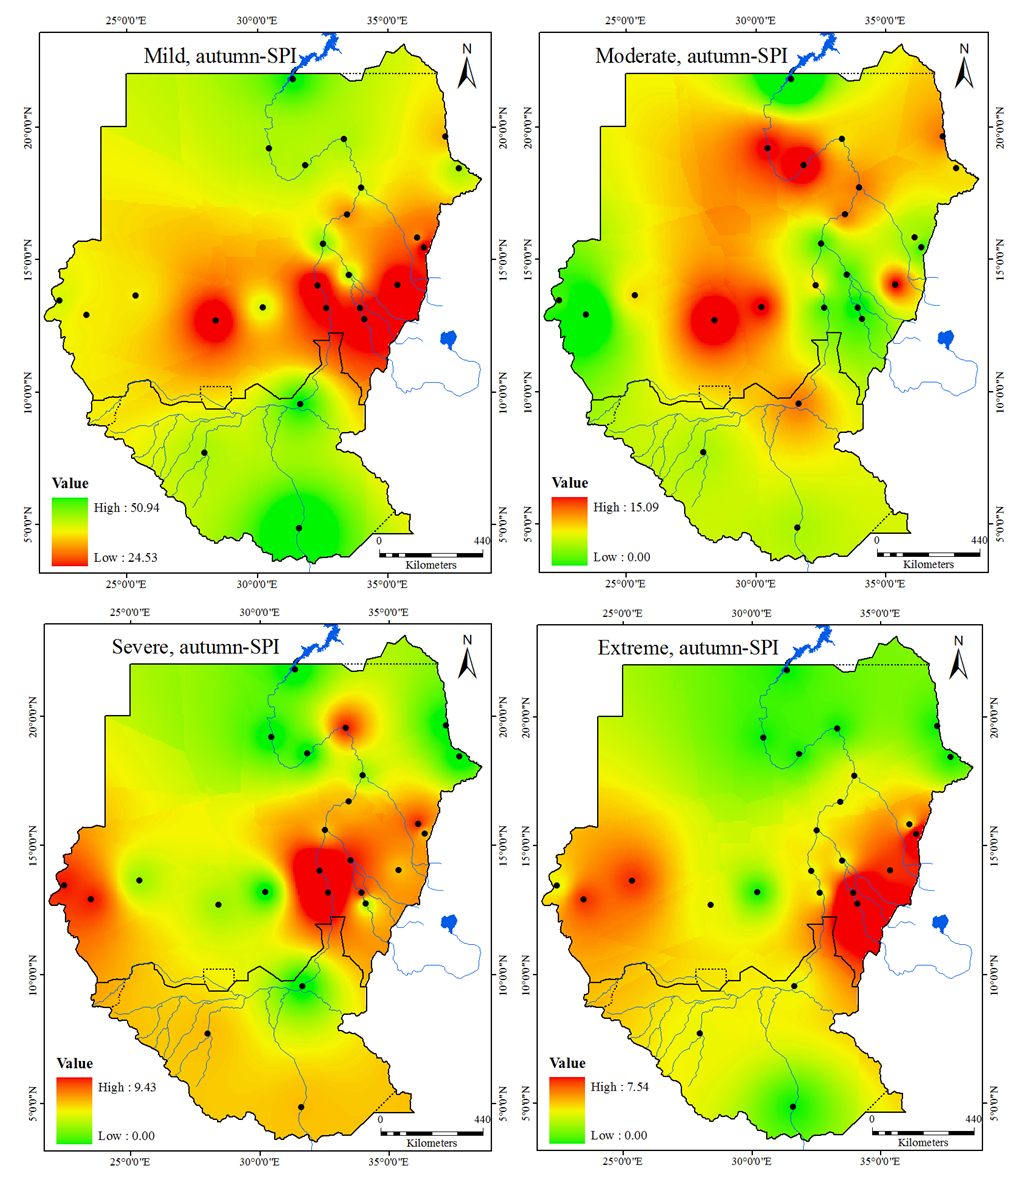 | Figure 6. The frequency distribution of an autumn-SPI of a four drought categories in Sudan and South Sudan during 1961-2013 |
3.4. Drought Trends and Mutation Detection
- Fig. 7 showed the location of the areas which were changed from humid to drought in northeast and middle of Sudan including Halfawadi, Dongola, Karrima, Abuhamed, Atbara, Shendi, Portsudan, Tokar, Aroma, Kassala, Gadarif, Wadmedani, Edduim, Elobeid, and Elnehud. The UF curve on 0.05 level of significance lines in 1998 - 2010 showed that the drought trend is very significant, UF and UB lines intersect in 1995 which is the beginning of mutation of the droughts. The annual-SPI UF curve showed a significant trend in the 2000s, 1989 is the beginning of mutation detection of drought.
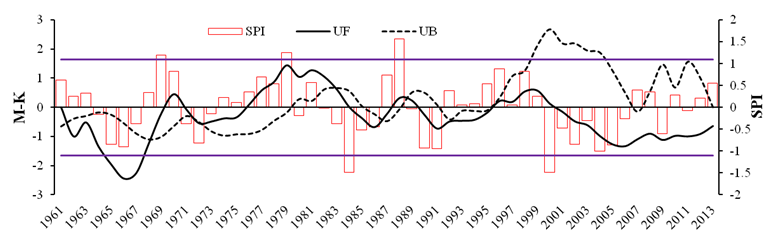 | Figure 7. Interannual variations and Mann-Kendall test of SPI drought index in Sudan and South Sudan during 1961-2013 |
3.5. Actual Comparison SPI Drought Index in the Highest Drought Years
- Fig. 8 showed the monitoring of SPI drought index in 1984, 1991 and 2000, the actual comparison of SPI index in the highest drought years to monitor the degree of droughts in Sudan and South Sudan. 1984-SPI showed extreme drought in Geneina, Zalingei, and Alfashir; severe drought in Elnehud, Elobeid, Edduim, Gadarif, Abuhamed, Dongola, and Juba; moderate drought in Malakal, Kosti, Wadmedani, Khartoum, Aroma, Abuhamed, and Dongola; mild drought in Wau, Kassala, Tokar, and Halfawadi. However, 1991-SPI showed the extreme drought in Singa, Abuhamed, Gadarif, and Kassala; severe drought in Malakal, Elobeid, Elnehud, Edduim, Wadmedani, and Aroma; moderate drought in Wau, Geneina, Zalingei, and Khartoum; mild drought in Juba, Alfashir, Shendi, Atbara, Karrima and Dongola. 2000-SPI showed the extreme drought in Zalingei, Alfashir, Elnehud, Elobeid, Edduim, Khartoum, Shendi, and Kassala; severe drought in Kosti and Atbara; Moderate drought in Gadarif, Karrima, and Abuhamed; Mild drought in Juba, Malakal, Singa, Dongola, and Halfa.
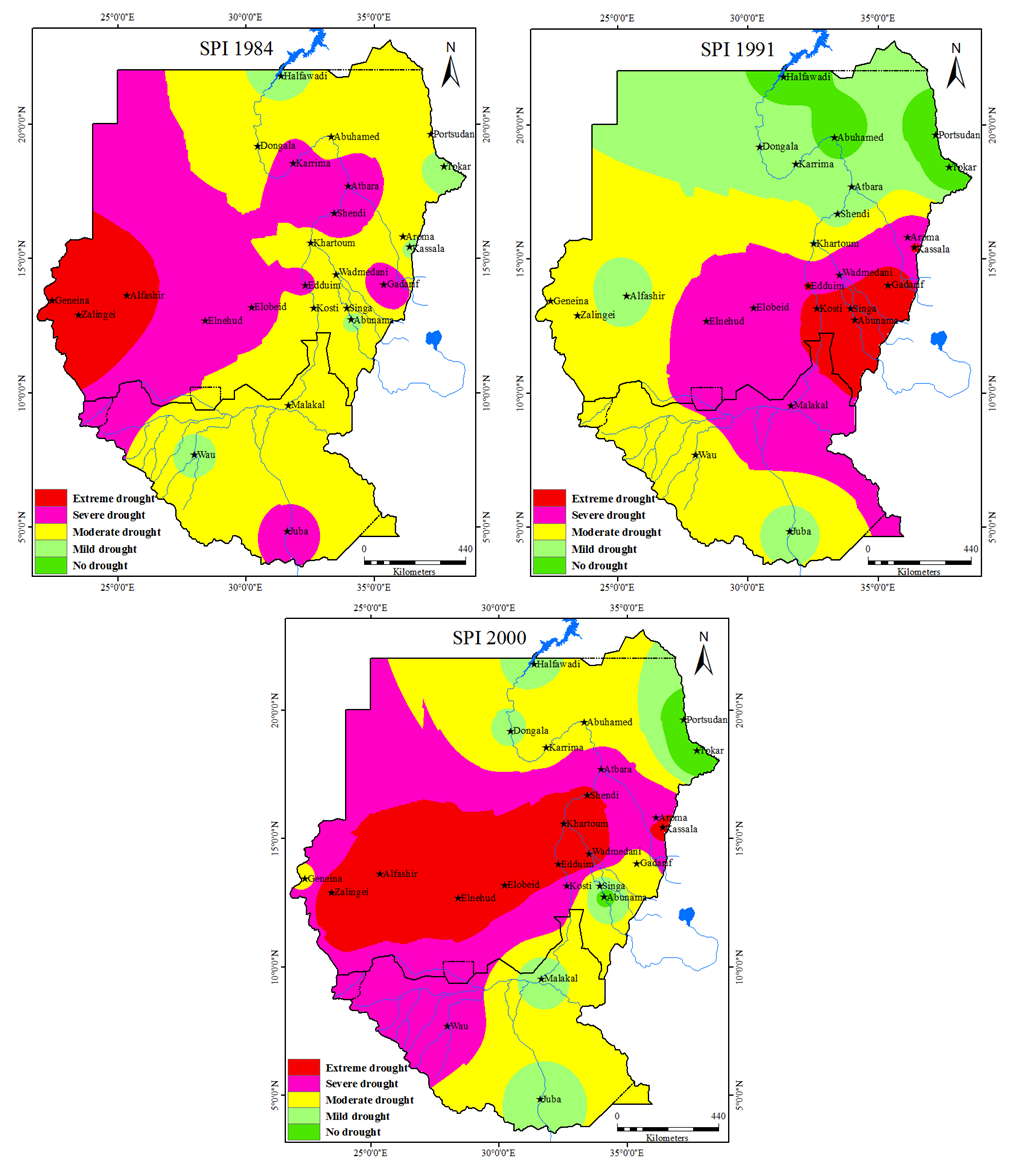 | Figure 8. Monitoring results of SPI drought index in Sudan and South Sudan in 1984, 1991 and 2000 |
3.6. Influences of Drought in Sudan
- Climate changes, successive droughts, population pressure and chronic food shortages are the major threats in the North Kordofan state. Drought problems in Sudan will increase if the above trends continue. The drought in North and Western Sudan, North Kordofan and Darfur, Kassala State and some parts of the rain-fed areas in central Sudan are influencing agriculture, livestock, water resources and health [20]. Sudan suffered a severe famine in the mid-1980s. Examination of the mean annual precipitation for some of the most severely affected regions in Sudan revealed that most severe famines of the past two decades (1984-85, 1973-74, 1965-66) were associated with the worst multiple-year droughts [28]. The livestock prices decrease during drought periods, indicating disposal of assets on a large and widespread scale. There has been a drought in some of the main grain producing areas, such as Gadarif, and in some more impoverished parts of the country. In other places, there has been a disastrous dry spell mid production season, and in parts of the west and east, water is becoming very scarce. Pasture across northern Sudan is reported to be very poor [29]. There are many ongoing national policy processes that have parallel aims to climate change adaptation. Water harvesting techniques have been implemented for nine areas in several states (North Darfur, Nile, North Kordofan, and West Kordofan). These projects have increased community access to reliable water, increasing their capacity to cope with the impacts of reduced precipitation, increased temperature and drought, all of which have been integrated into the NAPA consultation process. At the state level, many environment councils have been established. By virtue of the broad NAPA consultation process conducted in Sudan, many of these councils have recently begun to formally propose potential adaptation measures in their sectoral policy discussion. This has been a very clear outcome, particularly with respect to food security, water, and public health sectors [20].
4. Conclusions
- This study revealed that decrease in precipitation caused droughts which consequently would reduce the natural vegetation cover, croplands and livestock production. Drought indices designed to provide a concise overall picture of droughts are often derived from massive amounts of hydro-climatic data and are used for making decisions on water resources management and water allocations for mitigating the impact of droughts. In recent years, the study area is influenced by intense climate warming and a decrease of precipitation, drought occurs frequently over arid areas. Most drought studies focus on quantifying drought on the regional or global scales, but this generalization can obscure localized effects. This study recommends diversifying livelihood options in order to cope with the variations in local weather as well as adopting a number of steps to change the wrong agricultural practices. Understanding of community perceptions and their sharing in designing policies and projects for effective adaptation strategies can allow coping with the impacts of climate change. Adapting and mitigating the drought periods: improving livelihoods, agroecosystem resilience, agricultural productivity and the provision of environmental services. Also essential to note that a range of fundamental natural resources, including land, water, air, biological diversity including forests, grasslands, etc., provide the indispensable base for an agricultural production system and sustenance of agricultural ecosystems. Make many works to improve food security conditions, food security monitoring, and early warning systems, to macroeconomic policy, relief management and institutional strengthening both at the national and sub-national level, long-term food security planning and save the strategic reserves of food security.
ACKNOWLEDGMENTS
- The present research was supported by the National Natural Science Foundation of China (Grant number is 41471058 and 41641003. The NSFC project (Grant number 91425303) and the SKLCS FUNDING (SKLCS-ZZ-2017).