-
Paper Information
- Paper Submission
-
Journal Information
- About This Journal
- Editorial Board
- Current Issue
- Archive
- Author Guidelines
- Contact Us
American Journal of Environmental Engineering
p-ISSN: 2166-4633 e-ISSN: 2166-465X
2017; 7(2): 47-52
doi:10.5923/j.ajee.20170702.03

Hydraulic Performance Evaluation of Integrated Operation of Pressurized Irrigation System: (Case Study at Alamata Woreda, Selam Bkalsi Farm Area)
 Abstract
 Reference
 Full-Text PDF
 Full-text HTML
Tsegay Weldu Hailu
Department of Water Resource and Irrigation Engineering, Institute of Water Technology, Arba-Minch University, Ethiopia
Correspondence to: Tsegay Weldu Hailu, Department of Water Resource and Irrigation Engineering, Institute of Water Technology, Arba-Minch University, Ethiopia.
| Email: |  |
Copyright © 2017 Scientific & Academic Publishing. All Rights Reserved.
This work is licensed under the Creative Commons Attribution International License (CC BY).
http://creativecommons.org/licenses/by/4.0/

Pressurized irrigation system (sprinkler and drip) is one of the modern/artificial water applications irrigation systems to the soil or plant. A poor designed and managed pressurized irrigation systems result in non-uniform water distribution. In addition to this, its performance may also deteriorate with time due to wear, lack of maintenance, clogging and other physical and environmental factors. Since pressurized irrigation system is easily influenced due to wear, lack of maintenance, clogging and environmental factors it is recommended to carry out its performance evaluation periodically soon after the system’s installation. The general objective of this study was to evaluate the performance of integrated pressurized irrigation systems that is found in Raya Valley, specifically Selam Bkalsi farm area which is found near Alamata town. The data used to evaluate the hydraulic performance indicators of the existing integrated pressurized irrigation system in the farm area was collected through catch can experiment and questionnaire survey methods. The results obtained in sprinkler system indicate 87.78% for Christiansen uniformity coefficient (CU), 81.58% for distribution uniformity (DU) and 83.37% for application efficiency (Ea). While the result obtained in drip system indicates 73.86% for Christiansen uniformity coefficient (CU), 57.1% for emitter flow variation (qv), 27.8% for coefficient of variation (Cv), 69.38% for Emission uniformity (EU), and 72.15% for statistical uniformity (Us). In this study, the integrated pressurized irrigation system (sprinkler and drip) over the study area as a whole was not operated well efficient. According to the parameters used to evaluate the existing operational pressurized irrigation system over the specified study area and compared to the specified standards, sprinkler irrigation system has good performance as well as the drip irrigation system has less performance. Generally in the study farm area sprinkler system is well performed.
Keywords: Integrated Pressurized Irrigation system (sprinkler and drip), Performance Evaluation, Hydraulic performance indicators Selam Bkalsi farm area, Alamat, Raya Valley
Cite this paper: Tsegay Weldu Hailu, Hydraulic Performance Evaluation of Integrated Operation of Pressurized Irrigation System: (Case Study at Alamata Woreda, Selam Bkalsi Farm Area), American Journal of Environmental Engineering, Vol. 7 No. 2, 2017, pp. 47-52. doi: 10.5923/j.ajee.20170702.03.
Article Outline
1. Introduction
- Irrigation is the artificial application of water to the soil or plant, in the required quantity and at the time needed. Irrigation is thus a risk management tool for agricultural production. The risk of yield reduction due to drought is minimized with irrigation; because moisture can be added to the soil to meet the water requirements of the crop. The art of irrigation can be achieved using watering cans, sprinkler, drip, surface systems and others. Irrigation is widely carried out through surface and pressurized systems, characterized by the mode of transport of the water onto the point of application (Keller and Bliesner, 1990).Irrigation is a major importance in many countries, it is important in terms of agricultural production and food supply, the incomes of rural people, public investment for rural development, and often recurrent public expenditures for the agricultural sector. Yet dissatisfaction with the performance of irrigation projects in developing countries is widespread. Despite their promise as engines of agricultural growth, irrigation projects typically perform far below their potential (Small and Svendsen, 1992). Head-tail problems, leaky water conveyance and malfunctioning structures because of delayed maintenance, leading to low water-use efficiency and low yields, are some of the commonly expressed problems. A large part of low performance may be due to inadequate water management at the system and field level (Cakmak et al., 2004).Modern irrigation technologies have high water savings under well management especially in arid and semi-arid regions of the world (Bilal et al., 2010). A poor designed and managed pressurized irrigation systems result in non-uniform water distribution. In such system, the most valuable outcome of evaluation of performance process is irrigation uniformity. Water distribution uniformity of sprinkler irrigation depends on the system design parameters (sprinkler spacing, operation pressure and nozzle diameter) and environmental variables such as wind speed and direction whereas in drip irrigation system, water distribution uniformity is usually a combination of measuring the variability of emissions from individual emitters and pressure variations with the entire system (Keller and Bliesner, 1990; Singer et al., 1991; Tarjuelo et al., 1992).Irrigation performance assessment has been given the highest priority in irrigation research among other research priorities needed to solve the problems of irrigation development and management (Nwa and Pradhan, 1993). Performance of irrigated agriculture which includes irrigation methods or system must be improved in order to produce additional food per unit area for a fast growing population like Ethiopia. It is essential for irrigation mangers to know how much water is being applied as it is designed and also an important input into any irrigation budgeting or scheduling process.To confront water stress and reduce water losses, the regional government of Tigray has introduced integrated pressurized irrigation system (sprinkler and drip) to the community of Selam Bkalsi. Pressurized irrigation system is recommended that performance evaluation may be carried out soon after the system’s installation, and periodically repeated, especially when considering systems, due to their sensitivity to operational conditions along the time (Keller and Blisner, 1990). Since this technology is new to the study area, there was no research carried out before to evaluate its performance effectiveness or ineffectiveness.Therefore, evaluating the performance of this integrated pressurized irrigation system has a significant to realize its efficient application of water to eliminate wastage of water and improve the overall irrigation system efficiency. Moreover, it is essential to evaluate the performance of the existing system because it should be operated in compliance with design specification or with miss manageability. The performance of the system may also deteriorate with time due to wear, maintenance, clogging and other physical and environmental factors. With current developments in agriculture, fertilizer and different chemicals is even applied with irrigation water (through fertigation and chemigation system) and so non-uniform application of these has both economic and environmental consequences. Performance assessment on regular basis could help to identify suchkind problems.
2. Materials and Methods
- Study Area Description The study area is found in southern zone of Tigray region near to Alamata town which far about 600 Km from Addis Ababa to north and 180 Km from Mekele to south. The project area is located in the lower flat plain of Raya Valley between altitudes of 1480 to 1520 m above sea level and geographical location between latitudes of 12° 16’ and 12° 55’ N and between longitudes 39° 22’ and 39° 53’ E with average elevation of 1518.2 m above sea level. The farm covers an irrigation area of 36 ha.The study area has a bimodal rainfall pattern with a short rainy season and a long rainy season with a mean annual rainfall of 685 mm. It is located at the low land ecological zones with mean annual temperature ranges from 14.3°C at night to 28.9°C at day time. The soils in the study area are mostly loamy and silt loam to clay loam in texture and deep to very deep, moderately well drained to well drained and are mostly classified as highly to moderately suitable for irrigation development.
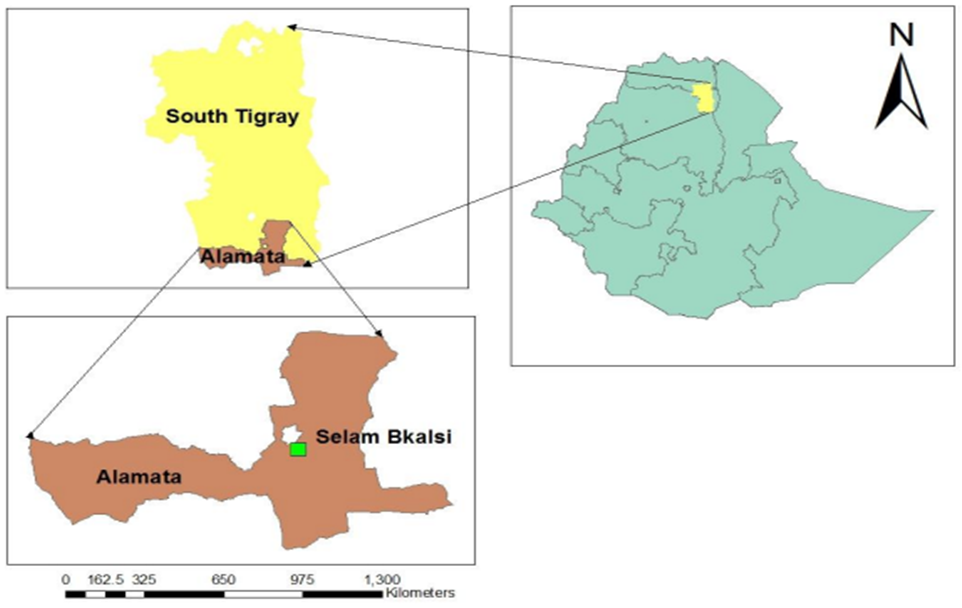 | Figure 1. Study area map |
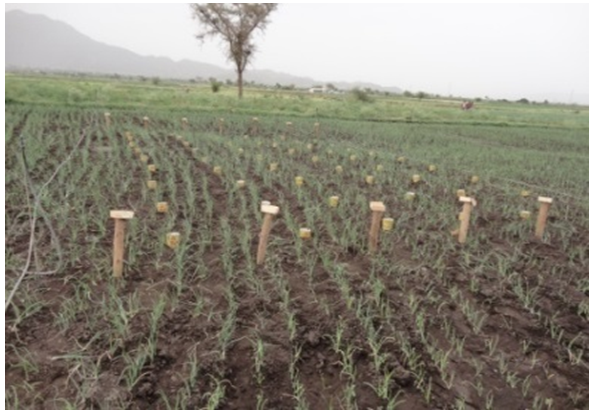 | Figure 2. Sample collection using catch cans: at sprinkler system |
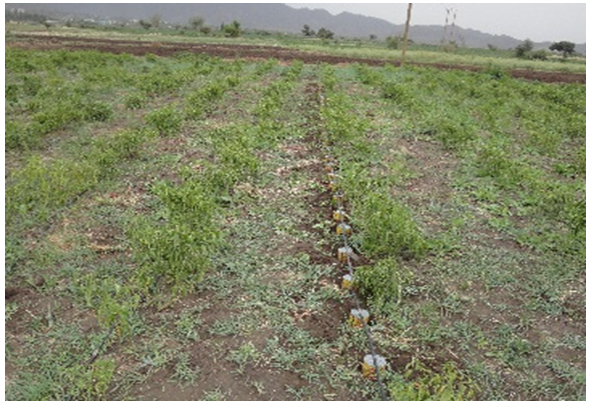 | Figure 3. Sample collection using catch cans: at drip system |
 Where; q = sprinkler discharge, m3/h, V = volume of water collected, l, t = time taken to fill the bucket, sec.v Uniformity coefficient for sprinkler system, CU (%)Sprinkler systems is quantified using the coefficient of uniformity stated by Chrictiansen’s (Christiansen, 1942) and calculated using:
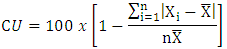 Where; CU = Christiansen uniformity coefficient, %,
  depth of water stored in the ith catch can, mm,
  the average depth of water caught in the cans, mm, n = number of collectors measured.v Distribution uniformity DU (%)This is also another indicator used to assess the uniformity of applied water by sprinkler system. DU is calculated as the ratio of the mean of 25% of the samples nearest to lowest to the mean of all measured samples and it is calculated using:
 Where;
  = average of the lowest one- fourth of catch can measurements, mm
  = average depth of application overall catch can measurement, mm.v Application Efficiency, Ea (%)Application efficiency is normally defined as the ratio of the volume of irrigation water to the average volume of water delivered to the area. Ea is an important performance indicator for evaluation of irrigation systems. It is calculated using:
 v Average emitter discharge rate,
  The average discharge rate of emitters can be calculated as:
 Where;
  average discharge, l/hr
  the flow rate of the emitter i (l/hr), n = the total number of emitters.Standard deviation of emitter flow rate,
  is estimate by the equation proposed by ASABE (2008R).
  v Emission Uniformity, EU (%)EU is another indicator to measure emitter uniformity performance and it is calculated by Equation:
 v Emitter flow variation, qvarThe emitter flow variation is calculated using Equation:
 Where; qmax is the maximum emitter flow rate (l/hr), qmin is the minimum emitter flow rate (l/hr).v Coefficient of variation, CvThe coefficient of emitter flow variation was computed by dividing the standard deviation of the emitters discharge to the mean emitter discharge rate expressed in Equation:
 Where;
  = standard deviation of emitter flow rate,
  = average emitter discharge rate, l/hr.v Coefficient of uniformity for Drip system, CU (%)CU is one measure of drip irrigation uniformity and was calculated using Equation:
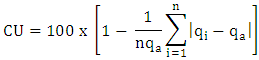 Where;
  = the flow rate of the emitter ith (l/hr), n = the total number of emitters.v Statistical uniformity, Us (%)Statistical uniformity was also calculated by Equation.
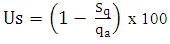
3. Results and Discussions
- In this chapter, the summarized results are presented in the form of tables and graphs with relevant interpretations and discussions.Hydraulic Performance of localized systemsSprinkler System ResultThe overall sprinkler irrigation system installed in the area is homogeneous i.e. it has the same sprinkler head spacing, nozzle type, sprinkler height, length of lateral and number of sprinklers per lateral throughout the farm. The operating pressure head was measured at field control heads (clusters) during test time for different plots and it lay between the recommended ranges by the designer (2.5 to 3.0 bars). All experimentations trials are conducted at the same condition and time. The effect of environmental conditions (wind speed, relative humidity and air temperature) on the application uniformity of the sprinkler system during operation time was little or negligible. This might be due to the result of irrigation run time and height of sprinkler head.The two most common methods used of expressing the application uniformity of sprinkler irrigation system are CU and DU. The computed CU from different plots covered with different crops were varying from 88.13% to 91.25% with an overall average value of 89.57%. Similarly, the computed values of DU for the different plots tested varied from 80.03% to 82.16% with an overall average value of 80.78%. The Ea for the test conducted plots varied also from 88.23% to 89.15% with an overall average of 88.76%.Drip System ResultThe drip irrigation system installed in the area is homogeneous like the sprinkler system. The dripper model is integrated cylindrical dripper. The system pressure operation head was measured during test time at the field control head (cluster) and was found 1.2 & 1.1 bars. Fife parameters were used to evaluate drip irrigation application uniformity: emission uniformity (EU), coefficient of variation (Cv), flow variation (qvar), coefficient of uniformity (CU) and statistical uniformity (Us).Uniformity coefficient (CU) expresses the uniformity distribution of water from the system devices. The uniformity coefficient values for the tested drip system in different plots were 76.1 and 71.62% and the average 73.86%, the mean coefficient of variation were also 0.278 or 27.8% for the drip system, respectively.Emission uniformity (EU) is a major parameter for evaluation of drip irrigation system performance. The EU value obtained for both plots were found 70.5% and 68.26% with average value of 69.38%.The average emitter flow variation of the drip irrigation system was 57.1%, which is beyond the maximum values of the conventional drip irrigation system standard (20%) by FAO (1984). Unacceptable flow variation may be due to water quality, punching problem and clogging effect of emitters.Statistical uniformity (Us) is another indicator used to evaluate drip system application performance. The result of Us in both plots were found 74.2 & 70.1% respectively and the average value was 72.15%.
4. Conclusions
- The hydraulic performance indicators used to evaluate sprinkler irrigation system as well as drip irrigation system are CU, DU Ea and CU, qvar, Cv, EU, Us, respectively. The results obtained were 89.57% for CU, 80.78% for DU and 88.76% for Ea are the hydraulic performance indicators for sprinkler system. And 73.86% for CU, 57.1% for qvar, 27.8% for Cv, 69.38% for EU and 72.15% for Us are the values for hydraulic performance indicators in drip.The results of hydraulic performance indicators revealed that the sprinkler irrigation system is performing better as well as drip irrigation system is performing less. The reasons for the low performance of drip irrigation system are mismanagement of the system, clogging problems, poor handling and less care, lack of skilled person, lack of knowledge about the system and lack of fittings and laterals supply.Generally, the combined or integrated pressurized irrigation system (sprinkler and drip) over the study area was not operated fully efficient. According to the results of hydraulic performance indicators for both irrigation systems, the sprinkler system was more efficient whereas drip irrigation system was less efficient. All computed parameters used to evaluate the existing operation of drip irrigation system in the area revealed that even under the recommended operational pressure head indicated that the performance level of drip system was less efficient. Therefore, based on this study it can be concluded that sprinkler irrigation system has good performance as well as drip irrigation system has low performance.
ACKNOWLEDGEMENTS
- Above all I thank Almighty GOD for giving me the help, strength and good health in achieving all my academic endeavors. I thank also for his mercy and grace upon me during all these days here in Arba-Minch and in all my life. I would like to express my deepest appreciation and gratitude to my supervisor Mekonen Ayana (PhD) for his continuous follow up, excellence guidance, support and valuable critique throughout my study period that makes me on the right track. I wish I could list all individuals that contributed, in one way or another, to the successful completion of my study. But they are too many to mention all. Generally, I would like to thank to all my friends with whom I had always a wonderful time, full of advice, full of help, full of fun and joy throughout this period.Last but not least, my deep gratitude and appreciation goes to my parents and my all great friends for their unwavering day to day encouragement and love throughout my life. Without their support, it was impossible for me to be here.