Chris Skrivanos1, Nicolas Dwarica2, Cameron McKay2, John Allen Floyd2, Mahbub Uddin2
1Department of Petroleum Engineering, Louisiana State University, Baton Rouge, USA
2Department of Engineering Sciences, Trinity University, San Antonio, USA
Correspondence to: John Allen Floyd, Department of Engineering Sciences, Trinity University, San Antonio, USA.
| Email: |  |
Copyright © 2017 Scientific & Academic Publishing. All Rights Reserved.
This work is licensed under the Creative Commons Attribution International License (CC BY).
http://creativecommons.org/licenses/by/4.0/

Abstract
Hydraulic fracturing consumes billions of gallons of water each year to extract oil and natural gas from the ground. The resulting wastewater contains sand, salts, metals, gel, diluted acid, and other unknown proppants, and does not meet the EPA standards for environmental release. With the goal of treating the hydraulic fracturing water to meet the highest possible EPA standards for water quality, a benchtop water purification process was designed, built, and tested. The treatment process consisted of an activated charcoal adsorption column filter, a reverse osmosis membrane and ion exchange columns. Produced water from Eagle Ford Shale was pumped through the system and samples were collected before and after each unit operation. The water, treated with this system, was pumped through the system a second time; samples were collected and analyzed using the same methodology from the first iteration to analyze the potential benefits of a second iteration. In order to assess the effectiveness of each unit operation and iteration in the wastewater treatment system, a series of experiments were designed to monitor the flow ratio, metal & salt content, pH, and change in organic content. Inductively coupled plasma optical emission spectrometry was implemented as a means to measure the metal and salt content present in the water at various purification steps. The produced waters initial metal content was determined to be 184.45 ppm, and the initial salt content was determined to be 2,262.26 ppm. After the first iteration of treatment, the final metal and salt contents were determined to be 0.32 ppm and 1.39 ppm respectively. Gas chromatography was used to monitor organic content. The total organic content of the produced water was reduced by 83.5% by the treatment process. The initial pH of the produced water was 4.25, and after the first iteration of treatment, the final pH was 5.31. The produced water treated in our process in a single iteration met the EPA standards for metal and salt content for potable water; however the pH is at the lower end of the standard. The second iteration analysis showed that the pH of the twice treated water was raised to acceptable levels for potable water, however the concentration of the other pollutants changed negligibly. Based on the average national price for electricity, a treatment system that operated for 10 years would cost $1.68 per day, including the capital costs. The performance analysis indicated that the treatment system has commercial applications for home use in areas with groundwater affected by hydraulic fracturing wastewater.
Keywords:
Produced water, Wastewater treatment, Hydraulic fracturing
Cite this paper: Chris Skrivanos, Nicolas Dwarica, Cameron McKay, John Allen Floyd, Mahbub Uddin, Analysis of Texas Eagle Ford Shale Oil Hydro Fracturing Produced Water Treatment Process, American Journal of Environmental Engineering, Vol. 7 No. 1, 2017, pp. 14-19. doi: 10.5923/j.ajee.20170701.03.
1. Introduction
With the rise of horizontal drilling, hydraulic fracturing has become increasingly common and it is estimated that 90 percent of new wells drilled in the United States are hydraulically fractured. Hydraulic fracturing involves the injection of a very large quantity of high pressure liquid to fracture the rock formation and pry open the fracture. This fracturing allows natural gas/oil to flow freely from the formation into the well for collection. The components used in the hydraulic fracturing process consist primarily of water, sand, salts, gel, diluted acid, surfactant corrosion inhibitor, scale inhibitor, and other additives to aid in the hydro fracturing process. During the hydro fracturing operation when the pressure used to inject the fracturing fluid into the well is released, some of the fluid returns to the surface; this fluid is called “flowback” water. Once gas production begins at the well, all wastewater emerging from the well is called “produced water”. The majority of the water that returns to the surface is produced water; both types of wastewater – flowback and produced water – contain potentially harmful constituents. These constituents can be broadly grouped into several principal categories: salts, organic hydrocarbons, metals, chemical additives and some naturally occurring radioactive material. Because of these constituents, shale oil/gas wastewater should not be released into the environment without adequate treatment. Currently, hydraulic fracturing wastewater is primarily re-injected to specific wells. The EPA recently performed studies which indicate that hydraulic fracturing wastewater can pollute nearby ground water sources and that wastewater re-injection is linked to increased seismic activity near the re-injection wells. A hydraulic fracturing wastewater treatment system could prevent environmental hazards and produce freshwater from a waste product. The purpose of this paper is to report the performance analysis of a Texas Eagle Ford Shale oil hydro fracturing produced water treatment process. The treatment process consists of three primary unit operations: carbon adsorption, reverse osmosis, and ion-exchange. The produced water is first pumped through the adsorption column, then a second high-pressure pump forces the water through the reverse osmosis membrane. The permeate of the membrane flows through two ion exchange columns and is received in a collection bin. A schematic diagram of the treatment process under study is given in Figure 1.Adsorption is the adhesion of atoms, ions, or molecules from a fluid or gas to an insoluble surface and is used to remove suspended organics like oil and grease as well as dissolved organics like benzene and toluene. Our adsorption column consists of a cartridge and housing unit rated for operating pressures of 90 psi and temperatures no higher than 125 °F. The cartridge was 10” tall and accepted 10” x 4.5” cartridges. Reverse osmosis filters work on the principle of membrane divergence. An extremely high pressure (800 psi in our process) is applied at the housing entrance that forces the fluid through the fine membrane. Due to the pressure spike, particles that are small enough pass through the fine holes in the filter transfer, while the larger particles are rejected and thus removed from the membrane. In our application, the reverse osmosis membrane rejected the ions and other larger particles like metals and organics, allowing only water and smaller particles to remain. The membrane we used is a FilmTec Sea Water Membrane designed to handle increased salinity (greater than 10,000 ppm). The reverse osmosis unit operation had a flow ratio of permeate to retentate of 73 to 27, which was determined by a series of mass balances across the unit operation. The flow rate of the permeate was approximately 0.27 GPM. A mixed ion exchange was used to remove any remaining positive or negative ions. Our process consisted of two ion exchange columns in parallel, both of which were 20” vertical columns housed in separate units. The process used two pumps. The first pump transferred the water from the feed tank to the adsorption column at a low pressure. The second pump primed the system to the operating pressure, 800 psi, to transfer the produced water through the reverse osmosis membrane and the ion exchange columns. Inductively coupled plasma optical emission spectroscopy of the produced water determined the initial metal content to be 184.45 ppm, and the initial salt content to be 2262.26 ppm. A simple pH test using a probe was conducted on samples to monitor the change in acidity of the water as it passed through each unit operation; the initial pH of the produced water was determined to be 4.25. Gas chromatography measurements were implemented to monitor the changing levels of total organic compounds present in the water.
2. Methods
2.1. Sample Collection
Each water sample analyzed was obtained from one of four major positions. Position 1: the untreated water, Position 2: after the activated carbon operation, Position 3: after the reverse osmosis operation and Position 4: after the ion exchange operation (Fig. 1). Produced water processed by the system once is defined as first iteration treated water. Produced water processed by the system twice is defined as second iteration treated water. The first iteration sample collection began after flowing untreated produced water through the system for 60 seconds. The second iteration was run identically to the first iteration except produced water that had previously been treated by the system was used instead of untreated produced water. Once collected, samples were labeled according to the iteration, position, and the trial number of extraction.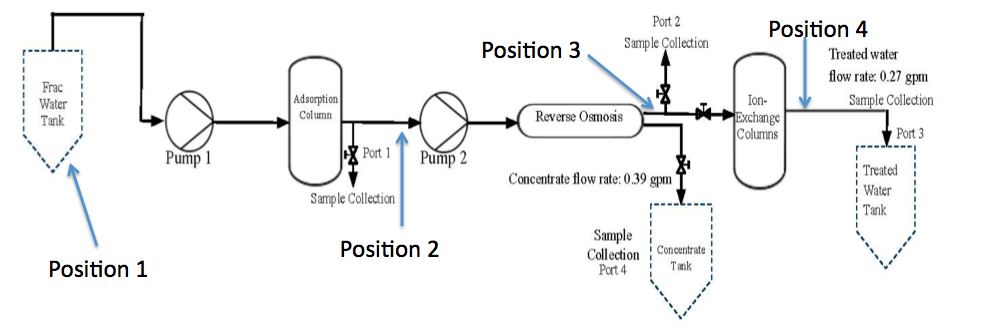 | Figure 1. Process flow chart for wastewater treatment from fracking |
2.2. Instrumentation
In order to assess the effectiveness of each unit operation and iteration of the wastewater treatment system, a series of experiments were designed to monitor the metal & salt content, pH, and change in organic content. The inductively coupled plasma optical emission spectrometer (ICP-OES) used was a Varian 720-ES ICP Optical Emission Spectrometer, in combination with a Varian autosampler. The ICP-OES was used to measure the metal and salt content present in the water at each position (Fig. 1). A simple pH test using a probe was conducted on samples to monitor the change in acidity of the water as it passed through each unit operation. The gas chromatograph (GC) used was a Varian 3900 Gas Chromatograph-Mass Spectrometer. The GC was used to monitor the change in organic content of the water at each position (Fig. 1), and operated according to the EPA’s Method 8260C for the extraction and GC analysis of volatile organic compounds.
3. Analysis of Results
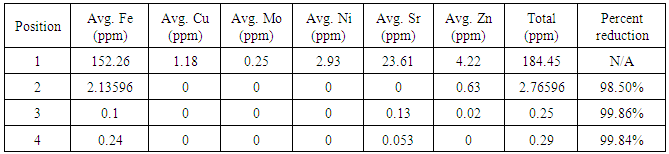
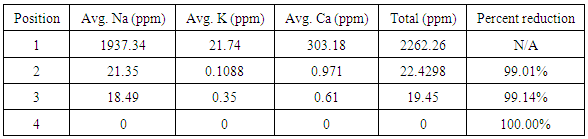
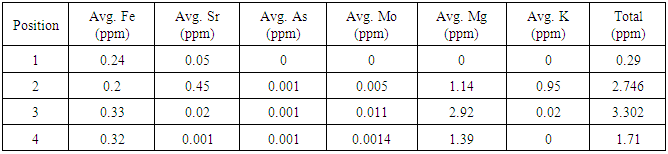
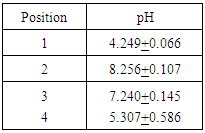
First iteration ICP-OES results showed that the initial salt content of the water was 2262.26 ppm and the initial metal content was 184.45 ppm. The carbon adsorption column removed 99.01 percent of the initial salt content and 98.5 percent of the initial metal content. The reverse osmosis membrane removed an additional 0.14 percent and 0.16 percent of the initial salt and metal content respectively. After the ion exchange column, approximately 100 percent of the total salt content was removed and 99.84 percent of the total metal content was removed, leaving a metal content of 0.29 ppm and a salt content of essentially 0 ppm. A summary of the metal and salt content found in the first iteration water using ICP-OES can be found below in the following tables.Analysis of the second iteration treatment indicated the carbon adsorption column added 0.37 ppm of metal and 2.09 ppm of salt to the water. The reverse osmosis membrane removed 0.29 ppm of metal content and added 0.85 ppm of salt content. The ion exchange column removed 0.04 ppm of metal content and 1.55 ppm of salt content, bringing the final content of the second iteration treated water to 0.32 ppm of metal content and 1.39 ppm of salt content. A summary of the metal and salt content found in the second iteration water using ICP-OES can be found below in the following tables.The first iteration pH results showed that the produced water had an initial pH of 4.25. The carbon adsorption column increased the pH to 8.26, the reverse osmosis membrane lowered the pH to 7.24, and the ion exchange columns lowered the pH to the final value of 5.31. These results are summarized in the following table 4.Table 1. Summary of metal content for first iteration water, determined by ICP-OES. The zero values are indicative of concentrations below the limit of detection of the instrument
 |
| |
|
Table 2. Summary of salt content for first iteration water, determined by ICP-OES. The zero values are indicative of concentrations below the limit of detection of the instrument
 |
| |
|
Table 3. Summary of salt and metal content for second iteration water, determined by ICP-OES. The zero values are indicative of concentrations below the limit of detection of the instrument
 |
| |
|
Table 4. Summary of pH measurements for first iteration water
 |
| |
|
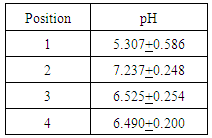
Second iteration pH results showed that the carbon adsorption column increased the pH from 5.31 to 8.27. The reverse osmosis membrane decreased the pH to 7.24. The ion exchange columns brought the pH to a final value of 6.49. These results are summarized in the following table 5.Table 5. Summary of pH measurements for second iteration water
 |
| |
|
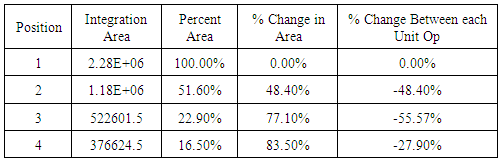
The produced water contained a plethora of unknown organic constituents and it would require an exorbitant amount of time to identify each individual constituent to generate a calibration curve. So instead of measuring the changing concentrations of each constituent, the GC measurements were used to observe the change in the overall organic content in the water, relative to Position 1 of the first iteration, which is representative of the initial organic content of the produced water. The first iteration GC results showed that the carbon adsorption column removed 48.4 percent of the initial organic content, the reverse osmosis membrane removed an additional 28.7 percent of the initial organic content, and the ion exchange columns removed 6.4 percent of the total organic content; the system overall removed 83.5 percent of the initial organic content. Second iteration gas chromatography results were inconclusive due to the limits in the range of detection for the gas chromatograph used in the analysis. The below images (Figs. 2 & 3) display the individual chromatographs of the changing organic content. The following table summarizes the change in organic content across unit operations in the treatment process. 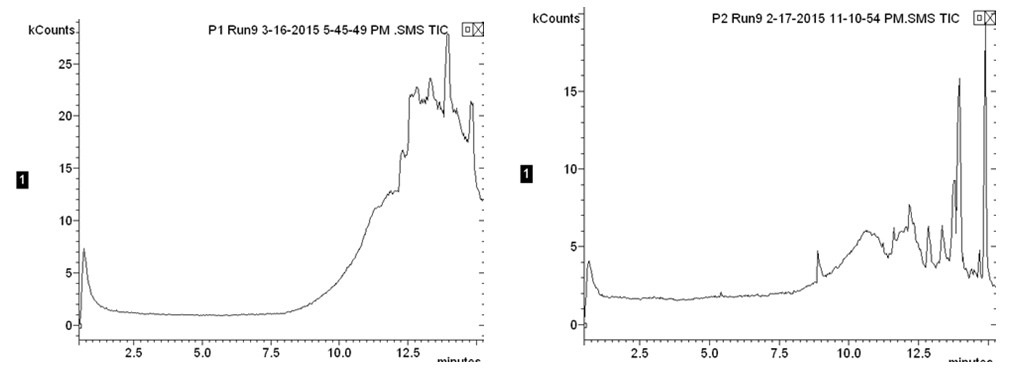 | Figure 2. First iteration chromatographs of the initial organic content (left) and the organic content after the adsorption column (right) |
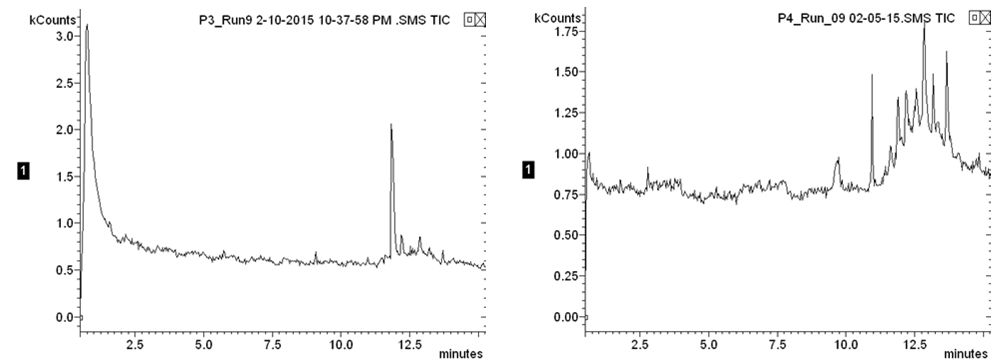 | Figure 3. First iteration chromatographs of the organic content after the reverse osmosis membrane (left) and the final organic content (right) |
Table 6. Summary of change in organic content for first iteration water
 |
| |
|
4. Economic Analysis
Two unit operations in the system required power: the first and second stage pumps. These pumps operated at 122.1 Volts and together consumed on average 3.45 A. The system consumed 421 W and produced treated water at a rate of 0.27 GPM while fully operational. The ratio of kilowatt hours consumed to gallons of treated water produced was 0.026 kWhr/gallon. Based on the national average cost of electricity, 12 cents per kWhr, the operational cost of our system was 0.312 cents per gallon or $3.12 per 1000 gallons. The capital cost of the system, comprised of a first stage pump, a second stage pump, a carbon adsorption column, a reverse osmosis unit, and two ion exchange columns, was $1700. A system that operated for 10 years would cost $1.68 per day, including the capital costs.
5. Conclusions and Recommendations
The performance analysis of the first iteration yielded approximately 100 percent removal of salt content, 99.84 percent removal of metal content, 83.5 percent removal of organic content, and raised the pH from 4.25 to 5.31. The produced water treated in a single iteration had metal & salt contents which met the EPA standards for potable water, but a pH below the standard. The second iteration analysis showed that the treatment raised the pH to potable water standards; however, the negligible change in metal and salt content indicates that a second iteration is superfluous. A second iteration solely to adjust the pH would be unpractical. The addition of a controlled injection pH adjustment unit would allow the pH to be raised to EPA potable water standards. Hazardous concentrations of naturally occurring radioactive material (NORM) have not been detected in the Texas Eagle Ford Shale produced water. While quantifying the concentration of NORM in the produced water is outside the scope of this project, future research should address quantifying the concentration of NORM in the produced water and, if needed, developing a unit operation to lower this concentration to meet the EPA standards for potable water. This study indicated that a single iteration of treatment from our system has commercial applications for home use in rural areas that are affected by hydraulic fracturing wastewater.
References
| [1] | Arthur, J. et al. (2011). “Management of Produced Water from Oil and Gas Wells”. Working Document of the NPC North American Resource Development Study Made Available September 15, 2011, <www.npc.org> (May 5, 2016). |
| [2] | Brant, J., (2011). “Oil and Gas Produced Water Treatment Technologies,” The Nexus Group, Inc., Nashville, Tennessee. |
| [3] | Brown, V (2007). "Industry Issues: Putting the Heat on Gas." Environmental Health Perspectives 115. |
| [4] | Cooper, M. (2005). "Naturally Occurring Radioactive Materials (NORM) in Australian Industries Review of Current Inventories and Future Generation." |
| [5] | EPA (2016). “EPA Guidelines for Water Reuse Summary Tables.” Appendix R, United States Environmental Protection Agency, Washington, D.C. |
| [6] | EPA (2016). “Secondary Drinking Water Standards: Guidances for Nuisance Chemicals.” <epa.gov> (May 5, 2016). |
| [7] | EPA (2016). “Hydraulic Fracturing for Oil and Gas: Impacts from the Hydraulic Fracturing Water Cycle on Drinking Water Resources in the United States (Final Report)” <epa.gov> (February 5, 2017). |
| [8] | GAI Consultants, Inc. (2012). “Bench-Scale Testing of VirotecTM Media for the Treatment of Acid Mine Drainage and Hydraulic Fracturing Wastewaters.” Virotec Europe Ltd., Spencer House, Market Lane Swalwell, Tyne & Wear NE16 3DS, United Kingdom. |
| [9] | Ground Water Protection Council. (2009). "Modern Shale Gas Development in the United States: A Primer." DOE Office of Fossil Energy 56-66. |
| [10] | Hammer, R., and VanBriesen, J. (2012) “In Fracking’s Wake: New Rules are Needed to Protect Our Health and Environment from Contaminated Wastewater” NRDC Document <NRDC.org> (May 5, 2016). |
| [11] | Hatzenbuhler, H. and, Centner, T. (2012). “Regulation of Water Pollution from Hydraulic Fracturing in Horizontally-Drilled Wells in the Marcellus Shale Region, USA” Water, 4, 983-994. |
| [12] | Hause, J., Johnson, H., Locke, D., Lovett, R., Patchen, D., and Ziemkiewicz, P. (2012). “Zero Discharge Water Management for Horizontal Shale Gas Well Development.” West Virginia Water Research Institute, West Virginia University, PO Box 6064, Morgantown, WV 26506-6064. |
| [13] | Kerfoot Technologies Inc. (2010) “Fracture Water Recycling” Groundwater Remediation, Water Pollution Technologies. <kerfoottech.com> (May 5, 2016). |
| [14] | King, G. (2009). "Measuring the Economic and Energy Impacts of Proposals to Regulate Hydraulic Fracturing." Hydraulic Fracturing 101. |
| [15] | Kirker, K., and Burger, R. (2011) “Just the Fracking Facts” Eleventh Annual Freshman Conference, Swanson School of Engineering University of Pittsburgh, Pittsburgh, PA. |
| [16] | Priddle, R. et al. (2012). "Golden Rules for a Golden Age of Gas. World Energy Outlook Special Report on Unconventional Gas." IEA 18-27. |
| [17] | Ramudo, A., and Murphy, S. (2010) “Hydraulic Fracturing- Effect on Water Quality” final project, for Cornell University City and Regional Planning CRP 5072: Land Use, Environmental Planning, and Urban Design Workshop. |
| [18] | Shiels, D. (2014). “Environmental Challenges in Managing Production Waste Streams.” 3rd Annual Environmental Impacts of Oil and Gas Course, State Bar of Texas, San Antonio, TX. |
| [19] | Schlicher, R., Haas, L., and Mostoller, L. “An Innovative Approach to Managing Produced Water and Frac Flowback in the Marcellus Shale” IPEC Annual Conference. |

 Abstract
 Reference
 Full-Text PDF
 Full-text HTML