-
Paper Information
- Paper Submission
-
Journal Information
- About This Journal
- Editorial Board
- Current Issue
- Archive
- Author Guidelines
- Contact Us
American Journal of Environmental Engineering
p-ISSN: 2166-4633 e-ISSN: 2166-465X
2017; 7(1): 10-13
doi:10.5923/j.ajee.20170701.02

Interpretation Capacity of Natural Waters (Sediments) and Depth at Belawan Kaligedang around Ijen Mount with Geoelectric Methods Resistivity Mapping and Metal Content (Fe, Pb) of Natural Waters
 Abstract
 Reference
 Full-Text PDF
 Full-text HTML
Wiyono1, Soemarno2, Sukir Maryanto3, Arief Rachmansyah4
1Doctoral Program an Environment and Development Brawijaya University, Malang, Indonesia
2Agriculture Faculty of Brawijaya University, Malang, Indonesia
3Physics Department of Brawijaya University, Malang, Indonesia
4Engineering Faculty of Brawijaya University, Malang, Indonesia
Correspondence to: Wiyono, Doctoral Program an Environment and Development Brawijaya University, Malang, Indonesia.
| Email: |  |
Copyright © 2017 Scientific & Academic Publishing. All Rights Reserved.
This work is licensed under the Creative Commons Attribution International License (CC BY).
http://creativecommons.org/licenses/by/4.0/

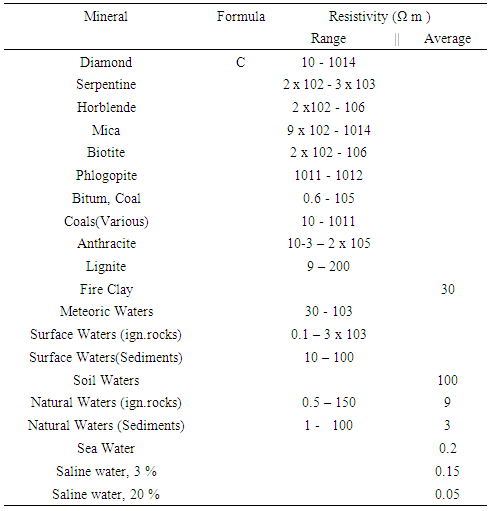
The study was conducted by using geoelectric resistivity method with locations in village Belawan, Kaligedang of Ijen Mount about the source 1, position (S 7° 59.706’ E 114° 11.531’), altitude 1029 m above sea level and source 2, position (S 7° 59.66’ E 114° 11.545’), altitude 1000m above sea level. Measurements and analysis date from serounding source 1 and source 2 found the cross-section figures 1 and 2 and found that the depth of the water. With table 1 Resistivities of mineral (Telford W.M, Applied Geophysics edition 1976), We found varies of depth from 0 to approximately 15 m with a maximum depth of approximately 24.9 m, a width of nearly all the 200 m. Meanwhile, sources 2 to the depth of the water varies from 0 to about 9.94 m, with a maximum depth of approximately 17.3 m. From the results of chemical analyzes of water samples taken from the source above (1) and the bottom source (2) is attached as Atomic Absorption Spectroscopy using result The above source containing Fe with average levels (0.15 ± 0.00) mg/L and lower resource containing Fe with average levels (0.19 ± 0.01) mg/L. And the second water source does not contain Pb.
Keywords: Interpretation, Geoelectric, Natural waters, Resistivity, Ground water
Cite this paper: Wiyono, Soemarno, Sukir Maryanto, Arief Rachmansyah, Interpretation Capacity of Natural Waters (Sediments) and Depth at Belawan Kaligedang around Ijen Mount with Geoelectric Methods Resistivity Mapping and Metal Content (Fe, Pb) of Natural Waters, American Journal of Environmental Engineering, Vol. 7 No. 1, 2017, pp. 10-13. doi: 10.5923/j.ajee.20170701.02.
Article Outline
1. Introduction
- Water is essential for human life therefore man is very dependent on adequate water supply without it, life would be disrupted continuity of life.The research for the exploration of water resources Belawan village area around an altitude of 1000 m above sea level using geoelectric method of barrier type mapping and examining the content of iron and copper from water that gushed out from two sources above and below (all are above the source of warm water Belawan).Coordinate of source 1 is S 70 59.706’ E 1140 11.531’ elevation 1029 m above of surface ocean and source 2 is S 70 59.66’ E 1140 11.545’ 1000 m above of surface ocean. Very important source of water for life existence, let alone at an altitude of about 1000 m above sea level. But it is not easy to get clean water that can be used to life the presence of water and the balance is very important to for life.Map of the location of the research is as follows:
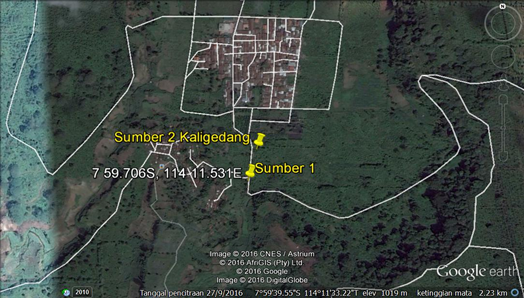 | Figure 1. Map Belawan research sites in Mount Ijen |
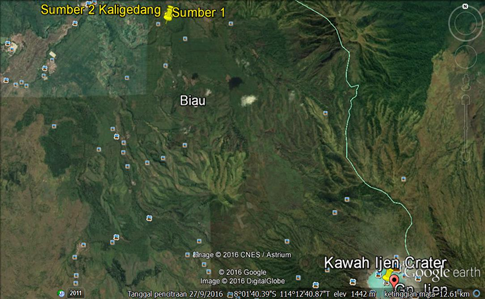 | Figure 2. Map Belawan research sites in Mount Ijen |
2. Regional Geology Research
- Ijen Volcanic rocks Younger.DA: tuff, volcanic breccia, lava and sulfur.Tuff, white - light gray, smooth, easily crushed, irregular layered. Volcanic breccia, yellowish gray, pebble -size to boulders, basaltic - andesitic components angled half bad with a mass of rounded disaggregated basis tuff, lava, composed of andesite basalt, skoria, gray, porphyritic. Sulfur, yellow, pure, spread caldera Mount Ijen.These rocks derived from young and Ijen volcano volcanoes pajungan, which is still visible crater and cone shape. Ijen volcano enterprising young and old appear in the caldera Ijen, while the volcanic slopes of pujangan a parasitic volcano roared. Rock BreakthroughTmi (g) granodiorite and dacite.Granodiorite, white - gray, massive, holokristalin, medium - coarse crystalline, generally has been altered and in some places structured pages and stocky. Mineral composition consists of quartz, plagioclase, feldspar, hornblenda, mineral ores and mineral alteration. Afterwards it was revealed in the west G. Mount Lembu. Di distribution can be found Sekaran textured porphyritic dacite rocks, massive white to gray quartz phenocrysts in the basic mass of plagioclase, feldspar and feldspar sferulitik alleged alteration of volcanic glass.The granodiorite rocks break through rock formations ampar, thus allegedly after Early Miocene age, at least the middle Miocene.Tmi (a) ANDESIT, Andesite Porphyry.Andesite Porphyry, gray-green, massive, porphyritic; hornblenda with phenocrysts, feldspar, mafic minerals; mass base in feldspar, chlorite alteration encountered mineral, calcite bdan sericite.The break Formation andesite Batuampar, allegedly after Middle Miocene age, at least the latter part of the middle Miocene.Structure and tectonicsRocks are exposed in Banyuwangi sheet of Oligocene to Holocene age. Geological structures encountered in the form of a fold structure and straightness.Folding.This structure develops in the formation of the anticline and syncline forming Batuampar trending northwest - southeast. This appearance is obtained from the measurement results of the reconstruction stance and rock slope in the field.Straightness.Cross section inferred from the interpretation of aerial photographs and images Landsat. Pda Batuampar Formation, northwest trending lineament the - East, which is thought to be a weak zone which is a fault.In Kalibaru Formation volcanic rocks and alignment direction is northwest - southeast, northeast - southwest and west - east. - Straightness straightness is thought to reflect the subsurface fault-fault.In the Oligocene epoch mapping area is thought to be in the sea, accompanied by volcanic activity beneath the sea. The result of the volcanic eruption resulted in formation batuampar. During vulkanism activities, siltation occurs in several places, especially in south mapping area, which allows the growth of coral, which results in the formation of limestone Punung Sediment. In the Middle Miocene occurred when a tectonic activity, so that the existing rock, which is then lifted and followed by granodiorite and andesite breakthrough. At the end of the Miocene epoch allegedly has a land area mapping.At Early Pleistocene tectonic activity occurs again with volcanic activity accompanied Oldest Ijen, Ijen Volcano which resulted in the oldest rocks. Then the precipitation occurs in the form Formation Kalibaru next time. In the above oldest volcanic caldera volcanic activity occurred ijen old, Suket Volcano, Volcano and Volcano Pendil roar. Subsequent developments Old Ijen Volcano erupted with a powerful, thus forming a caldera that is large enough. In the old caldera then grow and gungapi Merapi Volcanic Chain. In Holocene eruption of Ijen Young Vulcano. During the Ijen Volcano Young enterprising, the slope appears Parasites G. Raung Pajungan. During volcanic slopes of Merapi Volcano enterprising event of a genang sea, thus enabling the growth of coral on the beach, which produces limestone reefs, which then undergoes the appointment so that the reef limestones forming morphology high elevation. Then process of erosion, weathering and deposition continued to the present, and generate deposition Alluvium.
3. Geoelectric Resistivity Measurement Results
- From the dats of geoelectric resistivity measurements later Data measurements using geoelectric method of barrier type mapping and then using software Res2divn 2-dimensional cross-sectional images obtained as follows
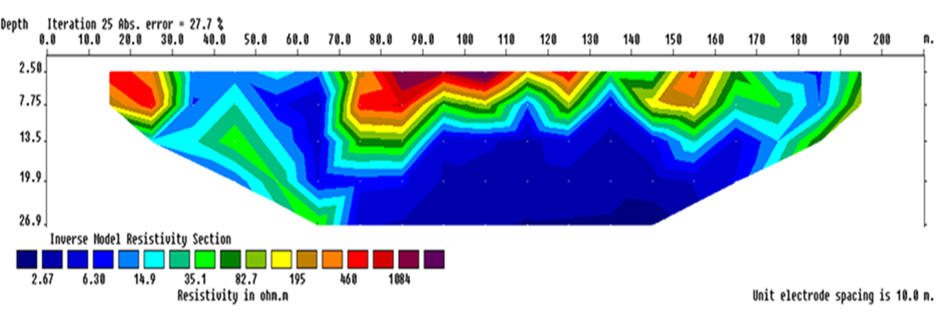 | Figure 3. Cross-Section line serounding from source 1 |
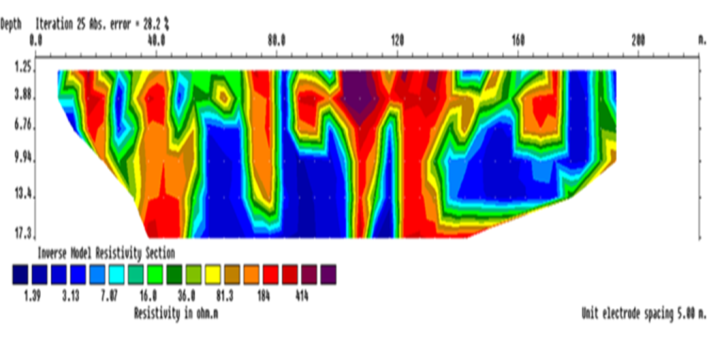 | Figure 4. Cross-section line serounding from source 2 |
|
4. Discussion the Results of Geoelectric Resistivity Cross-section and Chemical Analysis of Water
- From Table 1 Telford p. 451-452 and Measurements close to the source of a stretch of 1, of the cross-section figure 1 found that the depth of the natural water varies from 0 to approximately 15 m with a maximum depth of approximately 24.9 m, a width of nearly all the 200 m.And that the groundwater enormous capacity to source 1 Meanwhile, sources 2 close to the depth of the water varies from 0 to about 9.94 m, with a maximum depth of approximately 17.3 m.From the results of chemical analyzes of water samples (in Chemical Laboratory of Brawijaya University) taken from the source above (1) and the bottom source (2) is attached as Atomic Absorption Spectroscopy using the results obtained: the above sources containing Fe with average levels (0.15 ± 0.00) mg/L and lower resource containing Fe with average levels (0.19 ± 0.01) mg/L. And the second water source does not contain Pb.Fe content maximum value allowed in order to secure for life is 0.3 mg/L, while for Lead maximumnya 0.01 mg/L.
5. Conclusions
- Analysis and above discussion explains that both the source 1 and source 2 groundwater capacity is large enough and heavy metal content of lead there, while Fe is quite small because the maximum limit 0.3 mg/L. So groundwater from heavy metals and Lead harmless Fe can be for life. Then enough water content does not contain Pb, and odorless so it is not harmful.Suggestion: in order to research held metal content of other metals.