-
Paper Information
- Paper Submission
-
Journal Information
- About This Journal
- Editorial Board
- Current Issue
- Archive
- Author Guidelines
- Contact Us
American Journal of Environmental Engineering
p-ISSN: 2166-4633 e-ISSN: 2166-465X
2016; 6(6): 174-183
doi:10.5923/j.ajee.20160606.03

Optimization of Rice Straw Acid Hydrolysis Using Response Surface Methodology
 Abstract
 Reference
 Full-Text PDF
 Full-text HTML
Surendra P. Yadav, A. K. Ray, U. K. Ghosh
Department of Polymer & Process Engg., Indian Institute of Technology, Roorkee, India
Correspondence to: Surendra P. Yadav, Department of Polymer & Process Engg., Indian Institute of Technology, Roorkee, India.
| Email: |  |
Copyright © 2016 Scientific & Academic Publishing. All Rights Reserved.
This work is licensed under the Creative Commons Attribution International License (CC BY).
http://creativecommons.org/licenses/by/4.0/

Statistical regression modeling and optimization of phosphoric acid hydrolysis of rice straw biomass has been performed using response surface methodology and response optimizer. Central Composite Design (CCD) with rotatability was applied for design of experiments and analysis of effect of reaction temperature, reaction time, acid concentration and liquid-solid ratio on concentration of xylose and furfural. Full quadratic models were fitted from experimental data to find out effect of different reaction variables on concentration of xylose and furfural. Using RSM, optimized conditions of reaction parameters has been obtained to maximize concentrations of xylose and furfural. The maximum xylose concentration was 21.38 g/L at optimized reaction conditions of 80°C reaction temperature, 30 min. reaction time, 8% (w/v) acid concentration and liquid-solid ratio of 6 (volume-mass). The maximum furfural concentration achieved was 4.85 g/L at optimized reaction conditions of 160°C reaction temperature, 150 min. reaction time, 8% (w/v) acid concentration and liquid-solid ratio of 6 (volume-mass). Liquid-solid ratio has less effect on concentration of xylose and furfural than other reaction variables.
Keywords: Rice straw, Phosphoric acid hydrolysis, Xylose, Furfural, Response surface methodology
Cite this paper: Surendra P. Yadav, A. K. Ray, U. K. Ghosh, Optimization of Rice Straw Acid Hydrolysis Using Response Surface Methodology, American Journal of Environmental Engineering, Vol. 6 No. 6, 2016, pp. 174-183. doi: 10.5923/j.ajee.20160606.03.
Article Outline
1. Introduction
- The interest for producing chemicals from renewable resources has been increased since some last decades in direct relation to the declining reserves and increasing prices of fossil fuels [Mansilla et al., 1998]. Different agro residues and grasses make abundant raw materials for biorefinary [Anita et al., 2012]. The concept of biorefinery is based on conversion of different biomasses to different fuels and chemicals. Biomass waste residues available from agricultural and forest processing constitute a potential source for production of different chemicals and fuels using acid-catalyzed process or enzyme hydrolysis [Mansilla et al., 1998]. These abundant lignocellulosic materials contain approximately 34% of cellulose, 26% of hemicelluloses and 28% of lignin [Wiboon et al., 2011]. Therefore, these materials can be utilized for production of chemicals such as xylose, glucose, arabinose, furfural, acetic acid and furfural etc. Acid hydrolysis is the most widely used pretreatment process for hydrolyzing biomass to produce monomeric sugars. In hydrolysis step, acid releases protons that break heterocyclic ether bonds between the different sugar monomers in the polymeric chains formed by the celluloses and hemicelluloses producing pentose and hexose sugars. In dehydration step, sugars dehydrate to form degradation products such as furfural. Both steps take place consecutively in series. Concentration of hydrolyzing agent, reaction time, reaction temperature, particle size of biomass and liquid to solid ratio are different factors which influence on concentration of monomeric sugars and by-products during reaction. Since the effect of all these factors is not identical for all lignocellulosic materials, it is difficult to generalize the behavior of different reaction variables on different lignocellulosic materials [Karimi et al., 2006]. Few studies exist dealing with acid hydrolysis of rice straw [Karimi et al., 2006; Ines et al., 2003; Seoung et al., 2007; Ting et al.; 2012, Esther et al., 2012]. This work deals with the hydrolysis of rice straw using phosphoric acid at different conditions of reaction temperature, acid concentration, liquid solid ratio and reaction time for obtaining xylose solution which on dehydration produces furfural. The objective of this work was to find out optimized reaction conditions in a given range of different reaction parameters such that maximum xylose and furfural formation could be obtained. The response surface methodology (RSM) was employed for process modeling. Response Optimizer tool (enabled in MINITAB 17.1.0) was applied to get optimized reaction parameters such that maximum xylose and furfural could be obtained in a given range of different reaction parameters. In this work rice straw has been acid hydrolyzed using phosphoric acid and taking all reaction parameters (4 nos.) simultaneously to find out effect on xylose and furfural concentration. In most of previous studies, liquid-solid ratio has not been considered as reaction parameter and it has been taken as constant and phosphoric acid has not been used as hydrolysis media for rice straw.
2. Materials & Methods
2.1. Raw Material Characterization
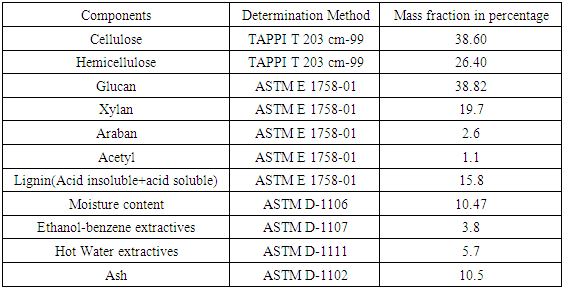
- Rice (Orzya sativa) straw was collected from local agricultural farms in Saharanpur (U.P., India) at the geo-coordinates 29.96710N, 77.55100E after harvest of grains. The rice straw was washed for removal of dirt and soil followed by drying and after drying, it was cut to small pieces and milled in a dry defibrator grinding machine. Grounded material was passed through stack of sieves and the material passed through 60 mesh sieve and retained on 80 mesh sieve was collected for further experimentation process. Average Particle size of material collected for experiments was 0.18 mm. Extractives in raw material such as waxes, fats, resins, starches and coloring matter were removed using ethanol-benzene and hot water mixtures as described in standard procedures ASTM D-1105 and ASTM D-1110. After extraction process, samples were air dried at below 40°C and stored in air-tight container till further use. Analysis of rice straw for different fractions was carried out by different TAPPI and ASTM standard methods. The composition of the rice straw is shown in Table 1.
|
2.2. Experimental Design and Acid Hydrolysis
- Central Composite Design (CCD) with rotatability was used for designing of experiments with four independent continuous variables. Design of experiments was used for study of response surface patterns and optimization of reaction conditions to obtain maximum concentration of xylose and furfural from rice straw. Using CCD, axial runs were introduced for fitting the second order model through sequential experimentation. The experimental design was developed using Minitab 17.1.0, which resulted in total 38 runs (16 factorial point, 12 centre points in cube, 8 star points and 2 axial centre points). All 38 runs were carried out in randomized manner. Different levels of variables were selected according to literature studies.The independent variables were coded according to the following equation:
 | (1) |
 and
and  are dimensionless and actual values of independent variable
  , respectively.
  is the actual value of independent variable at the centre point,
  is the step size change in independent variable such that
  changes by unity. The experiments were carried out in a rotating digester consisting of two stainless steel cylindrical reactors inside it, each having capacity of one liter. After loading required quantity of raw material and acid for each run in the reactors, the cap sealed reactors were immersed in water filled digester equipped with two heating elements, 1.2 kW each to heat surrounding water of reactors. Due to rotation of digestor, the reaction mixture inside reactor mixed completely. Reaction mixture attained desired reaction temperature within 10-15 min. as heating of reaction mixture started. Negligible reaction has been assumed in heating up period of reaction mixture. All experiments were carried out in duplicates in randomized order and average values were taken. After completion of hydrolysis and dehydration steps, the solid material and liquid fractions were separated by Whatman filter paper (45 µm). Filtrate was centrifuged at 3000 RPM to remove further undissolved solids in filtrate. Liquid fractions were diluted upto 100 times and preserved in cold condition such that no further degradation could take place. The filtrate was again filtered through 0.2 µm Whatman filter paper before analyzing with HPLC for concentration of xylose and furfural. The range of different reaction parameters for hydrolysis reactions was such as the reaction temperature 80-160°C, acid concentration 2-8%, reaction time 30-150 min. and liquid solid ratio of 6-14. Each variable was examined at five levels -2,-1, 0, +1 & +2 as shown in Table 2.
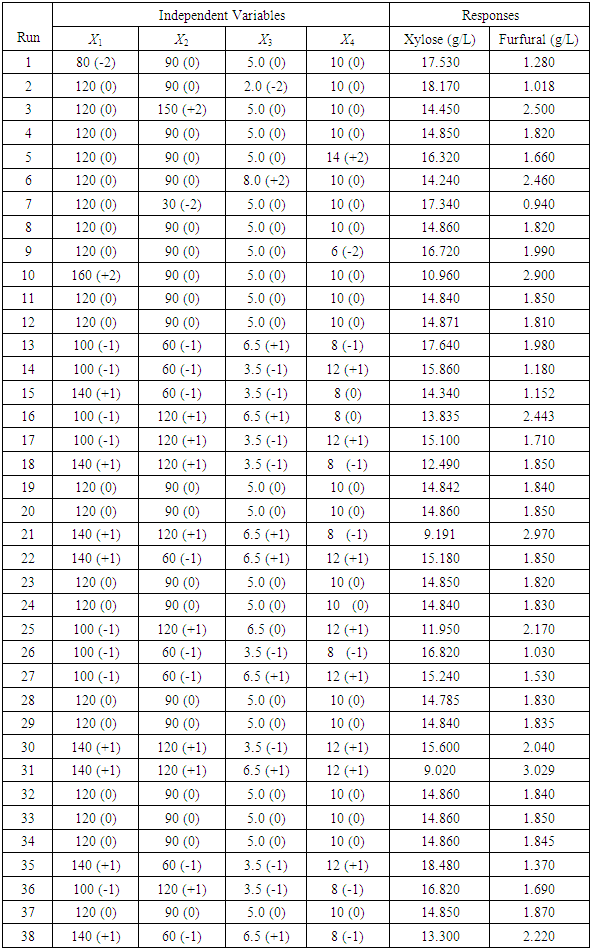
2.3. Analytical Methods
- Liquid hydrolyzed samples were analyzed by HPLC (SHIMADZU SIL-20AHI) for xylose and furfural. HPLC conditions used in this analysis were such as : Column C-18, Detector- Photo Diode Array, Elution mode-Isocratic, Flow-1.00 ml/min, Mobile Phase- 0.005 M H2SO4, Sampling Speed-15 µl/sec., Purge Time-25.0 min, Injection volume-10 µl, Column Temperature- 45°C. Detection and concentration of different compounds in hydrolyzate samples were based on comparing retention time and peak area with retention time and peak area of standard solutions of particular compound.
2.4. Statistical Analysis
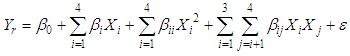
- Experimental data was fitted by full quadratic regression models containing linear, square and second order terms to find out the effect of different independent variables on dependent variables. The quadratic model used for fitting response variables may be expressed as Eq. (2).
 | (2) |
 is predicted response of dependent variable
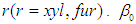 is the interception coefficient,
  is the quadratic coefficient,
  is the interaction coefficient and
  represents noise or error observed in the response
  . Analysis of variance, response surface regression, analysis of response surface design, plotting of surface plot and contour plot were carried out by Minitab 17.1.0 software using experimental data. The quality of regression models were assessed by correlation coefficients
 and its statistical significance was determined by F and P values. Effects of individual variable and interaction effects between different independent variables were also determined. Significance of each model parameter was determined based on significance level
  using F-test. Optimal process parameters for concentration of xylose and furfural were determined using Response Optimizer tool enabled in Minitab 17.1.0.
3. Results and Discussion
3.1. Compositional Analysis of Raw Material and Potential Concentrations
- Detailed composition of the rice straw used in this study is shown in Table 1. The main constituents of rice straw used in this study were in the same range as compared to other available information in literature [Mansilla et al., 1998; Ayse et al., 2013] for rice straw. The high pentose content (22.3%) of rice straw makes this wasteful material a highly useful substrate to produce wide variety of compounds or fuels by chemical or enzymatic processes.
3.2. Effect of Reaction Temperature, Reaction Time, Acid Concentration and Liquid Solid Ratio on Xylose Concentration
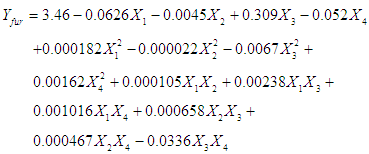
- The concentration of xylose in reaction media at different reaction conditions are given in Table 2. The fitted full quadratic model in terms of actual variables is represented by Eq. (3) for xylose
 concentration where
 are the reaction temperature, reaction time(min), acid concentration and Liquid solid ratio respectively.
 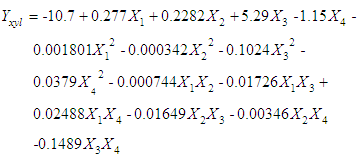 | (3) |
 reaction time
 and acid concentration
 has significant effect on concentration of xylose (P < 0.05). Liquid solid ratio
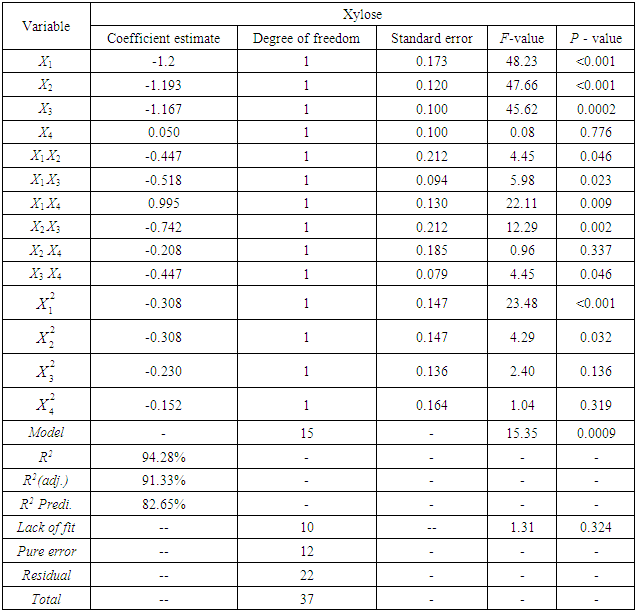
 has minor effect on xylose concentration (P > 0.05). The model presented a high value for the different regression coefficients (R2 = 94.28%, R2(adj.) = 91.33%, R2(pred.) = 82.65%) showing high significance of the model. For regression model of xylose concentration Eq.(3), F and P values were 15.35 and < 0.0001 respectively, which shows high significance of the regression model. Based on F and P values for lack of fit, it is shown that it is not significant. Interaction effect of different variables on xylose concentration is shown by response surfaces and contour plots (Fig.1). At lower acid concentration and lower reaction temperature, the concentration of xylose was high (Fig.1.a and 1.a1). With the increase in reaction temperature and acid concentration, xylose concentration also increased upto a maximum limit and after that it decreased due to degradation of xylose into furfural. High acid concentration (> 6%) and high reaction temperature (> 150°C) were unfavorable conditions for high xylose concentration. Similar observations were also reported for corn stover and soyabean hull for hydrolysis with phosphoric and sulphuric acid, respectively. At high liquid-solid ratio (10-14) and lower acid concentration (2-3%), the concentration of xylose was high (> 18 g/L). On decrease of liquid-solid ratio and increase of acid concentration, xylose concentration decreased as concentration of xylose was mostly affected by acid concentration (Fig. 1.b and 1.b1). Reaction temperature (80-105°C) and liquid-solid ratio (6-8) produced higher concentration of Xylose (> 18 g/L) (Fig.1.c and 1.c1). On further increase of liquid solid ratio (8-14) and reaction temperature (105-160°C), xylose concentration decreased (18-8 g/L). Lower reaction time (0-95 min.) and higher acid concentration (4-8%) favored higher xylose concentration (> 18 g/L) (Fig.1.d and 1.d1). At very high reaction temperatures (> 145°C) and higher acid concentration (7-8%), xylose concentration decreased due to decomposition into furfural. Similar results were also reported in other studies in literature [Wiboon et al., 2011; Ines et al., 2003]. For any fixed reaction time, increase in acid concentration resulted decrease in xylose concentration due to fast degradation of xylose into furfural at higher acid concentration. Xylose concentration decreased with increasing reaction temperature and time, which revealed that lower temperature (85-145°C) and short duration of reaction time (50-105 min.) was favorable for higher xylose concentration (> 18 g/L) (Fig. 1.e and 1.e1). Interaction effect of liquid-solid ratio and reaction time has minor effect on xylose concentration (Fig. 1.f and 1.f1). At low reaction time (0-75 min.) and liquid-solid ratio (8-14) gave higher xylose concentration (>18 g/L). At a fixed liquid solid ratio, increase in reaction time adversely decreased the concentration of xylose. Combining all the reaction conditions, maximum xylose concentration (approximately 19.5 g/L) occurred within a range of temperature 90-120°C, acid concentration 4-6% (w/v), reaction time 30-90 min., and liquid- solid ratio 6-10.
|
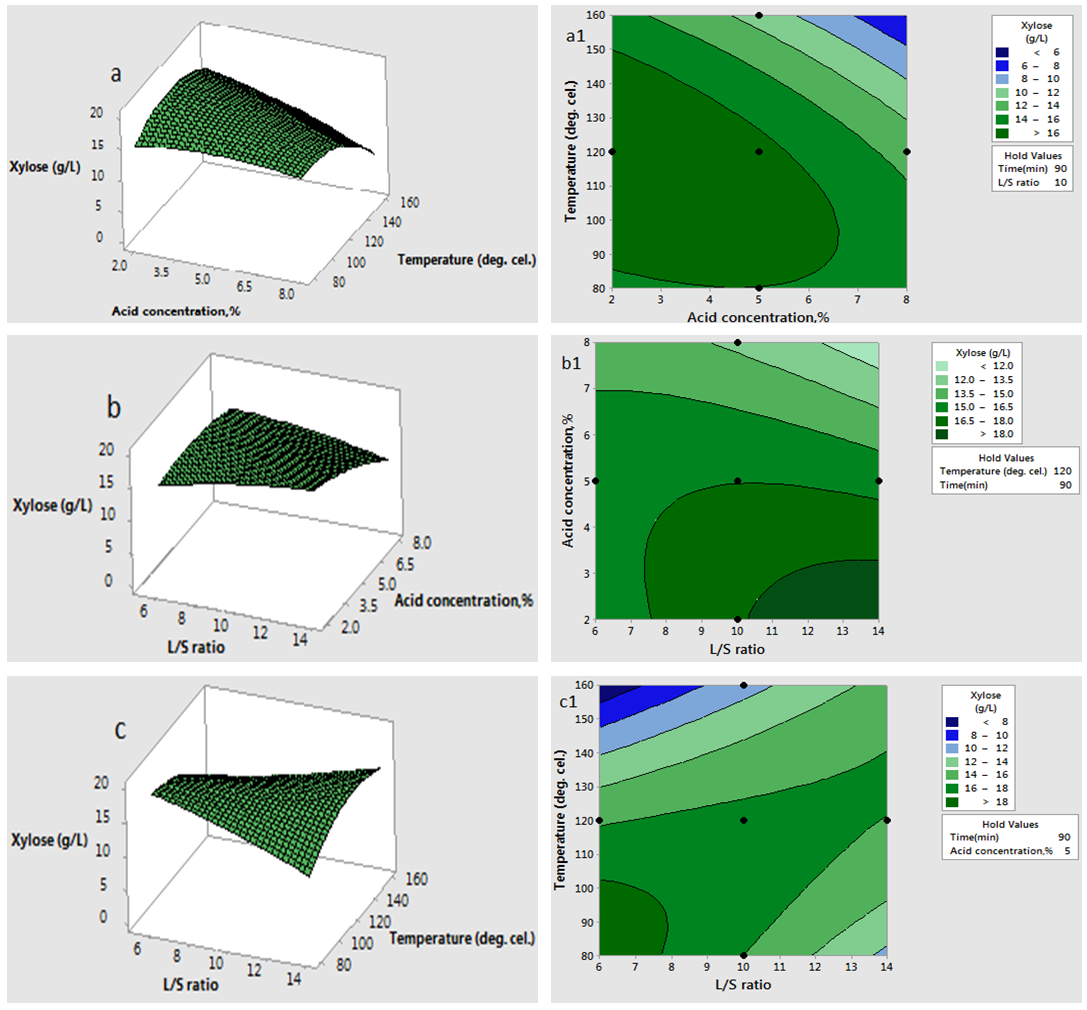 | Figure 1(a-c and a1-c1). Interaction effect of two independent variables on xylose concentration (when other variables fixed at the center point: 120°C, 90 min, 5 %( w/v), 10 (volume-mass)) |
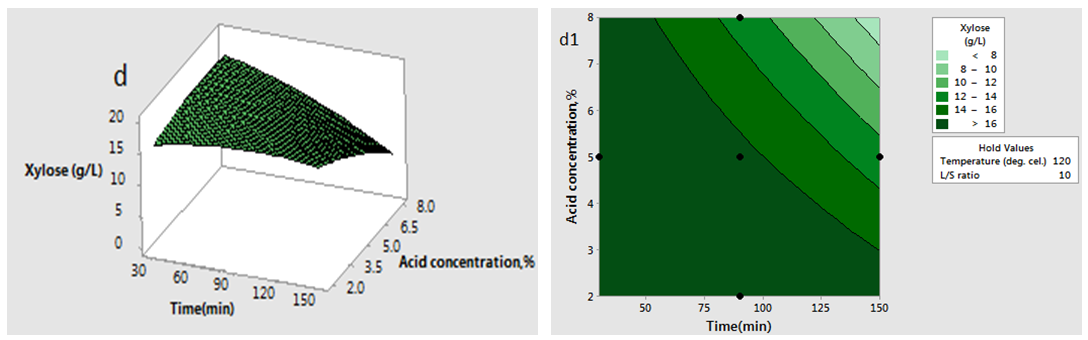 | Figure 1(d and d1). Interaction effect of two independent variables on xylose concentration (when other variables fixed at the center point: 120°C, 90 min, 5 %( w/v), 10(volume-mass)) |
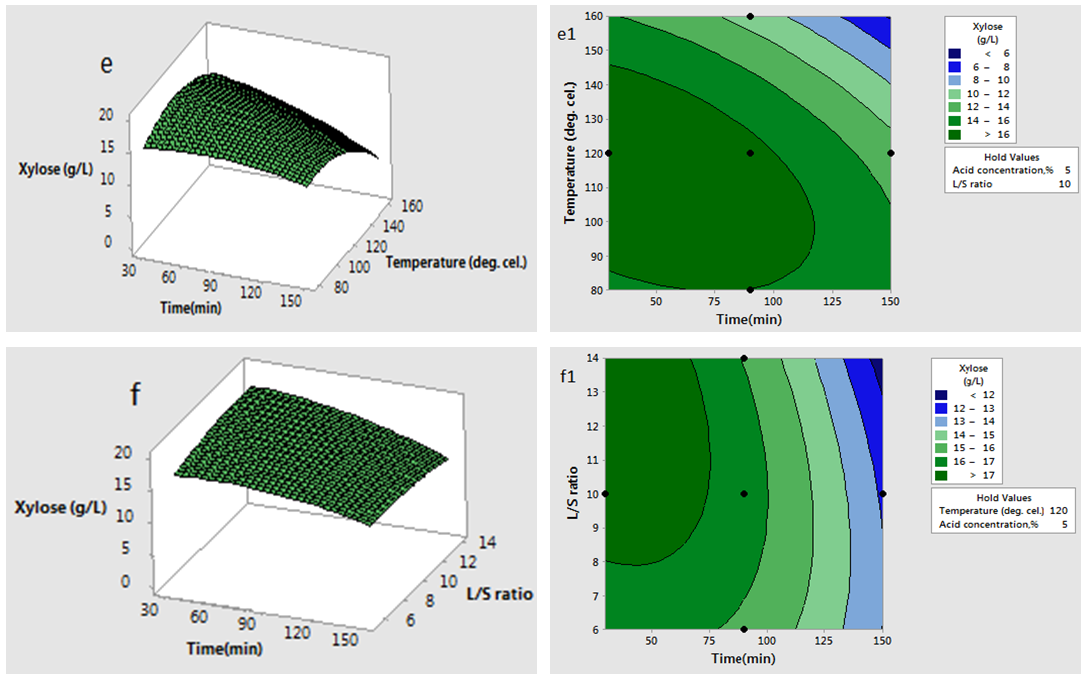 | Figure 1(e-f and e1-f1). Interaction effect of two independent variables on xylose concentration (when other variables fixed at the center point: 120°C, 90 min, 5 %( w/v), 10(volume-mass)) |
3.2.1. Optimization and Validation of the Model for Xylose
- Optimal reaction conditions were found by using Response Optimizer Tool enabled in Minitab 17.1.0. Analyzing reaction conditions and concentration of xylose by Response Optimizer, the optimal conditions for maximizing the concentration of xylose were obtained and shown in optimization plot Fig.1 (g). Maximum predicted yield of xylose was 21.3547 g/L with composite desirability 1.00. In order to confirm the optimized conditions and the suitability of model equation, experiments were carried out with optimized reaction variables as suggested by Response Optimizer. The mean value of xylose concentration as obtained from the actual experiments was 20.845 g/L (by triplicate experiments). It was in concurrence with the model predicted value of 21.35 g/L indicating that the model was adequate to describe hydrolysis process of rice straw.
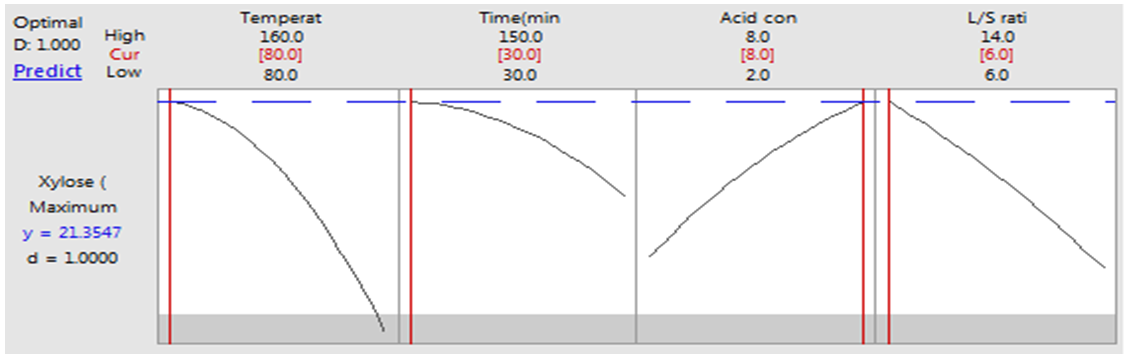 | Figure 1(g). Optimization plot for xylose |
3.3. Effect of Reaction Temperature, Reaction Time, Acid Concentration and Liquid Solid Ratio on Furfural Concentration
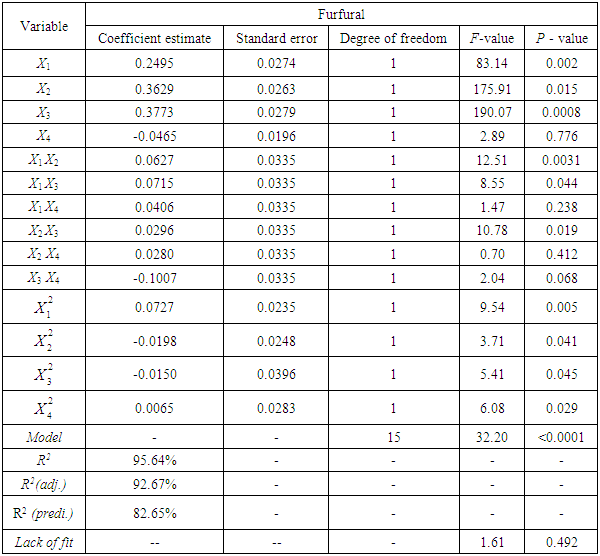
- The Concentration of furfural at different reaction conditions are given in Table 1. Analysis of response surface design for furfural resulted in a full quadratic model relating concentration of furfural at different reaction conditions as shown in Eq.(4).
 | (4) |
 , reaction time
 and acid concentration have significant effect on concentration of furfural (P<0.05). Liquid-solid ratio has minor affect on concentration of furfural concentration (P>0.05). Interaction terms of
  and quadratic terms of
 are significant (P <0.05), demonstrating that the reaction temperature, reaction time and acid concentration has very significant role on concentration of furfural. Response surfaces and contour plots of different combinations of independent variables are given in Fig.2 which shows interaction effects of two different variables on furfural concentration. As acid concentration (2-8%) and reaction temperature (80-160°C) increases, concentration of furfural increased (Fig. 2.k and 2.k1). The contour plot reveals that maximum furfural concentration (more than 3.8g/L) occurred within range of temperature 150-160°C and acid concentration 6-8%. At high acid concentration (6.5-8%) and low liquid-solid ratio (6-10 (volume-mass)), furfural concentration was more than 3g/L (Fig. 2.m and 2.m1). On higher liquid solid ratio (10-14 (volume-mass)) and lower acid concentration (2-5%), furfural concentration was low (1.5-2.0 g/L). Liquid-solid ratio and temperature response surface and contour plot (Fig. 2.n and 2.n1) shows that between these two parameters, furfural concentration mainly depended on reaction temperature. Interaction plot between temperature and liquid-solid ratio shows that liquid-solid ratio has minor effect on furfural concentration. Higher furfural concentration was achieved at higher reaction temperature (150-160°C). As the reaction time (0-150 min.) and acid concentration (2-8%) increased, furfural concentration increased (0.5-3.0 g/L) (Fig. 2.p and 2.p1). In case of time and temperature interaction, temperature was more effective (Fig. 2.r and 2.r1). At higher reaction time (150-160 min.) and reaction temperature (150-160°C), furfural concentration was high (>3.5 g/L). Time and liquid-solid ratio contour plot shows that furfural yield was mainly dependent on reaction time and liquid solid ratio has very minimal effect (Fig. 2.s and 2.s1). At higher reaction time (150-160 min.) and liquid-solid ratio (13-14(volume-mass)), furfural concentration was high (>3.5 g/L).
|
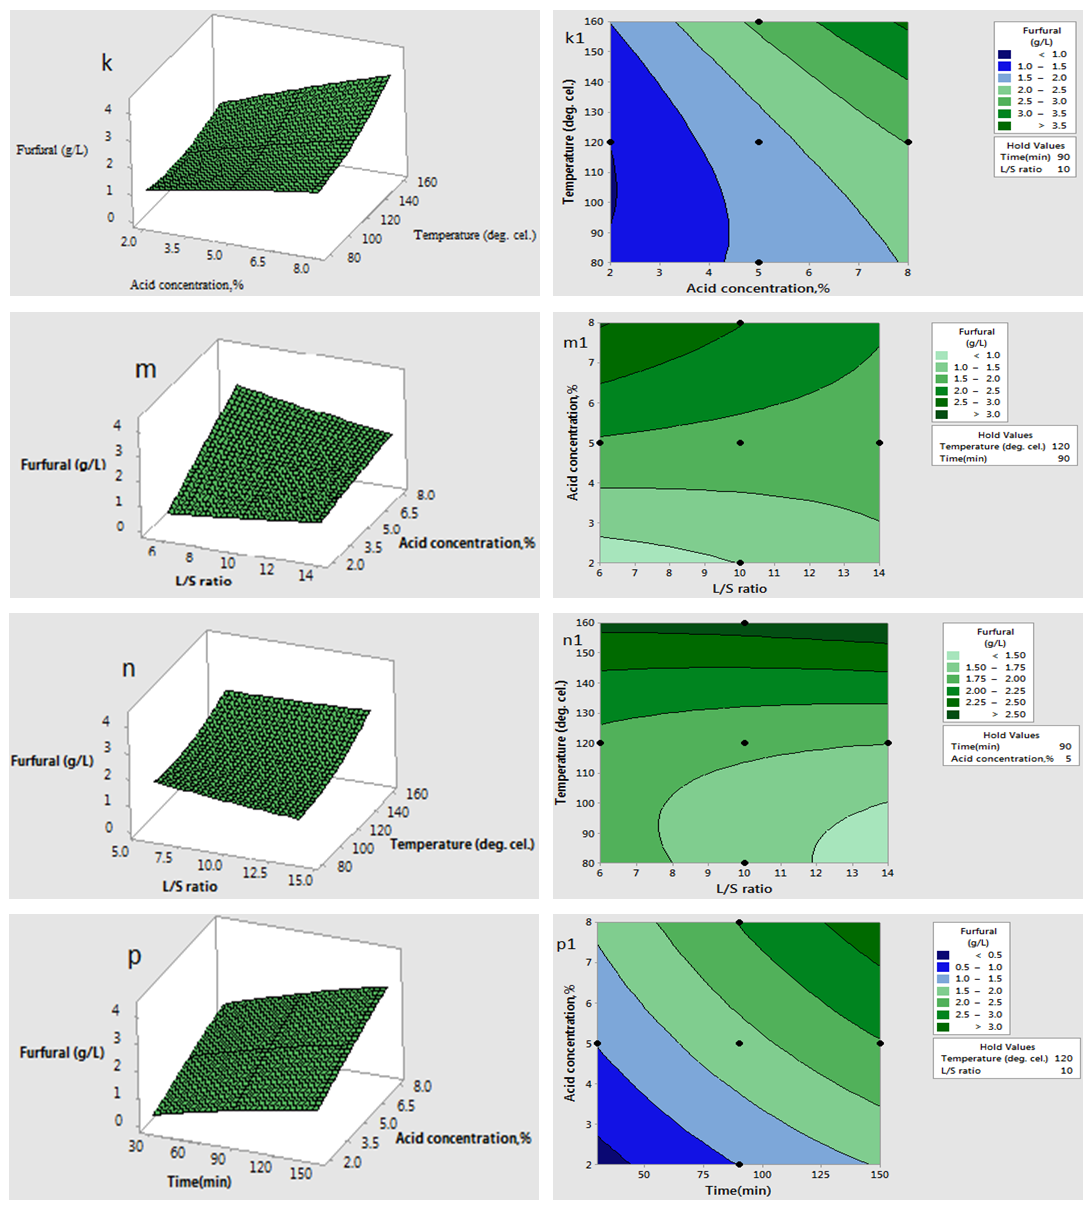 | Figure 2(k-p& k1-p1). Interaction effect of two independent variables on furfural concentration (when other variables fixed at the center point: 120°C, 90 min, 5% (w/v), 10(volume-mass)) |
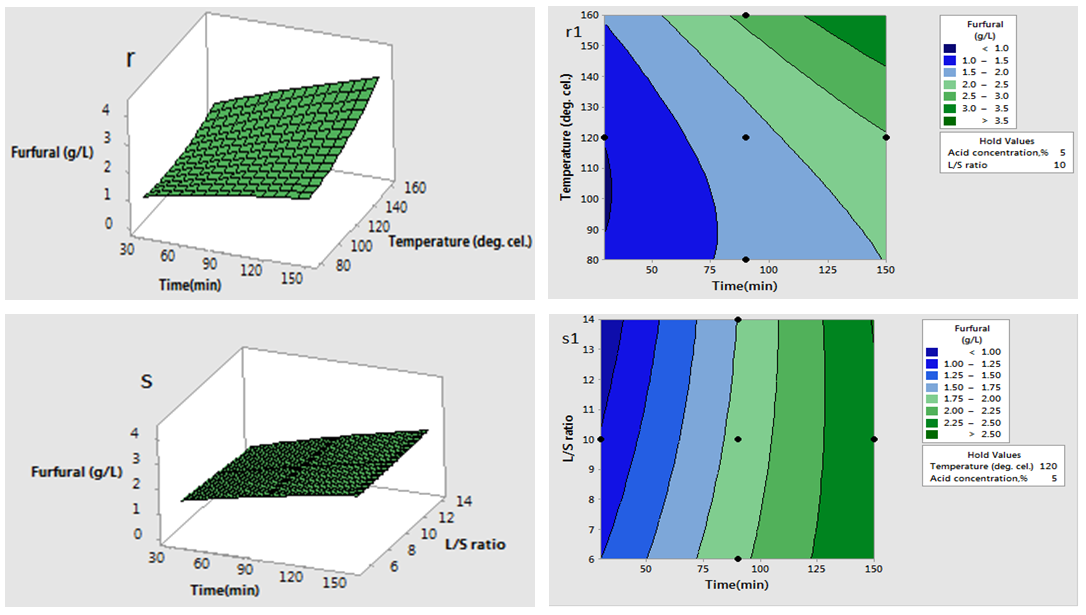 | Figure 2(r-s and r1-s1). Interaction effect of two independent variable on furfural concentration (when other variables fixed at the center point: 120°C, 90 min, 5 %(w/v), 10(volume-mass)) |
3.3.1. Optimization and Validation
- Optimization of process parameters to attain maximum concentration of furfural could be done by Response Tool Optimizer enabled in MINITAB 17.1.0. Fig.2 (l) shows the optimal process conditions to produce maximum furfural under given range of conditions. The optimization plot also shows the effect of different variables on concentration of furfural. The optimum conditions for maximizing furfural yield as calculated by Response Optimizer Tool, were reaction temperature 160°C, reaction time 150 min, phosphoric acid concentration 8% (w/v) and liquid-solid ratio of 6 (volume-mass). The maximum value for furfural concentration was estimated as 4.85 g/L at these optimal conditions. Three replicates of batch experiments were performed under these optimal conditions. The average values for furfural concentration was 4.21 g/L from experimental run of under optimal conditions. This value is not significantly different from the predicted value (4.85 g/L).
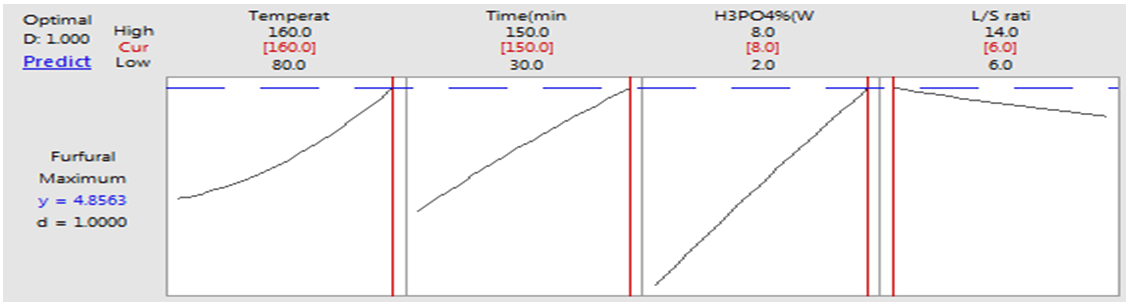 | Figure 2(l). Optimization plot for furfural |
4. Conclusions
- Phosphoric acid hydrolysis of rice straw was carried out to produce xylose and furfural. Process parameters optimized for maximum concentration of xylose and furfural. Reaction temperature, reaction time and acid concentration are main variables affecting xylose and furfural concentration. Liquid-solid ratio has very minor effect on concentration of xylose and furfural. The optimized conditions for xylose production were: reaction temperature 80°C, reaction time 30 min., acid concentration 8% (w/v) and liquid solid ratio of 6.0. At these optimized conditions predicted yield for xylose was 21.35 g/L. The optimized reaction conditions for furfural production were: reaction temperature 160°C, reaction time 150 min., acid concentration 8% (w/v) and liquid-solid ratio of 6.0 (volume-mass). At these optimized conditions predicted yield of furfural was 4.85g/L.
ACKNOWLEDGEMENTS
- The authors are grateful to Indian Institute of technology, Roorkee (India) for the financial support of this work.
References
| [1] | Anita, S., and Narsi, R. B., 2012, Optimization of enzymatic hydrolysis of pretreated rice straw and ethanol production. J. Bioenergy and Biofuels, 93, 1785-1793. |
| [2] | Antonio, R.C., Ramirez, J. A., Garrote, G., and Vazquez, M., 2004, Hydrolysis of sugar cane bagasse using nitric acid: a kinetic assessment. J. food engineering, 61,143-152. |
| [3] | Ayse, A., Badal, C. S.; Bruce, S. D., Gregory, J. K., and Michel, A. C., 2013, Response surface optimization of corn stover pretreatment using dilute phosphoric acid for enzymatic hydrolysis and ethanol production. J. Bioresource Technology, 130, 603-612. |
| [4] | Cassales, A., Priscila, B. D., Rosane, R., and Maro Antonio, Z. A., 2011, Optimization of soyabean hull acid hydrolysis and its characterization as a potential substrate for bioprocessing. J. Biomass & Bioenergy, 35, 4675-4683. |
| [5] | Esther, G.R., Oscar, M. P., Lorezo, J.E., Jose, A. R., and Manuel, V., 2012, Acid hydrolysis of wheat straw: a kinetic study. J. Biomass & Bioenergy, 36, 346-355. |
| [6] | Hisham, S. B., Yahia, A. A., and Muhammad, A., D., 2013, Furfural from midrib of date-palm trees by sulphuric acid hydrolysis. J. Industrial crops and products, 42, 421-428. |
| [7] | Ines, C. R., Solange, I., Mussatto, R., Rodrigues, C.L. B., 2003, Dilute acid hydrolysis for optimization of xylose recovery from rice straw in semi-pilot reactor. J. Industrial crops & products, 17,171-176. |
| [8] | Karimi, K., Kheradmandinia, S., and Taherzadeh, M. J., 2006, Conversion of rice straw to sugars by dilute-acid hydrolysis. J. Biomass & Bioenergy, 30,247-253. |
| [9] | Lavarack, B.P., Griffin, G.J., Rodman, D., 2002, The acid hydrolysis of sugarcane bagasse hemicelluloses to produce xylose, arabinose, glucose and other products.J. Biomass and bioenergy, 23,367-380. |
| [10] | Mansilla, H. D., Baeza, J., Urzua S., and Maturana, G., 1998, Acid –Catalysed Hydrolysis of Rice Hull: Evaluation of Furfural Production. J. Bioresource Technology, 66,189-193. |
| [11] | Puentes, J. J., Mateo, S., Bruno, G.F., Ines, C. R., and Alberto, J. M., 2013, Monomeric carbohydrates production from olive tree pruning biomass: Modeling of dilute acid hydrolysis. J. Bioresource Technology, 149,149-154. |
| [12] | Seoung, C. B., and Kwon, Y.J., 2007, Optimization of the pre treatment of rice straw hemicellulosic hydrolysates for Microbial Production of Xylitol. J. Biotechnology and Bioprocess Engineering, 12,404-409. |
| [13] | T 203 cmm-99 “Alpha-, beta- and gamma-cellulose in pulp”. TAPPI test method issued on 21.11.1999. |
| [14] | Tellez-Luis, J., Ramirez, J.A., and Vazquez, M., 2002, Mathematical modeling of hemicellulosic sugar production from sorghum straw. J. food engineering, 52,285-291. |
| [15] | Ting-Hiang, L.; Chiung-Fang, H., Gia-Luen, G., Wen-Song, H., and Huang, L., 2012, Pilot –scale ethanol production from rice-straw hydrolysates using xylose fermenting Pichia stipits. J. Bioreource Technology, 116,314-319. |
| [16] | Valkanas, G.N., Valkana, N.P., Vlyssides, A.G., and Theodoropoulos, A.G., 1998, Method for production of ethyl alcohol. United states Patent, 5766895. |
| [17] | Wiboon, R. N., and Poonuk, P., 2011, Optimization of furfural production from hemicellulose extract from delignified palm pressed fibre using a two-stage process. J. Carbohydrate Research, 346,103-110. |