M. Tientcheu-Nsiewe1, D. Tcheukam–Toko2, F. Murzyn3, A. Mehel3, B. Patte-Rouland4
1Department of Electrical, Energy, and Automatic System Engineering, ENSAI-University of Ngaoundere, Cameroun
2Department of Energy Engineering, IUT-University of Ngaoundere, Cameroun
3CERIE –ESTACA Parc Universitaire Laval-Changé, Rue Georges Charpak, Laval, France
4CORIA UMR 6614 CNRS - University of Rouen, Saint-Etienne du Rouvray, France
Correspondence to: M. Tientcheu-Nsiewe, Department of Electrical, Energy, and Automatic System Engineering, ENSAI-University of Ngaoundere, Cameroun.
| Email: |  |
Copyright © 2016 Scientific & Academic Publishing. All Rights Reserved.
This work is licensed under the Creative Commons Attribution International License (CC BY).
http://creativecommons.org/licenses/by/4.0/

Abstract
Numerical analysis was performed for a turbulent flow around an Ahmed body. Special attention has been paid for the friction effect inside the near-wake of Ahmed body’s back, and for the interaction between the vortex structures and the Ahmed body’s rear window. A strong vortex structure in the near-wake could have a large significance on the atmospheric prediction, even on the power of a car. The turbulent model has been applied a standard κ-ε two equations model and the two-dimensional Reynolds Averaged Navier–Stokes (RANS) equations, are discredited with the second order upwind scheme. The SIMPLE algorithm, which is developed using control volumes, is adopted as the numerical procedure. Calculations were performed for a wide variation of flow velocities and different slopes of Ahmed body’s rear window. The results reveal that with increasing of flow velocity and rear window’s slope, the vortex structure change from 2D to 3D. Comparison of numerical results with the experimental data available in the literature is satisfactory.
Keywords:
Ahmed body, Wake, Velocity field, Turbulent flow, CFD
Cite this paper: M. Tientcheu-Nsiewe, D. Tcheukam–Toko, F. Murzyn, A. Mehel, B. Patte-Rouland, Numerical Study of a Turbulent Flow in the Near-Wake of an Ahmed Body, American Journal of Environmental Engineering, Vol. 6 No. 6, 2016, pp. 157-163. doi: 10.5923/j.ajee.20160606.01.
1. Introduction
During the 21 meeting of the intergovernmental panel on climate change, a growing observer indicates that the planet is heated. During the 20th century, the temperature on the surface of the ground increased approximately by 0.85. The snow-covered and the glacial extents were reduced approximately by 10% and the total mean level of the sea rose several tens of centimeters [1]. The main cause of these problems is the air pollution. It is responsible of the death of 2.4 million people in the world each year according to WHO (2006). Adverse health effects such as bronchitis, asthma [2], lung cancer [3], cardiovascular disease [4], and mutations [5] are associated with respirable particles emitted from vehicles. Ultrafine particles (defined as Dpp100 nm) can deposit with high efficiency in the smallest vessels of the lungs. One major source of these ultrafine particles is vehicles. The origins of these emissions are varied: industrial, transport, agricultural, waste processing and natural emissions.With the increase of world Automobile Park, the origin of automobile pollution becomes more and more extensive. In Europe, the contribution of the transport sector in the air pollution is 26% according to European Automobile Manufacture’s Association. Moreover, the sector is tributary of the petroleum products for more than 95% of its energy needs. According to [6], the road transport sector accounts for approximately 80% of the goods traffic and 90% of the traffic of passengers in Africa. The total cost of the air pollution in some African’s countries represents nearly 2% of the GDP. The principal fields of research relate to the power units, aerodynamics, the energy effectiveness of the components of the vehicle, or clean energies.Ahmed S., (1981) performed a series of wind-tunnel experiments in order to examine the wake structure around typical automobile geometries. The study focused on the time averaged structure obtained from visualizations of flow in the wake region for smooth quarter scale automobile models. Experiments were also performed with a bluff-body, “generic” vehicle geometry where pressure measurements, wake surveys and force measurements for different angles of base-slant were presented. Results indicated that almost 85% of total aerodynamic resistance is contributed by pressure drag and most of this drag is generated at the rear end. The impact of the aerodynamic drags on the power consumption, and consequently on the emissions of CO2 and gas for purpose of greenhouse, is then considerable.Author’s [7, 8] identified three flow areas varying according to the slant angle α of the rear window. Below the first critical angle (αm < 12°), the airflow over the angled section of the back end remains fully attached. The shear layer rolls up at the top and bottom edges of the vertical base to form two recirculatory regions. Between the two critical angles (12° < α < 30°), the flow over the angled section becomes highly three dimensional. The two counter-rotating longitudinal vortices shed from the sides of the angled back section are larger than those formed below the 1st critical angle. For all back angles above this 2nd critical angle (α > 30), the flow over the angled section is fully separated. Again, two recirculatory regions are formed over the back end. Others authors [9] show that generally, a detachment appears to 8% of the length L on the front part of Ahmed body. On both sides longitudinal plane of symmetry, the threads current lines to the wall wrap around two homes and escape from the wall forming two vortices counter-rotating. According to [10, 11], these vortical structures are advected along the pavilion to wake zone. The complexity of the flow then holds the coexistence of transverse vortices on the rear window and at the bottom, and longitudinal vortices which develop on the side edges of the rear window. [10, 12-15], let show that, the upstream flow and the wake structure have a major responsibility in determining for drag model. This is based on determining of the equations drag and the turbulence model used. In most of the digital calculation, they use the two-equation model as discretization with finite volume method.The greatest interest is related to the control of detachment, with the works of [16-19], which proposes a numerical data base on control and the analysis of the wakes of thick body by aspiration or continuous blowing in order to provide several quantitative information on the flow which develops on a geometry of right cheek or inclined. More particularly in upstream of the separation line, on the rear window (separated zone) and in the wake.We observed that these different studies presented a lack like to consider the upstream flow as purely laminar, which justifies the necessity to study the influence of the upstream turbulence inside the dynamic of downstream flow of a vehicle and on the drag. This present work consists in doing a numerical study of velocity field of a turbulent flow in the near-wake of an Ahmed Body. This study would help to well understand the effects of velocity fields on the pollutants dispersion. To lead well this study, we are going to present the mathematical formulation and the computation procedure employed. These methods have permitted to calculate, the velocity fields around and in the near-wake of the Ahmed Body, and the characterization of the circulation zone, by using a model of bi-dimensional turbulence, isotropic, stationary and unsteady k-ε model.
2. Mathematical Formulation and Computation Procedure
2.1. Assumption of Calculation Domain
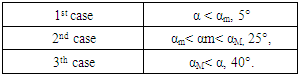
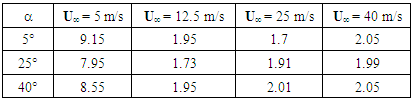
The geometry used for 2D numerical simulation in the air is the Ahmed body (scale 1/50). The lower part is base and is positioned at a height h = 4mm from the digital wind tunnel floor. The length L and the height H of the geometry are 80mm and 22mm respectively. Three devices have been studied with different angles of α rear window show in table 1 below.Table 1. Slack angle proposed by [20]
 |
| |
|
These angles in table 1 represent the various flow structures defined by [7]. The geometry of the Ahmed body is shown in figure-1. The slant angle is adjustable and is the main variable model-parameter in the experimental investigations. The Ahmed body was placed at 4mm from the ground. The reference axis (X and Y) is linked to the model. The origins of these axis lies at the point O located on the floor of the ground of the numerical wind tunnel, on the base of the model. The dimension of wind tunnel is 30L and 10H. These dimensions are recommended on Refined Turbulence Modeling by [21]. The uniform pression in the outlet area is P0 = 101325 Pa.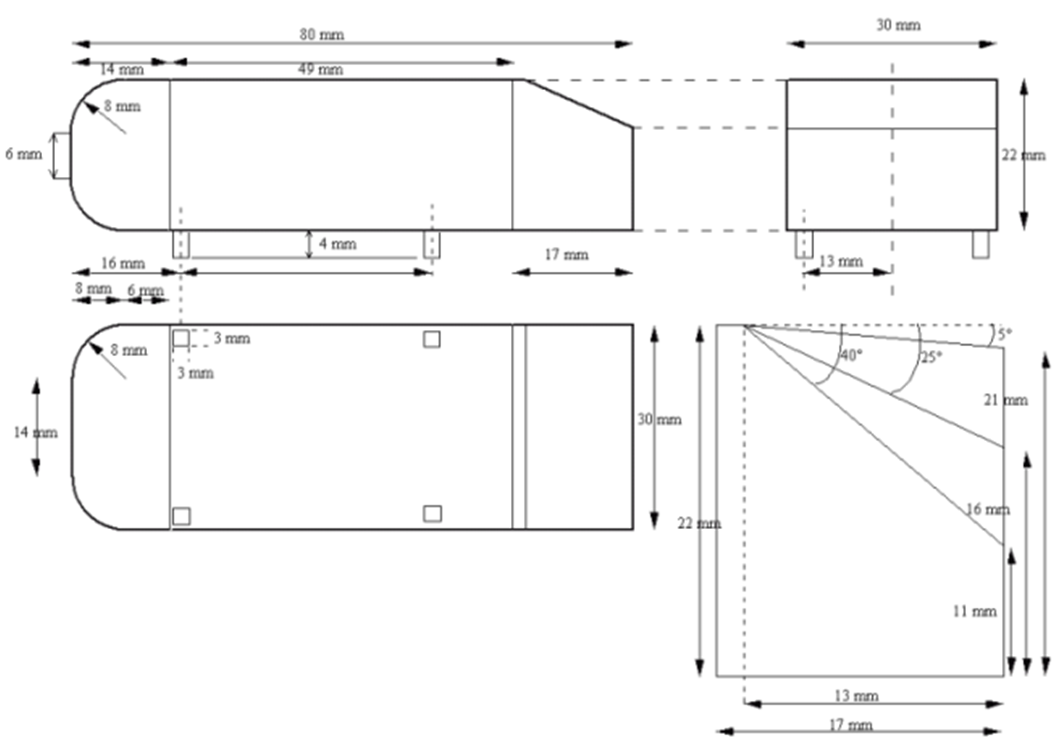 | Figure 1. Ahmed Body geometry used [20] |
The flow is advected from the left to the right and the fluid is initialized to the speed V0. Finally, a frictionless wall condition is imposed at the floor of the wind tunnel and on geometry.
2.2. Governing Equation
The Reynolds Averaged Navier-Stokes (RANS) equations solved by fluent are presented there. The RANS approach of permitting a solution for the mean flow variables greatly reduces the computational effort. If the mean flow is steady, the governing equations will not contain time derivatives and a steady-state solution can be obtained economical.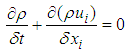 | (1) |
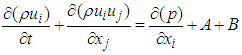 | (2) |
Here,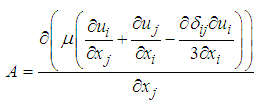 | (3) |
and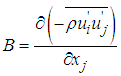 | (4) |
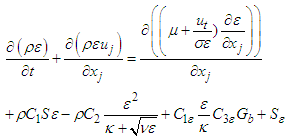
This approach is generally adopted for all practical engineering calculations, and is used with Realizable k- Ɛ Turbulence Model: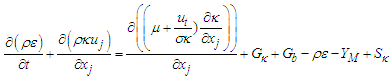 | (5) |
 | (6) |
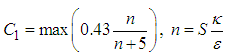 | (7) |
 | (8) |
Here, Gk and Gb are generation of turbulent  due to mean velocity gradients and buoyancy respectively. YM is represents the contribution of the fluctuating dilatation in compressible turbulence to the overall dissipation rate. Sk and
  are user-defined source terms for
  and k respectively. Where, Cμ, C1Ɛ, and C2Ɛ, are empirical constants;
  and
and  are respectively the turbulent Prandtl numbers relative to Ɛ and k. The values of these constants proposed by [22], are represented on table 2 bellow.
Table 2. Empirical constants
 |
| |
|
3. Results Discussion
3.1. Generating Mesh Geometry
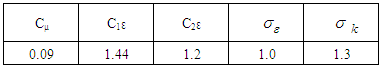
The figure 2 below represents the computational domain.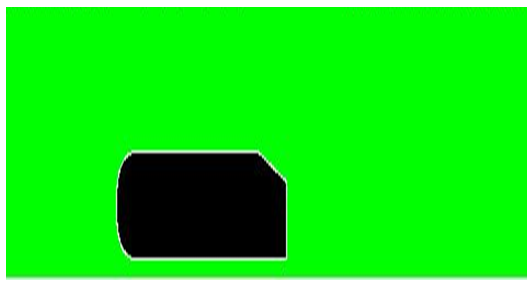 | Figure 2. Grid configuration |
The grid distribution is a set of quadrilateral cells (uniformly structured mesh). The mesh is very uniformly fine near of the wall and around the Ahmed Body, where the velocity gradient is large. The grid distribution impacts the computation time and the number of iterations required for the solution converge. The choice of the mesh size of 150,000 cells is a good compromise and the results that will be presented later are those of this mesh size. The numerical solution around the Ahmed body obtained can be found in literature papers presenting different methods of numerical simulation other than RANS, which is used in this paper. Boundary conditions are the following uniform velocity at inlet, uniform pressure outlet, symmetry at ceiling and wall at floor.
3.2. Velocity Fields
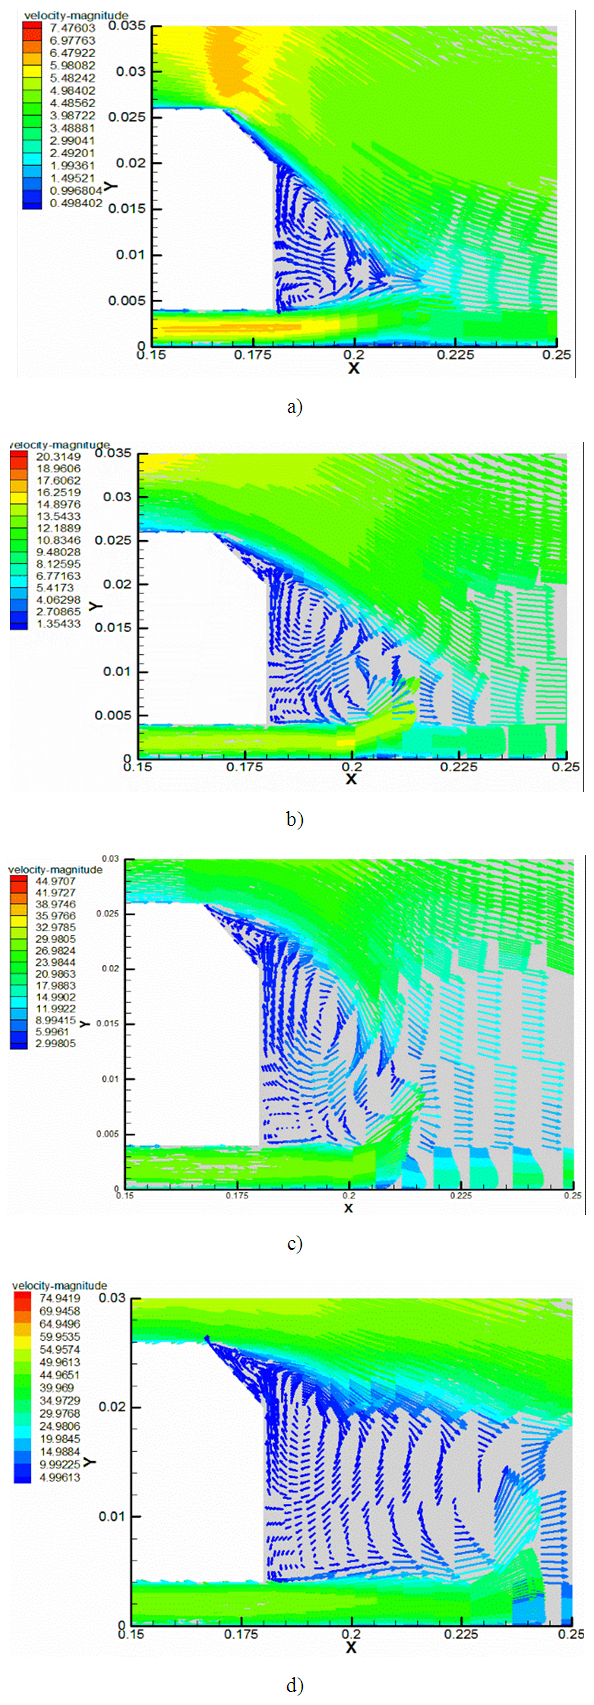
The figure 3 to 5 below represents the velocity fields around the Ahmed Body for different slack angle and flow velocities. We observe for different slack angles, the recirculation zones at the upstream of flow described by [7]. The velocity of these zones varied from 1.5U∞ to 2U∞.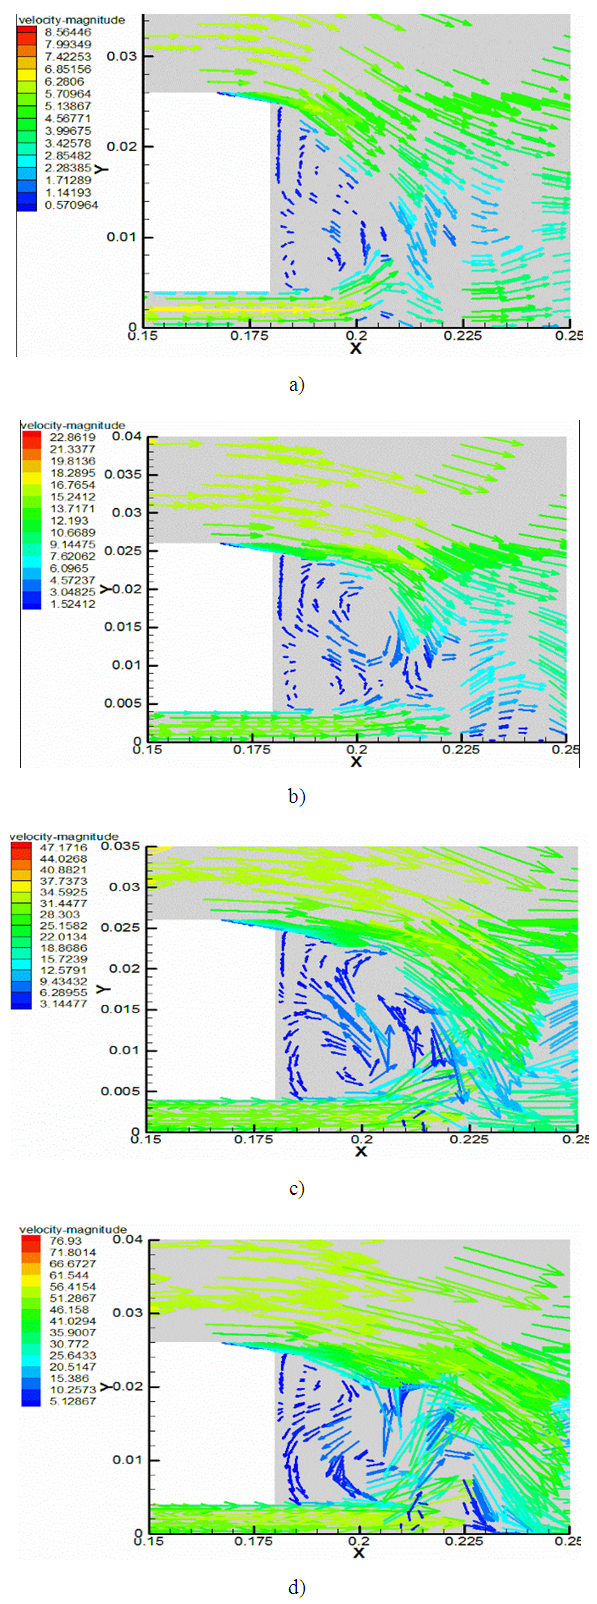 | Figure 3. Case 1: Velocity fields for Ahmed Body slack angle α = 5. a) U∞ = 5 m/s, b) U∞ = 12.5 m/s, c) U∞ = 25 m/s, d) U∞ = 40 m/s |
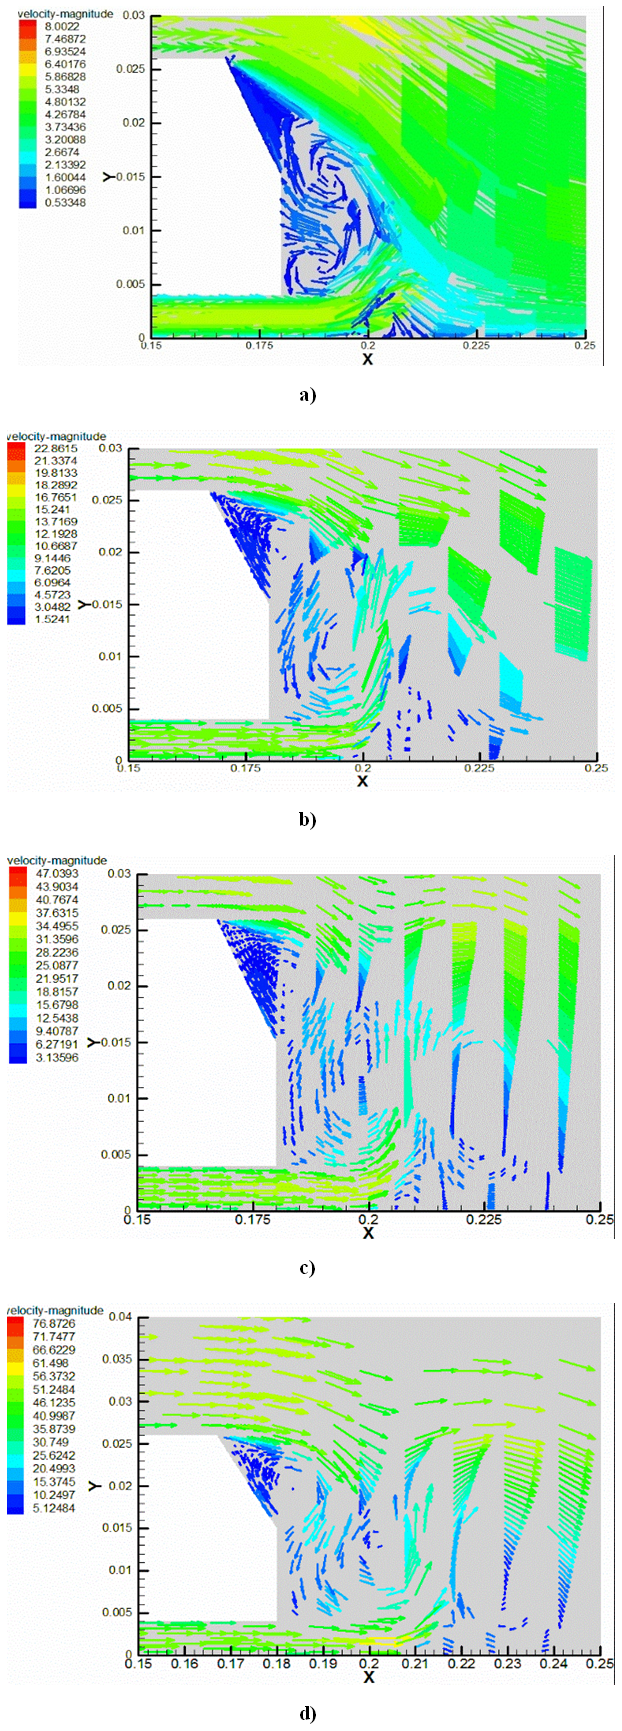
 | Figure 4. Case 2: Velocity fields for Ahmed Body slack angle α = 25: a) U∞ = 5 m/s, b) U∞ = 12.5 m/s, c) U∞ = 25 m/s, d) U∞ = 40 m/s |
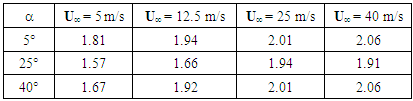
 | Figure 5. Case 3: Velocity fields for Ahmed Body slack angle α = 40: a) U∞ = 5 m/s, b) U∞ = 12.5 m/s, c) U∞ = 25 m/s, d) U∞ = 40 m/s |
Table 3. Maximal velocity (Umax) for instationary flow
 |
| |
|
Table 4. Maximal velocity (Umax) for stationary flow
 |
| |
|
The volume of the takeoff zone varies function to the rate of the flow. It is more prolonged upstream of the Ahmed body and less intense for 5 m/s and 40 m/s speeds. And more prolonged to the top and less intense for 12.5m/s and 25 m/s for the various slopes.The figure 3 above represented the case 1 showed in table 1. In this case, the instationary flow skirts the rear window and takes off on the bottom level. We observe two recirculation zones on the right bottom level with a very low speed values. The higher vortex turning in the watch direction reduced with the speed increase, decreases. The boundary line is extended between 56% and 72% of the height. The lower vortex on the other hand, turns in the trigonometrical direction.To the figure 4, a detachment appears on the rear window with maximum speed amplitudes on 25 m/s and 40 m/s, before stick back on the right bottom. On the right bottom level, the vortices are separate in the center of this one.In figure 5, the detach zone of the rear window is amplified to the upper side of the bottom. The upper vortex is reduces, and the low vortex goes up to the slope edge. The high amplitude of this vortex is certainly causes by detachment creating by the ground which appears in 30 mm in front of the Ahmed body.The separation phenomenon is intrinsically related to the boundary layer developing along the body, where the velocity gradients and viscous effects are important beyond 30mm or even 50mm. The speeds close to the wall then become zero then reverse, and the boundary layer separates from the body surface. Away from the body, the velocity profile is characterized by a negative vector velocity zone and positive, before increasing sharply to reach higher speeds to U∞. Thereafter it changes linearly to the input speed of the fluid in the vein. These changes do indeed show the existence of a dynamic boundary layer between the wake zone and the flow away from the wall. This reduction in velocity in the wake zone, characterized the counter rotating vortices which are developed in this part of the enclosure.
3.3. Comparison of Results
Figure 6 below present the fields of the average vectors speed for different angles at the speed U∞ = 12.5m/s. There is a similarity with the experimental work presented by [20]. The present study shows that the vector field speed is the same as the one in experimental results. This result is satisfactory for a calculation completely in bidimension, unlike the experimental result that comes from the three-dimensional geometry.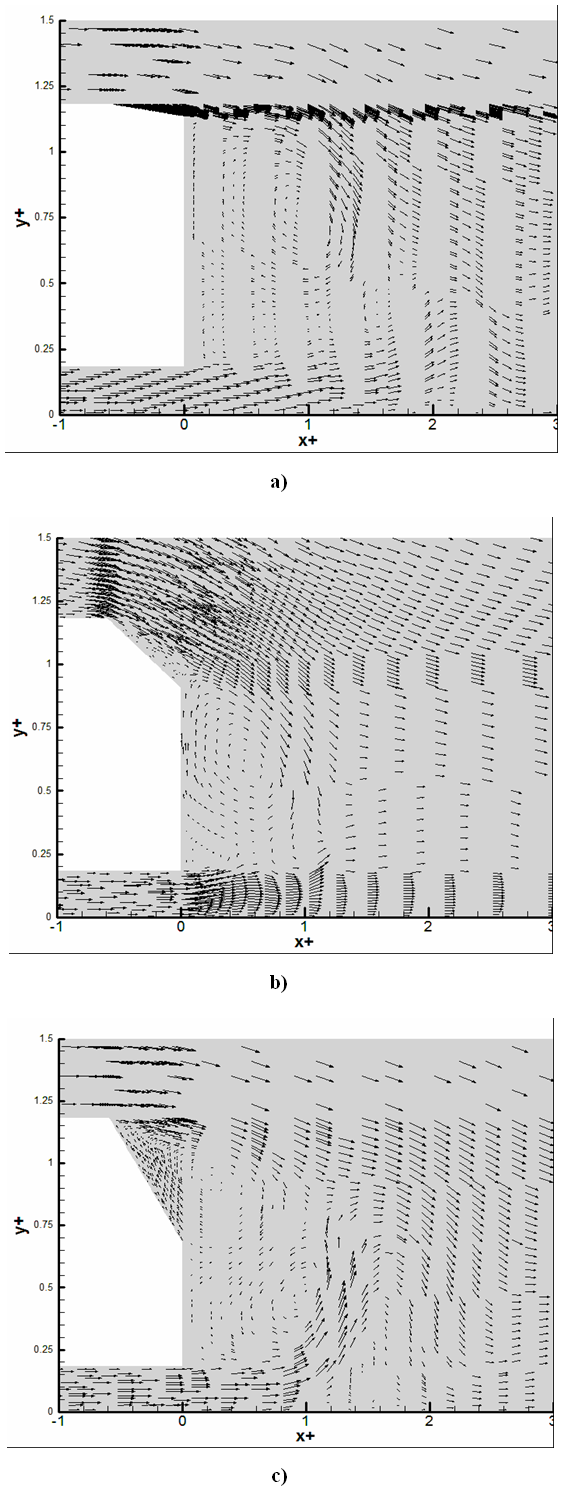 | Figure 6. Means velocity vectors fields for U∞ = 12.5 m/s: (a) α = 5°; (b) α = 25°; (c) α = 40° |
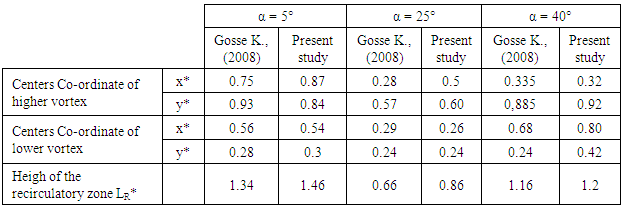
The table 5 below present the characteristics of the recirculation zone (reference points at the center of the vortex), compared to the [20] study results. There is a difference of about 15% probable due to the parietal effects not taken into account in the numerical calculation.Table 5. Characteristics of the recirculation zone compares to experimental of [20])
 |
| |
|
4. Conclusions
This paper deals with a numerical study of a turbulent flow in the near-wake of an Ahmed Body with three slack angles (5°, 25° and 40°) and four speeds (5 m/s, 12.5 m/s, 25 m/s and 40 m/s), to more understand consumption and the gas emissions to greenhouse effect of the future motor vehicles in all situation presented by Ahmed [7]. We have presented the velocity field showing the separate zone and the zones of recirculation for different slack angles of Ahmed Body. We observe that, in the near wake of Ahmed Body, the velocity in the recirculation zones varied from 1.5U∞ to 2U∞. The separation phenomenon in the near wake is intrinsically related to the boundary layer developing along the body, where the velocity gradients and viscous effects are important beyond 30mm or even 50mm. we could characterize the central vortex in near wake of Ahmed Body, and compare them with the literature. Our results show a good agreement with the literature review.
References
| [1] | Groupe d'experts Intergouvernemental sur l'Evolution du Climat (GIEC) (2001). "Bilan 2001 des changements climatiques: Les éléments scientifiques", 3ème rapport d'évaluation 2001, http://www.grida.no/climate/ipcc_tar/vol4/french/pdf/wg1sum.pdf. |
| [2] | Peters A. Wichmann H. Tuch T. Heinrich J. Heyder, J. (1997). Respiratory effects are associated with the number of ultrafine particles. American Journal of Respiratory and Critical Care Medicine 155, 1376–1383. |
| [3] | Pope C.A. (2000). What do epidemiologic findings tell us about heath effects of environmental aerosols? Journal of Aerosol Medicine 1314, 335–354. |
| [4] | Peters A. Dockery D. Muller J. Mittleman M. (2001). Increased particulate air pollution and the triggering of myocardinal infarction. Circulation 103, 2810–2815. |
| [5] | Somers C. McCarry B. Malek F. Quinn J. (2004). Science 304, 1008–1010. |
| [6] | CEA-NU (2009). Rapport d’examen africain sur les transports. Le secteur des transports en Afrique: importance, évolution et problèmes naissants. [Report]. - [s.l.]: Commission économique des nations unis pour l’Afrique, 2009. |
| [7] | Ahmed S. Ramm R. & Falting G. (1984). Some salient features of the time averaged ground vehicle wake. SAE technical paper series 840300. Detroit, 1984. |
| [8] | Chometon F. & Gilliéron P. (1996): Modélisation des écoulements tridimensionnels décollés autour des véhicules automobiles. Congrès SIA, Société des Ingénieurs de l'Automobile, n° SIA 96-09-11, Courbevoie / Paris. |
| [9] | Spohn A. & Gilliéron P. (2002). Flow Separations Generated by a Simplified Geometry of an Automotive Vehicle: Congrès IUTAM Symposium on Unsteady Separated Flows,. - April 8-12, Toulouse, France, 2002. |
| [10] | Lienhart H. Stoots C. & Becker S. (2002). Flow and turbulence structures in the wake of a simplified Car Model (Ahmed Model): roc. DGLR Fach. Symp. Der AG STAB. - Stuttgart Univ. |
| [11] | Krajnovic S. & Davidson L. (2004). "Contribution Large-Eddy Simulation of the Flow around a Simplified Car Model", SAE International Congress & Exposition. - Detroit, Michigan 2004, - Vols. N°2004-. |
| [12] | Guilmineau E. (2008). Computational study of flow around a simplified car body. Journal of Wind Engineering and Industrial Aerodynamics 96 (2008) 1207–1217. |
| [13] | Chauhan B. & Thundil R. (2012). Numerical Investigation of External Flow around the Ahmed Reference Body Using Computational Fluid Dynamics. Research Journal of Recent Sciences Vol. 1(9), 1-5, September (2012) ISSN 2277-2502. |
| [14] | Alonso-Estébanez A. Pascual-Muñoz P. Yagüe C. Laina R. Castro-Fresno D. (2012). Field experimental study of traffic-induced turbulence on highways. Atmospheric Environment 61 (2012) 189 – 196. |
| [15] | Deepak K. & Paul A. (2013). Computational Study of Flow around a Simplified 2D Ahmed Body. International Journal of Engineering Science and Innovative Technology (IJESIT) Vol 2, Issue 3, ISSN: 2319-5967, May 2013. |
| [16] | Roumeas M. (2006). Contribution à l’Analyse et au Contrôle des Sillages de Corps Epais par Aspiration et Soufflage Continu, thése de doctorat / Institut National Polytechnique de Toulouse. - p. 235. – 2348. |
| [17] | Kourta A. & Gilliéron P. (2009). Impact of the Automotive Aerodynamic Control on the Economic Issues, Journal of Applied Fluid Mechanics, pp. 69-75, 2009, Vol. 2, No. 2, ISSN 1735-3645. |
| [18] | Aider J. Lasserre J. Beaudoin J. Herbert V. & Wesfreid J. (2009). Contrôle d’écoulement en Aérodynamique automobile. 19ème Congrès Français de Mécanique Marseille. 24-28 août 2009. |
| [19] | Pierric J. (2012). Application du contrôle par jet pulse a un corps non profile, thèse de doctorat / Université Pierre et Marie Curie, Novembre 2012, P. 215. |
| [20] | Gosse K. (2005). Etude expérimentale de la dispersion d'un scalaire passif dans le proche sillage d'un corps d'Ahmed. Thèse de doctorat / Faculté Des Sciences De L'université De Rouen – 2005. P. 177. |
| [21] | Chen S. & Doolen G. (1998). Lattice Boltzmann Method for fluid flows. Ann. Rev. Fluid Mech. - 329-354, 1998. - Vol. 30. |
| [22] | Jones J. & Lauder B. (1961). A Single Formula for the Law of the Wall. Journal of Applied Mechanics, Vol. 28, No. 3: 444-458. |

 Abstract
 Reference
 Full-Text PDF
 Full-text HTML