-
Paper Information
- Next Paper
- Paper Submission
-
Journal Information
- About This Journal
- Editorial Board
- Current Issue
- Archive
- Author Guidelines
- Contact Us
American Journal of Environmental Engineering
p-ISSN: 2166-4633 e-ISSN: 2166-465X
2016; 6(5): 140-147
doi:10.5923/j.ajee.20160605.02

Analysis of Relationships between Night-time Imageries and Greenhouse Gases Emissions based on RS and GIS
 Abstract
 Reference
 Full-Text PDF
 Full-text HTML
Seyed Omid Reza Shobairi, Li Ming Yang
Department of Forest Management, College of Forestry, Nanjing Forestry University, Nanjing, China
Correspondence to: Li Ming Yang, Department of Forest Management, College of Forestry, Nanjing Forestry University, Nanjing, China.
| Email: |  |
Copyright © 2016 Scientific & Academic Publishing. All Rights Reserved.
This work is licensed under the Creative Commons Attribution International License (CC BY).
http://creativecommons.org/licenses/by/4.0/

DMSP/OLS1 is a special night-time imageries source that offers capabilities to represent human activities on the Earth’s surface through the observation of artificial lighting at night. This paper analyses CNLI2 of the earth at night derived from the DMSP-OLS night-time lights data, and it reveals striking correlations between CNLI and greenhouse gases emissions. The objective of this paper is to predict and model the relationships between the CNLI and trends of greenhouse gases emissions from 1996 to 2013, through comparative types of night-time lights time series, correlation matrix, forecast R value, regression models and eventually time series modelling.
Keywords: DMSP/OLS, CNLI, Greenhouse Gases Emissions
Cite this paper: Seyed Omid Reza Shobairi, Li Ming Yang, Analysis of Relationships between Night-time Imageries and Greenhouse Gases Emissions based on RS and GIS, American Journal of Environmental Engineering, Vol. 6 No. 5, 2016, pp. 140-147. doi: 10.5923/j.ajee.20160605.02.
Article Outline
1. Introduction
- DMSP/OLS is defense meteorological satellite program-optical line scan system datasets, from NOAA3, enables to make daily over flights and routinely collects visible images during its night-time pass [16]. Popular applications of the DMSP/OLS night time images include measuring impacts of urban growth on the environment, mapping night-time sky brightness, evaluating damage of natural disasters and forest fires [14]. In addition to clouds, mentioned night-side images record city lights man-made and natural gas flaring [10]. On the other hand, DMSP/OLS is used to map out the distribution of human settlements and the spatial distribution of human activities, such as energy consumption, were hampered due to problems of pixel saturation and blooming, cloud cover, and the presence of ephemeral light sources such as lightning and fires [7]. Altogether, the fundamental role of measured DMSP/OLS data is to detect human presence, urban people, settlements and light-demanding activities, energy, electricity consumption and gas emissions [2, 17, 14]. It is clear that increasing trend of urbanization and industrialization have a very important role in production, emissions and greenhouse gases effects. Urbanization and industrialization are global phenomena, and will challenge natural ecosystems and environmental health in the future [19], also they are considered simultaneous process associated with demographic dynamics, socio-economic growth and land-use changes, and subsequently will lead salient human-induced forces on environment and ecosystems [25, 18].Using DMSP/OLS night time lights data series is calculated CNLI [13]. CNLI helps to reflect the comprehensive urbanization levels, and represents dynamics of urbanization levels at national, provincial, and county scales [18, 5]. But what is important is that human activities likewise urbanization, industrialization and commercial, residential and transportation operation are directly considered as the most significant driving forces on greenhouse gases production and CO2 emission [21, 15], so that human activities have produced a 40% increase in the atmospheric concentration of carbon dioxide from 280 ppm in 1750 to 400 ppm in 2015 [3, 20, 28]. So it has been estimated that if greenhouse gas emissions continue at the present rate, Earth's surface temperature could exceed historical values as early as 2047, with potentially harmful effects on ecosystems, biodiversity and the livelihoods of people worldwide [9, 22]. Thus, in this wise, we hope that by comparing the rate of changes in CNLI and other conventional indicators; we can explore the rate of greenhouse gases emissions such as CO2, Co and NOx. As a matter of fact, we are going to find out the dependence between remotely sensed index such as CNLI and the process of greenhouse gases emissions. Some studies suggested that the correlation between the night-time imagery and other critical variables of the environment is statistically significant. [10] analyzed statistical correlation between economic activity, greenhouse emissions and DMSP-OLS night light images in Florida. [18] were concluded that using three regression models between night-time weighted light area and population density, built-up area and electric power consumption. [1] explained the relationships between road distribution, accumulation of buildings and dynamic population with spatial distribution of the light in Tohoku region. Other studies utilizing the DMSP-OLS imageries include the detection of forest fires [4], assessment of biomass burning in the Amazon [23], measurement of impervious surfaces, the spatial distribution of squid fishing grounds, electrical power consumption and CO2 emissions [10], change detection in urban extent [26], the heat island effect [12], and the spatial extent and effects of light pollution [11, 10], energy consumption in the Amazon [10, 2], studying relationships between nighttime imagery and population density [24], and population distribution and density global poverty [8]. Thus all of these studies explained that using the saturation calibrated data can improve the estimated human activities on the environment. The present study suggests that using the DMSP-OLS imageries will enable us to express higher correlation with Land Scan indicators as CNLI with the process of greenhouse gases emissions. Furthermore, we will produce models of trends of CNLI and greenhouse gasses emissions, and predicted correlation with mentioned variables to conclude better result than pre-existing models using DMSP-OLS imageries. Resources of greenhouse gas emissions and air pollution in Iran includes industrial activities, agriculture, electricity, commercial-residential and transportation operations, that they have almost occupied north, west and south west parts. Iran is a land area of 1,648,195 km2, and a population of about 79.2 million people in 2016; was one of the growing populated areas in the world. Studies project that the growth will continue to slow until it stabilizes above 105 million by 2050. For industrial-based regions likewise west provinces and southwest with such high population density, heavy air pollution and dust problems whether there will be similar relationships between night-time imageries and greenhouse gases emissions is expected to be investigated. To understand the relationships between night-time imageries and greenhouse gasses emissions for Iran, this study aims to answer the following questions:I. Does nighttime lights intensity positively correlate with the greenhouse gases emissions totally?II. Significantly, what is the relationship between integration of CNLI and CO2 emission at the national level?III. Does CNLI have relationship with greenhouse gases emissions in areas with high population density? The main objective of this research is to analyze the correlation between the nighttime lights time series of Iran and greenhouse gases emissions, through comparing one type of Light Index based on DMSP/OLS data from 1996 to 2013. It is also expected to produce models to estimate trend of population density, CNLI and greenhouse gases emissions. The results of this research is expected to provide more information about the problems of air pollution and warning about increasing trend of greenhouse gases emissions using nighttime imageries in areas with high population density, urbanization and high industrialization and whether final solutions and strategies will be necessary to overcome these problems and limitations.
2. Material and Method
2.1. Night-time Lights Data, Source and Definition
- The datasets were derived DMSP/OLS satellites such as F14, F15 and F16 from 1996 to 2013 in sun synchronous orbits with nighttime overpasses ranging from nearly 8 pm to 10 pm local time. Annual composites were produced for each satellite using the highest-quality data collected. [9] concluded the time series of DMSP/OLS nighttime lights for the period of 1996–2013 were collected by individual sensors: F12 (1994-1999), F14 (1997–2003), F15 (2000–2007), F16 (2004–2009) and F18 (2009-2013). A pixel in DMSP-OLS dataset was calculated a 30 arc-second grid cell (roughly 1 km2).The images were obtained from the web site of NOAA [6] directly. Given the sensitivity of the sensor at night, DMSP/OLS data can be used to detect a variety of VNIR emissions [26]. The availability of long time data with moderate spatial resolution (e.g., 1 km) has enabled researchers to explore a series of global, national and regional research subjects [8, 13]. In this present paper, DMSP/OLS nighttime data was used to directly observe urbanization and evaluate industrial activities [14].
2.2. Greenhouse Gases Dataset
- The selection of the second data was done from the website of statistical centre of Iran datasets [27]. The above mentioned datasets were based on annual production of greenhouse gases such as CO, CO2, NOx, SO2, SO3 and SPM4 (Ton/Year). It should be noted that, due to the limitations in data acquisition, either of the DMSP/OLS imageries and greenhouse gases datasets were taken at national scale, and were used to predict all districts in 1996 to 2013 in this study.
2.3. Calculation of CNLI
- By DMSP/OLS data, CNLI was computed at the scale of our study area using the following formula:
 | (1) |
 | (2) |
 | (3) |
2.4. Correlation Analysis
- We used correlation analysis to measure the strength of the relationships between CNLI and greenhouse gases emissions. The variables used in the analysis were CNLI values derived from Land Scan data in 1 km2 grid, pixel DN values derived from DMSP-OLS images in (1 km2 grid) and data of the most important greenhouse gases (Ton/Year).
2.5. Regression Analysis
- We will use a new approach to predict the models for all districts with the sum of lights within the polygon of Iran derived from DMSP-OLS imageries and CO2, CO, NOx and SPM datasets. Regression analysis was used to specifically measure the nature of the relationships between night-time lights and greenhouse gases. Regression models were conducted using CNLI of all districts of Iran as the dependent variable and most important gases as the independent variables. Graphical diagnostics and plots of residuals were analyzed to assess the results of regression models. Errors in estimates of CNLI and CO2, CO, NOx and SPM were mapped out for interpreting any possible spatial patterns for the distribution of residuals.
2.6. Time Series Analysis
- Time series forecasting is used to predict future trends of CNLI, CO, CO2, NOx, SPM and population density, based on previously observed values from 1996 to 2013. While regression analysis is often employed in such a way as to test theories that the current values of one or more independent time series affect the current value, this type of analysis of time series enables us to focus on comparing values of a single time series or multiple dependent time series at different points in time.
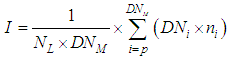
 | Figure 1. DMSP/OLS night-time lights of Iran; Profile (a) and (b) are related to start and end of the study period, from 1996 to 2013 respectively. The west parts of Iran have faced with heavy air pollution and dust problems. Sources of greenhouse gas emissions likewise urbanization, transportation and industrial activities, has intensified air pollution. Since the CNLI helps to reflect the dynamics of urbanization levels, industrialization and population density at national scale, as well as Pearson correlation coefficient is used as a measure to assess the relationship among night-time lights index likewise CNLI with greenhouse gases emissions during 18 years. (Cell size 30 arc second~1km2, Iran boundary overlaid) |
3. Results and Discussions
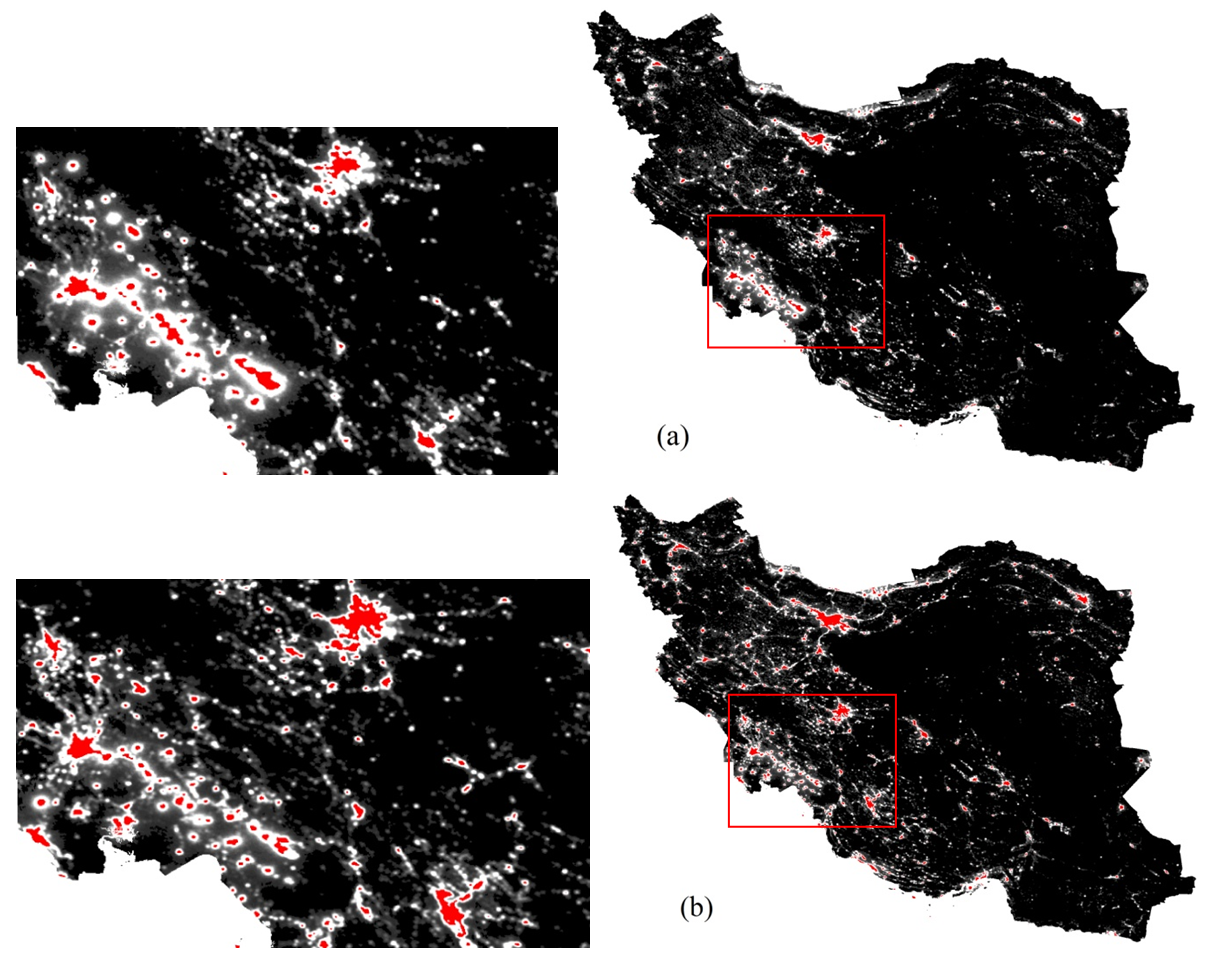
3.1. Results of Correlation Analysis
- Pearson correlation coefficient was calculated to analyze the relationship between CNLI and greenhouse gases emissions (Ton/Year), which is closed with urbanization index (Table 1). If the correlation coefficient is | r |> 0.90, there is a significant correlation between the two variables; if | r | ≥ 0.8, is highly relevant; if 0.5 ≤ | r | < 0.8, is moderately correlated; if 0.3 ≤ | r | < 0.5, there is l low correlation; if | r | < 0.3, there is a very weak relationship between two variables. As we would expect the CNLI strongly and positively correlated with the NOX, CO2, CO and SPM emissions (Ton/Year) with correlation coefficients around 0.84, 0.88, 0.77 and 0.86 separately.
|
|
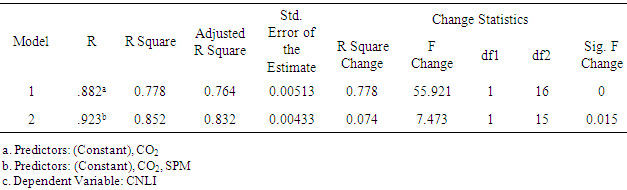
3.2. Results of Regression Analysis
- Figure 2 shows the results of the regression analysis for estimation of relationship between CNLI derived from DMSP-OLS images, and CO2, CO, NOX and SPM emissions (Ton/Year).
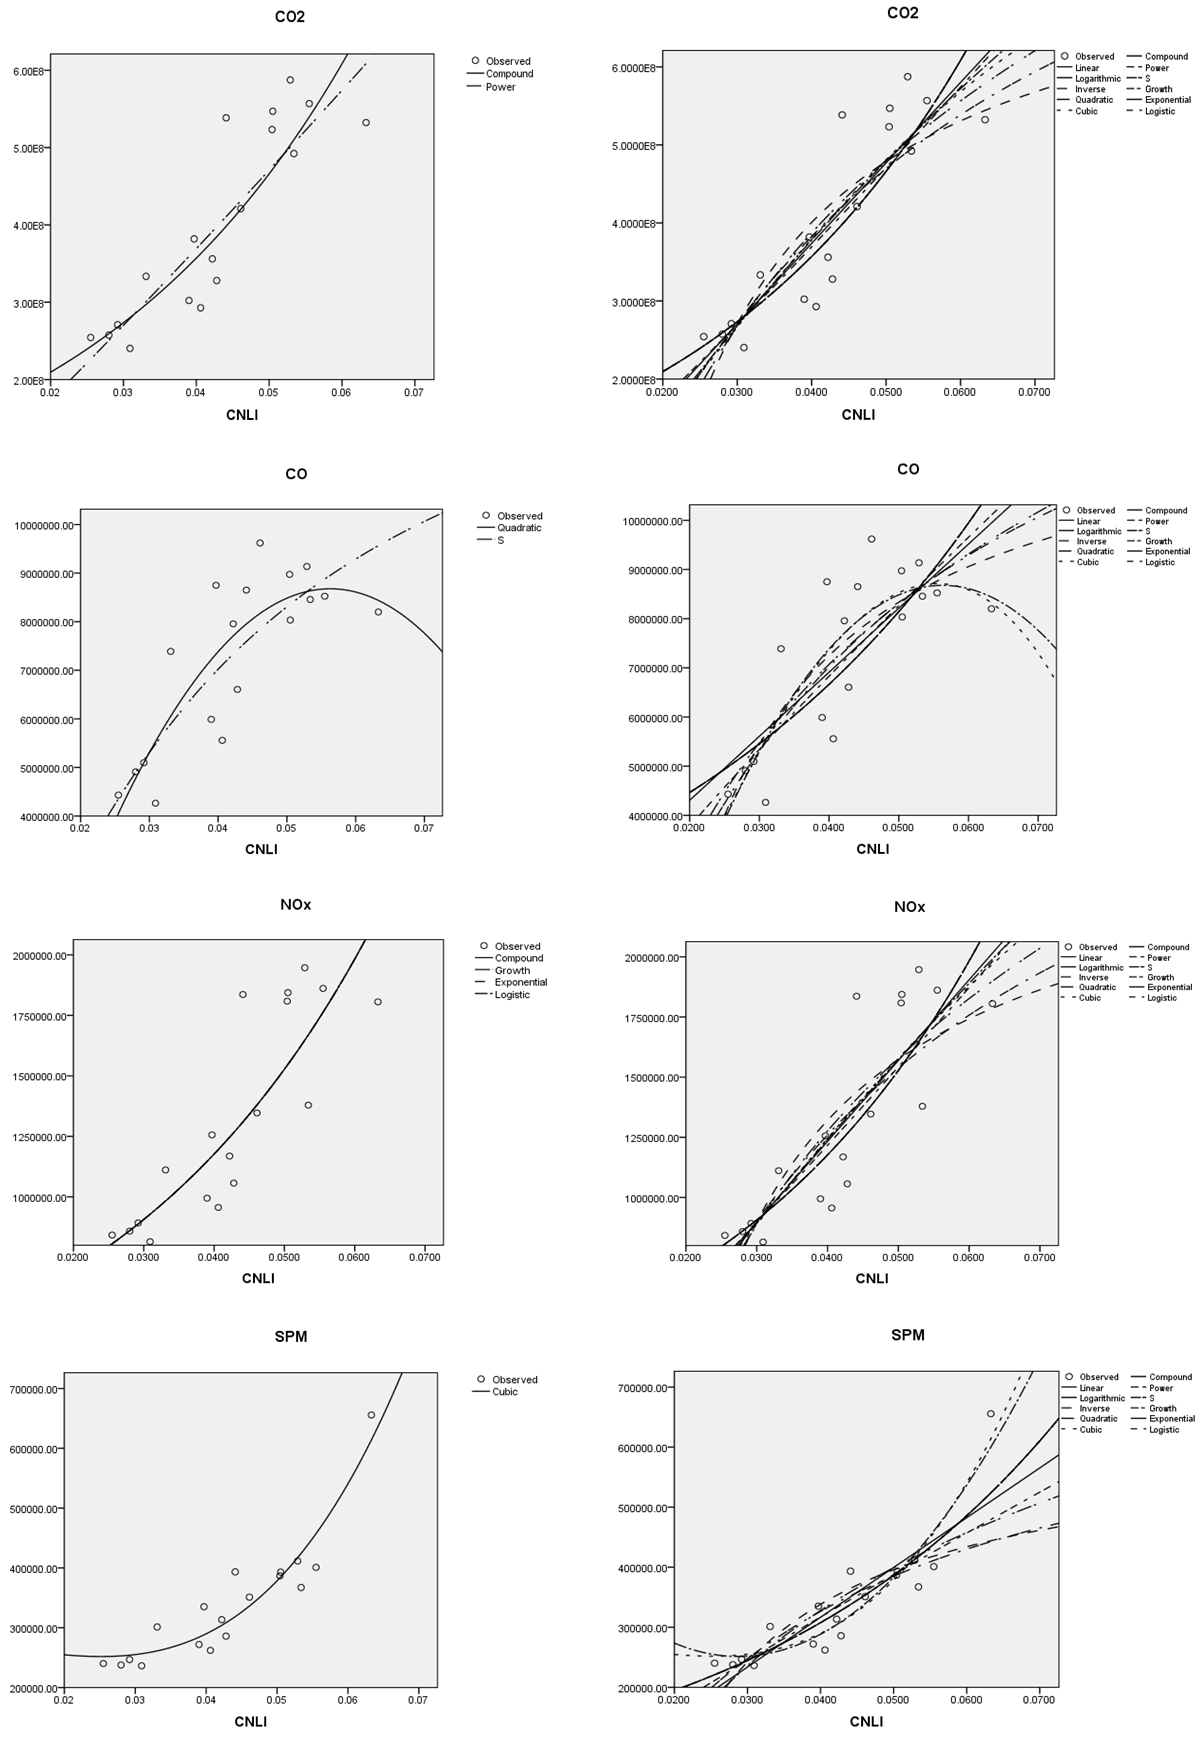 | Figure 2. Regression models predicting between CNLI and CO2, CO, NOX, SPM |
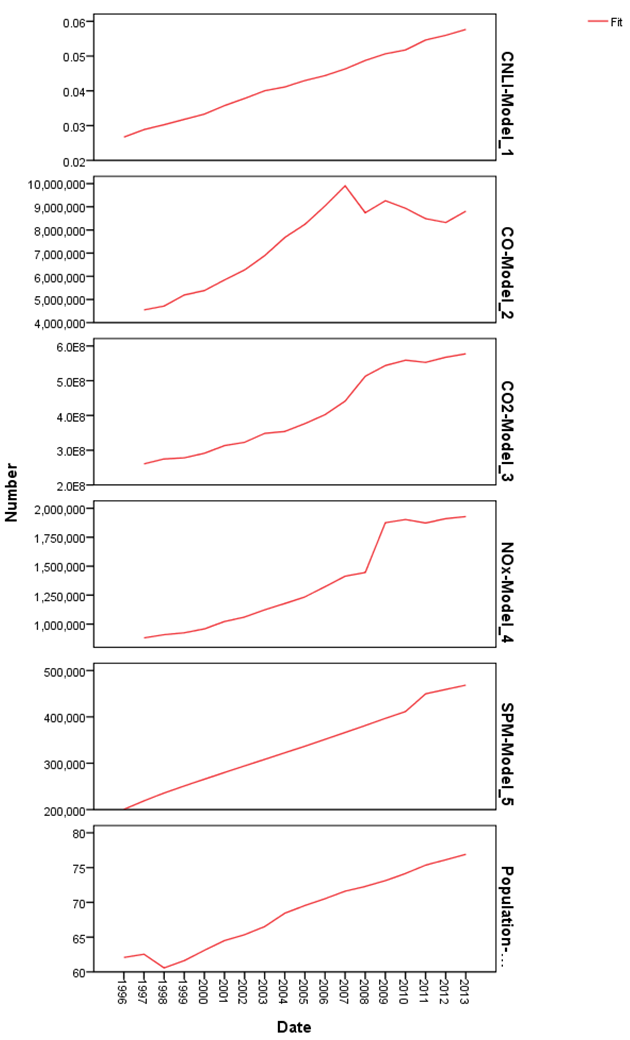 | Figure 3. Time series analysis of CNLI, CO, CO2, NOX, SPM and population density |
4. Conclusions
- Conclusively, we found that night-time imageries came from DMSP-OLS sensors with identical on board design and continuous space platform, providing a unique and valuable resource for monitoring the long-term dynamics of urbanization and industrialization. More importantly, the DMSP/OLS night-time lights images have been utilized for quantitatively estimating and mapping out human socio-economic activities related to urbanization and industrial operation from regional to national scales. However, using DMSP/OLS data, there are few studies focused on monitoring the dynamics of urbanization levels and review their relationship with greenhouse gases emissions for the last two decades at a comprehensive scale, especially the dynamics before and after 2000 in Middle East. The objective of this study was to describe a reliable method of estimating relationship between urbanization levels based on DMSP/OLS night-time imageries with greenhouse gases emissions in areas with high population density, and to analyze the dynamics of their process from 1996 to 2013. In this study, using one significant impact of night-time imageries likewise CNLI; with more accurate resolution than DMSP-OLS images; were determined sources of night-time lights based on human activities and was recorded sources of greenhouse gases emissions at the spatial resolution of Land Scan grid (about 1 km2). With the exception of the DMSP/OLS night-time lights images, we also used datasets of greenhouse gases emissions (Ton/Year). We analyzed the relationships between CNLI with annual emissions of the most important greenhouse gases such as CO, CO2, NOx, SO2, SO3 and SPM (Ton/Year) in Iran. The results indicated that CNLI derived from DMSP/OLS night-time lights intensity positively correlated with the greenhouse gases emissions (Ton/Year). The results of Pearson correlation coefficient showed that the CNLI was highly correlated with the NOX, CO2, CO and SPM emissions (Ton/Year) with correlation coefficients almost 0.84, 0.88, 0.77 and 0.86 respectively. Also the model of forecast R value demonstrated that there is a strong relationship between CNLI with CO2 and SPM emissions. From a statistical perspective, the model of forecast R value confirmed all of the assumptions of the Pearson correlation, but the regression analysis could provide the best fit model for estimating the important role of urbanization, industrialization and transportation activities in production and expansion of greenhouse gases with using night-time imageries. From the regression results, we can conclude that the simple liner regression models showed a positive liner relationship as well as statistically significant. Also it was best predictor for the estimation of relationship between CNLI derived from night-time lights with greenhouse gases emissions (Ton/Year). Other potential measures likewise multiple liner regression models can be taken into consideration as one of the predictors for the total relations. Additionally time series models represented the correlations graphically for either of the mentioned variables, and also it could predict direction of intended process. We could explore that trends of CNLI, population density and air pollution are increasing in all areas with high potential of greenhouse gases emissions and dust problems. However, the greenhouse effects, combined with increasing trend of greenhouse gases and the resulting global warming, are expected to have profound implications, according to the near-universal consensus of scientists. If global warming continues unchecked, it will cause significant climate change, rise in sea levels, increasing ocean acidification, extreme weather events and other severe natural and societal impacts, and seek main solution from scientific and governmental bodies. Finally, we agree that the damage to the Earth's atmosphere and climate is past the point of no return or that the damage is near the point of no return. We recommend three options from this point forward; 1. Do nothing and live with the consequences, 2. Adapt to the changing climate (which includes things like rising sea levels, related flooding and other natural hazards), and finally 3. Mitigate the impact of climate change by aggressively enacting policies that actually reduce the concentration of CO2 and other driving forces in the atmosphere.
ACKNOWLEDGMENTS
- I am greatly indebted to NJFU for every support provided during the research period.
Notes
- 1. Defense Meteorological Satellite Program-Operational Linescan System.2. Compounded Night Light Index.3. National Oceanic and Atmospheric Administration.4. Suspended Particulate Matter.