Bernard Twaróg
Institute of Hydraulic Engineering and Water Management, Department of Water Engineering and Water Management, Faculty of Environmental Engineering, Cracow University of Technology, Poland
Correspondence to: Bernard Twaróg , Institute of Hydraulic Engineering and Water Management, Department of Water Engineering and Water Management, Faculty of Environmental Engineering, Cracow University of Technology, Poland.
| Email: |  |
Copyright © 2016 Scientific & Academic Publishing. All Rights Reserved.
This work is licensed under the Creative Commons Attribution International License (CC BY).
http://creativecommons.org/licenses/by/4.0/

Abstract
In this study a two-dimensional random process described by a two-dimensional random variable representing flood wave duration and flood wave volume is used to assess parameters for a control rule implemented at a retention reservoir. A description of the probability distribution of the two-dimensional random variable indicated above is compiled using a two-dimensional Gumbel-Hougaard copula function. The marginal distribution functions used in this study have the form of log-normal functions. The parameter of the Gumbel-Hougaard copula function is estimated using optimization methods. A Monte Carlo method was applied to assess the risk posed by control parameters of a multi-purpose retention reservoir. Finally, an experiment was defined and a simulations for risk assessment were carried out to find solutions.
Keywords:
Ruin theory, Random process, Gumbel-Hougaard copula function, Two-dimensional random variable of flood wave volume and duration
Cite this paper: Bernard Twaróg , An Assessment of Risks Posed by Control Rule Parameters Implemented in a Flood Control Reservoir, Carried out with the Application of Elements of Ruin Theory and of Bivariate Distribution of a Random Variable Based on the Copula Function, American Journal of Environmental Engineering, Vol. 6 No. 2, 2016, pp. 62-71. doi: 10.5923/j.ajee.20160602.04.
1. Introduction
This study represents another step in extending and promoting risk estimation methods for specific values taken on by control rule parameters implemented for flood control reservoirs. The prior analyses [8] were focused on the application of a unidimensional random variable in an assessment of risk parameters. In this study, a two-dimensional approach is applied, i.e. a two-dimensional random variable representing the volume of inflow to the reservoir and the time of appearance of such volume. The aim of this approach is to define a two-dimensional random process included in an equation of flood control capacity filling (Twaróg, 2014) to assess risk values.The proposed approach is more appropriate in terms of methodology, compared to that previously discussed and based on a unidimensional random variable for several reasons. An indisputable advantage of the present proposal consists in the application of a generalized approach wherein a two-dimensional random process with a single joint distribution are used to describe events that occur in the reservoir: the time of appearance of a specific value of volume and the value of that volume. Another advantage results from the application of the copula function that combines in this case two potentially different random distributions describing the indicated random variables.
2. A Description of Retention Reservoir Operation Based on a Two-dimensional Random Process
The filling process of flood control capacity is represented by the following equation, modified to include a two-dimensional random process that represents time values and values of volumes appearing after defined time intervals: | (2.1) |
Let us assume a simple rule for controlling of a storage reservoir. Let the discharged volume be defined by the following rule: | (2.2) |
where: inflow to the reservoir at the moment t,
 set outflow from the reservoir,
 outflow from the reservoir to be discharged at the moment t,
 initial flood control capacity
 | (2.3) |
 | (2.4) |
where: volume of water inflow to the reservoir
 total inflow volume in the period
 the first coordinate of the two-dimensional random process used to model times of inflow of specific volumes to the reservoir
 the second coordinate of the two-dimensional random process used to model inflows of specific volumes to the reservoir
2.1. Filled Flood Control Capacity – Similarity to the Ruin Status
When the value of volume accumulated in the reservoir becomes negative, this means that the total of volumes of inflows to the reservoir has exceeded the value of the flood control capacity; let this moment be termed the moment of ruin and be defined as: | (2.5) |
The probability of filling the flood storage capacity, correspondingly: | (2.6) |
2.2. The Volume Accumulation Process
The volume accumulation process observed at moments: is understood as volume accumulation process in time:
 | (2.7) |
2.3. Safety Factor of Safe Outflow
Assuming  for a certain
  we obtain:
 | (2.8) |
The factor  is called the safety factor of set outflow.
3. Determining Distribution of a Two-dimensional Random Variable
3.1. Distributions Based on Copula Functions
Copula functions are used to describe a two-dimensional random variable. The application of a copula function as a tool to obtain multivariate distributions of random variables was already discussed by the author of this study in 2008. Looking back, copula functions were originally applied in economics. The usefulness of an approach based on those functions results from the possibility of combining univariate marginal probability distributions of a single random variable into a complete multivariate distribution of a multidimensional random variable.Continued interest in distributions based on copula functions results principally from the possibilities they offer in the development of new methods of probabilistic modelling in the engineering sciences. The theoretical details are discussed by the author of this study in [3, 4].
3.2. Multidimensional Copulas
The function of the  type is defined as follows and has the following properties:
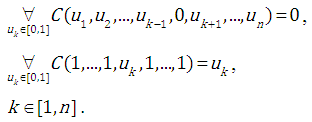 As in the two-dimensional problem, the relation between joint distribution
  and marginal distributions
  is given by:
 | (3.1) |
where: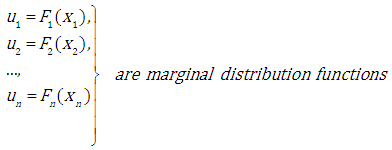 Variables
  are marginal distribution functions. If the variables are continuous, the probability density function is given by:
 | (3.2) |
It is also observed that the probability density  describing a
  - dimensional random variable is given by:
 | (3.3) |
where: - marginal probability density function of a random variable
  .
.
3.3. Archimedean Copula
In this study, a function from the Archimedean family – the Gumbel-Hougaard copula function – is applied.In general, the distribution family given by | (3.4) |
is known as the Archimedean family.Typical examples include:the Clayton form: | (3.5) |
where: the Gumbel-Hougaard form (a single-parameter copula):
 | (3.6) |
where: the Gumbel-Hougaard form (a two-parameter copula):
 | (3.7) |
where: the Frank form:
 | (3.8) |
where:
4. A Description of a Two-dimensional Random Variable Based on the Copula Function
In order to preserve marginal distribution parameters, the two-dimensional random process is generated using the distribution of a two-dimensional random variable based on a function from the Archimedean copula family known as the Gumbel-Hougaard copula. Finally the Gumbel-Hougaard copula function was used in this analysis, but results for the Clayton function are also given for comparison purposes.The analysis is based on empirical data of flood waves collected at the Stróża water-level gauge between 1951 and 2010. A detailed description of the data used and the data processing method are given in [4]. The figure shows only the concept used to determine wave characteristics.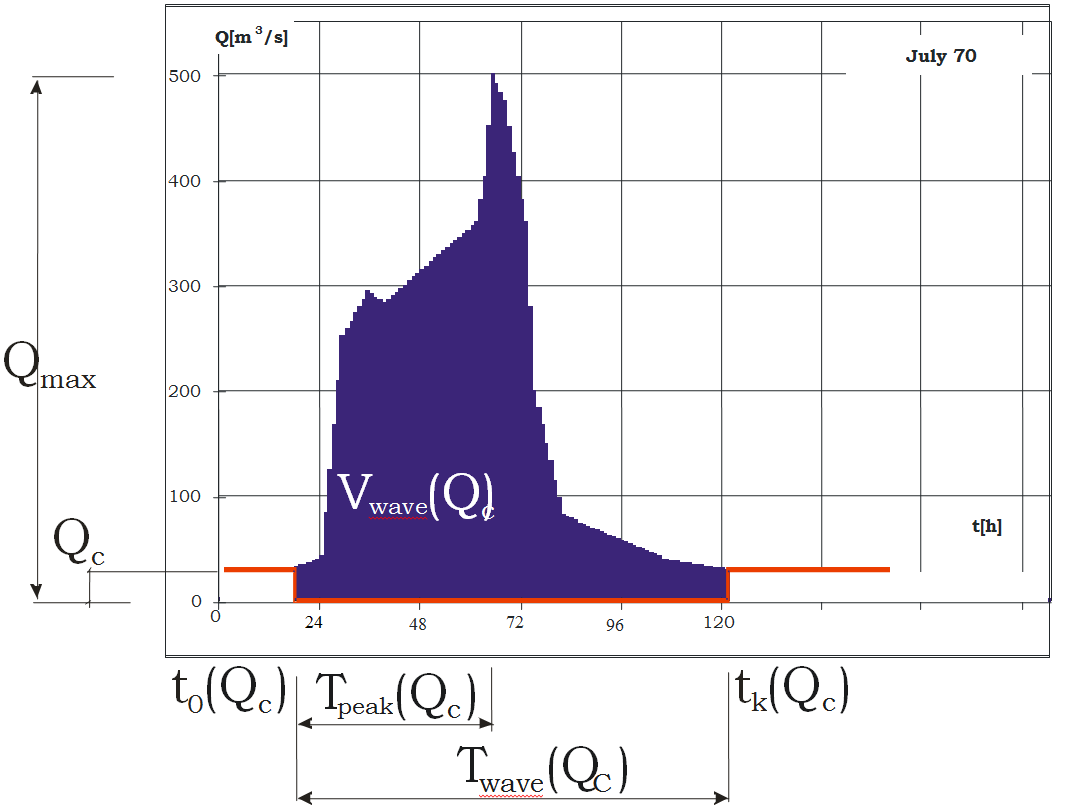 | Figure 1. Method used to assess flood wave characteristics |
4.1. Gumbel-Hougaard Copula
This form of copula function is one of the most frequently used in determining extreme value distributions and has been analysed in prior studies published by the author [3, 4]. | (4.1) |
where: - cumulative distribution function,
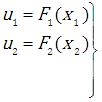 are marginal distribution functions,
 - an optimum parameter for the selected copula function,
4.2. Definition of an Optimization Problem
An optimization problem was defined to solve the problem of estimating the copula function parameter. The forms of the empirical cumulative distribution function and the theoretical cumulative distribution function were defined, as were decision variables and the form of the criterion function.The empirical distribution function is given by: | (4.2) |
where:
 - number of observations,
 - the value of empirical cumulative distribution function.A log-normal distribution is adopted as the form of marginal distribution functions for the analysed random variable.
 | (4.3) |
Marginal distribution parameters are defined using the maximum likelihood method. Using the possibilities offered by the copula function, the value of the theoretical cumulative distribution function is given by: | (4.4) |
where: - cumulative distribution function based on the copula function,
 - the copula function parameter takes on values from a set dependent on the copula function form,
 - the marginal distribution function of a specific random variable, dependent on the parameter vector
  ,
, - distribution parameter vector with coordinates computed for the maximum of the likelihood function,The following form of criterion function is assumed:
 | (4.5) |
where: - the value of theoretical distribution function,
 - criterion function.For the indicated form of criterion function, we seek a vector of numerical coefficients (vector of decision variables) at which the criterion function takes on its minimum value:
 | (4.6) |
4.3. A Description of a Two-dimensional Random Variable – Results of Optimization
The maximum likelihood method was used to define the marginal distribution parameters in the first step, then the copula function parameter was optimized. It was determined that the best description of the empirical distribution function for the analysed flood wave characteristics was provided by the Gumbel-Hougard function based on log-normal marginal distributions. | (4.7) |
where: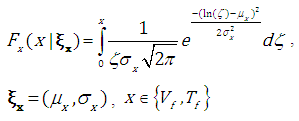
4.4. Results of Distribution Describing a Two-Dimensional Random Variable
The results of modelling a two-dimensional random variable are given below. The probability density function for the two-dimensional random variable representing volume and time is given in graphic form. The graphs illustrate both Gumbel-Hougaard and Clayton copula functions. The Gumbel-Hougaard copula was finally selected due to its lower value for the criterion function, i.e. better matching of the theoretical and empirical distribution functions.In addition, the results of applying Monte Carlo methods in generating values for the analysed random variables are shown. The graphs representing the results of the Monte Carlo methods applied demonstrate the correct concentrations of sets of generated points around empirical data and an optimized form of theoretical bivariate distribution of a random variable based on the Gumbel-Hougaard copula function with log-normal marginal distributions.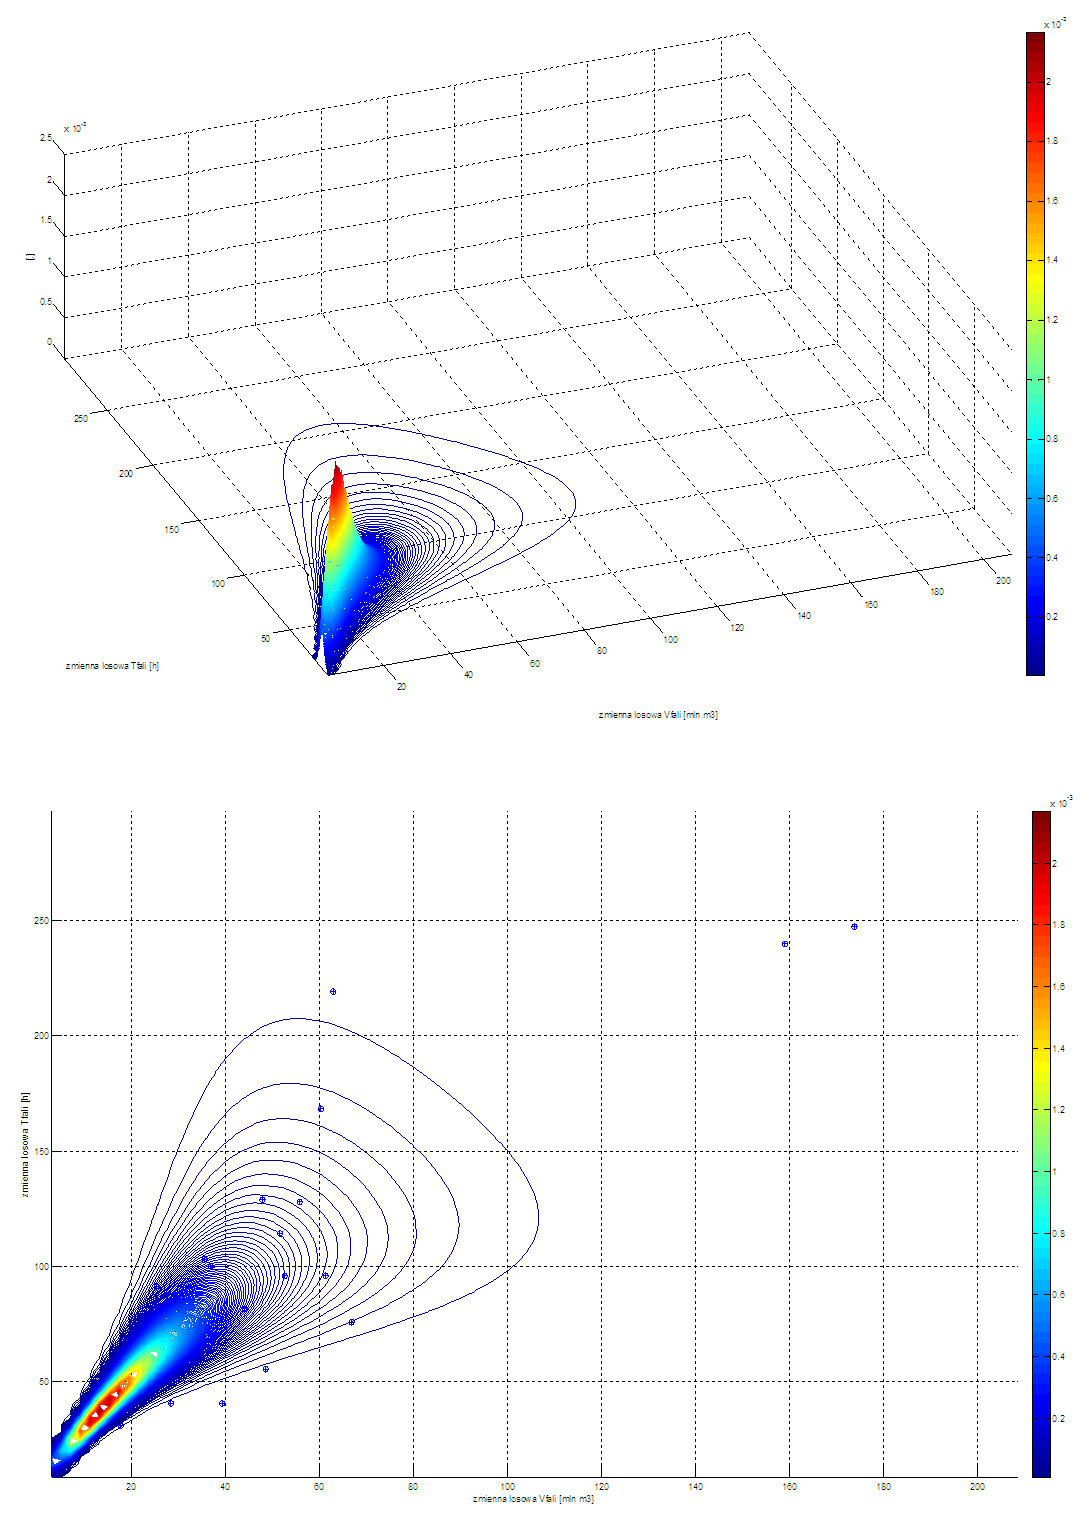 | Figure 2. Probability density function based on the Clayton copula function with log-normal marginal distributions; horizontal axis: volume, vertical axis: time |
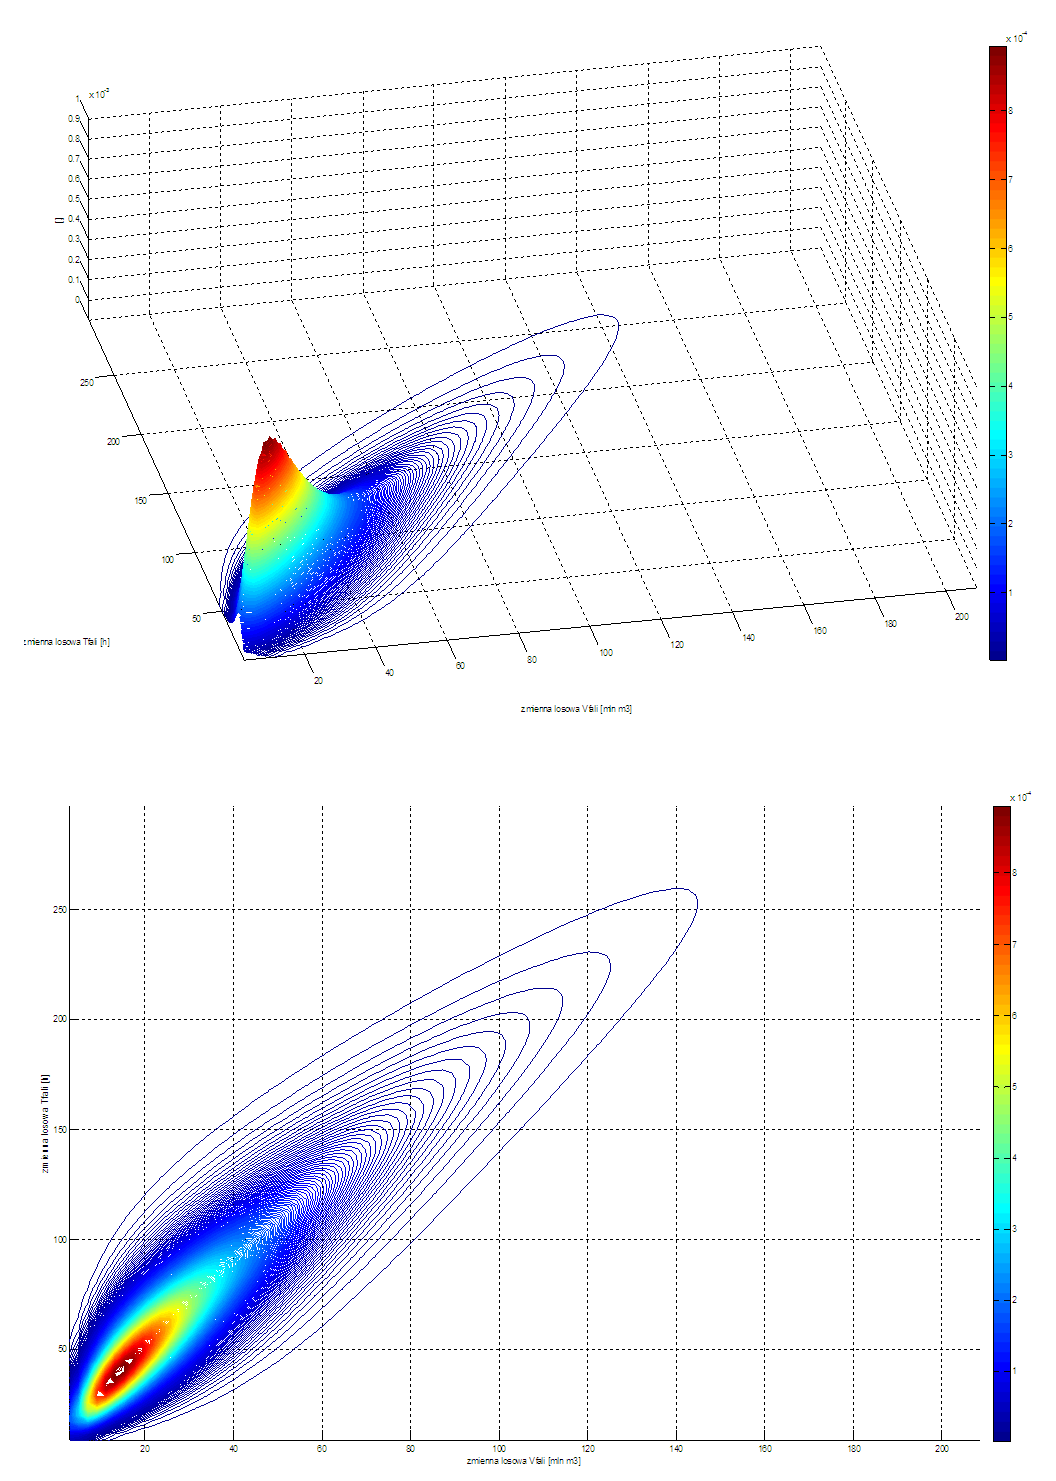 | Figure 3. Probability density function based on the Gumbel-Hougaard copula function with log-normal marginal distributions; horizontal axis: volume, vertical axis: time |
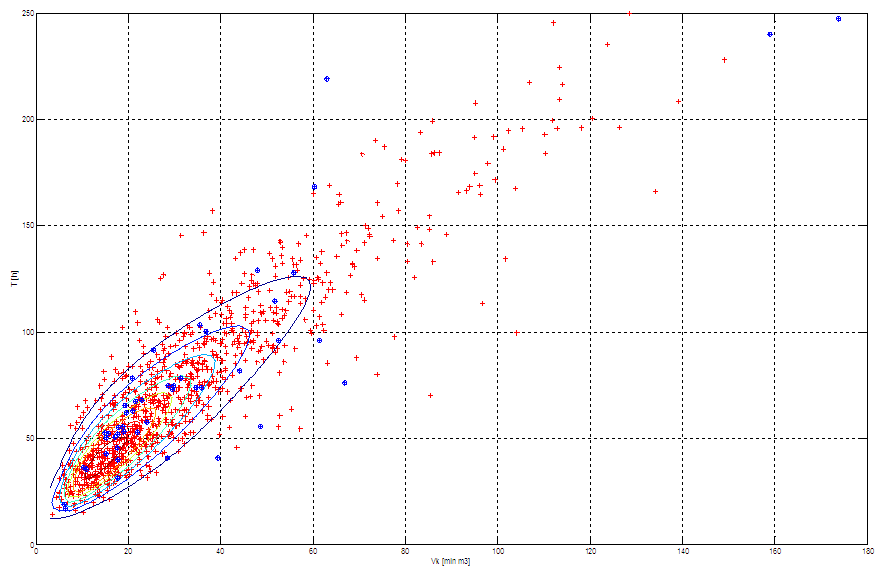 | Figure 4. The effect of application of MC (to generate a set of wave volumes and wave durations, coordinate system (volume [Mm3], duration [h], 1000 points), red points – generated using the MC method, blue points – empirical data. Distribution contour lines shown in the background |
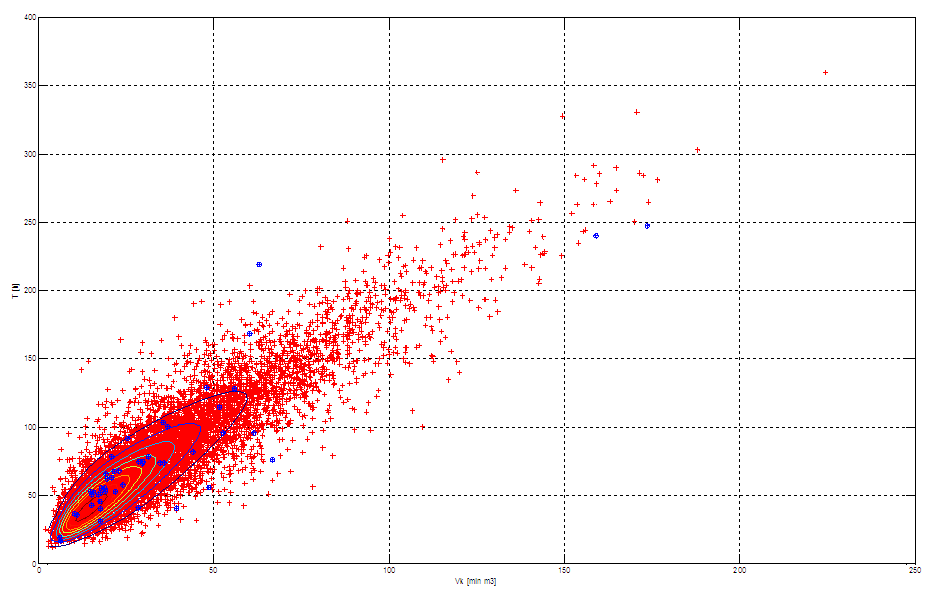 | Figure 5. The effect of application of MC (to generate a set of wave volumes and wave durations, coordinate system (volume [Mm3], duration [h], 10000 points), red points – generated using the MC method, blue points – empirical data. Distribution contour lines shown in the background |
Table 1. Optimum parameter of the copula function
 |
| |
|
Table 2. A statement of marginal distribution parameters - a log-normal distribution
 |
| |
|
5. An Application of the Theory – Risk Calculation
The discussed experiment (algorithm) has been designed so as to estimate the value of probability of the flood control capacity being filled, as a function of the following quantities:• safety factor• flood control capacity• value of set (controlled) outflowAccording to the results obtained, the functions of risk values at extreme analysed values of flood control capacity and controlled discharge are not monotonic. This is due to the fact that simulations were completed for sets of only 10000 cycle elements and only 10000 cycles. Experience indicates that monotonicity appears if these numbers are increased by a factor of 10.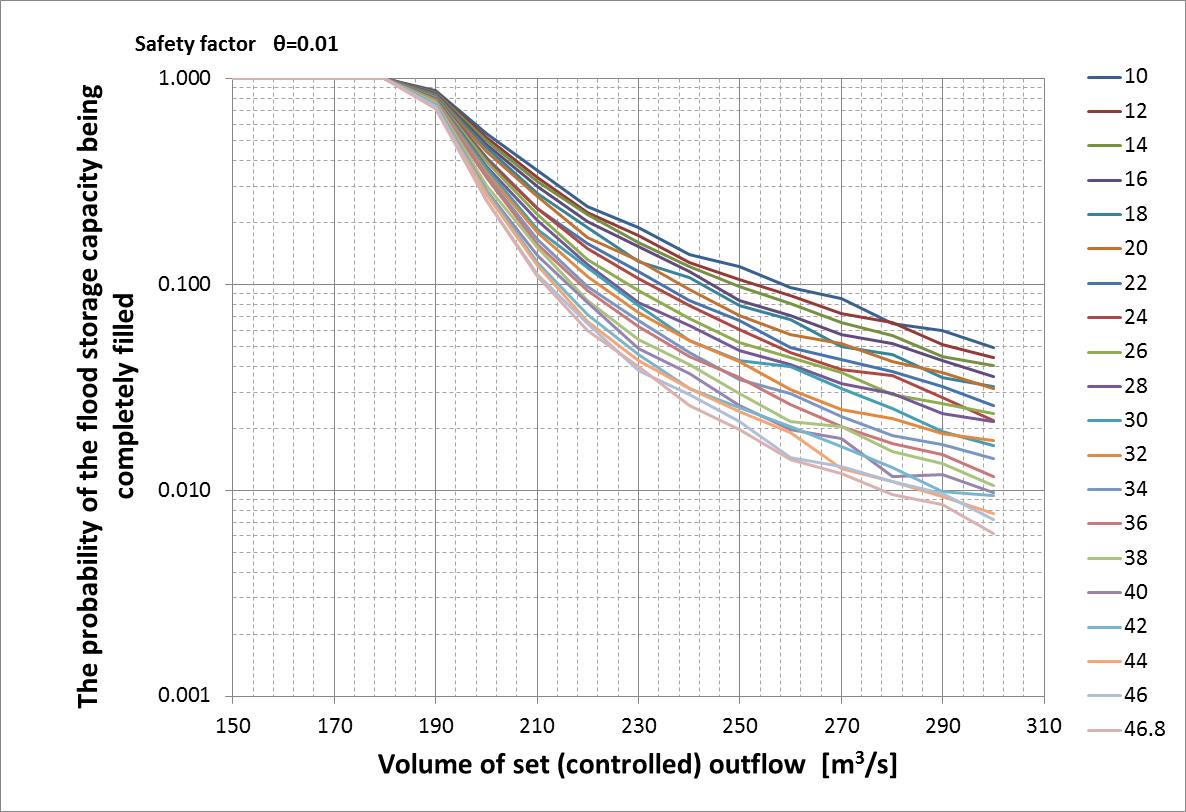 | Figure 6. The probability of the flood control capacity being filled for varying values of flood control capacity as a function of fixed set outflow. Safety factor θ=0.01. Number of elements in the sequence: 10000, number of cycles: 10000 |
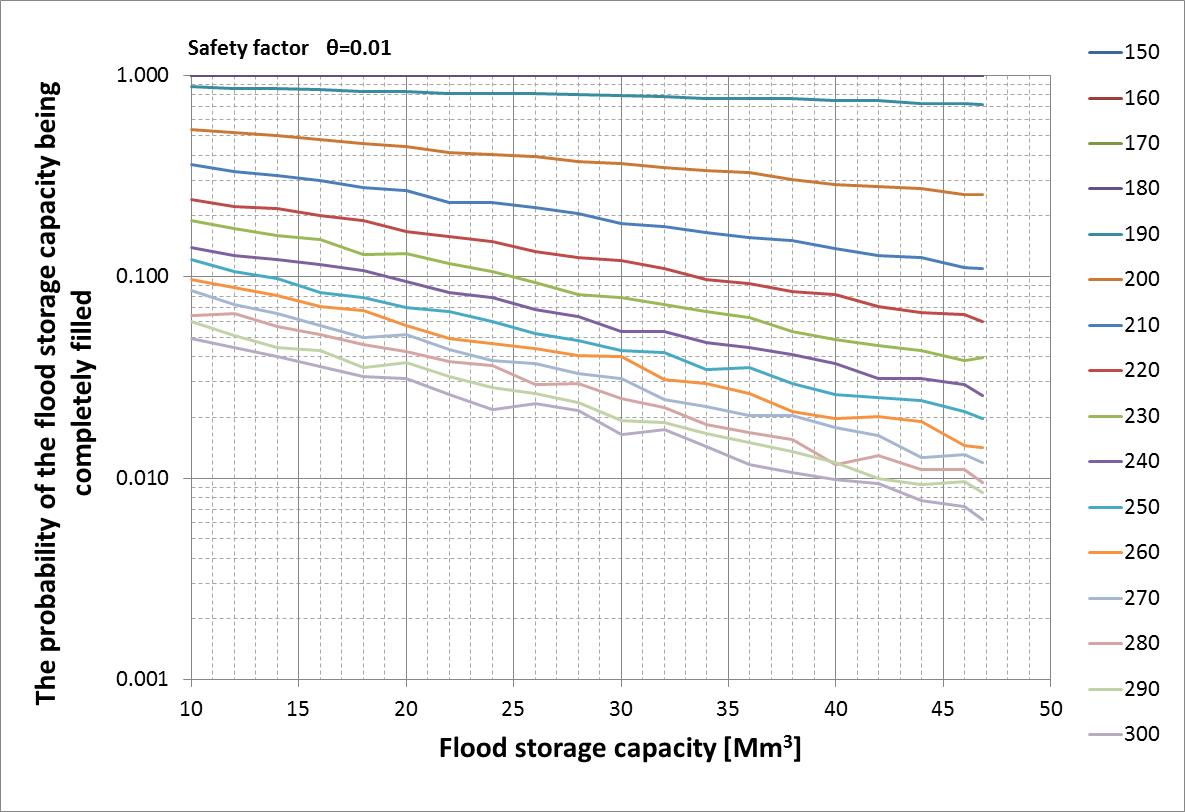 | Figure 7. The probability of the flood control capacity being filled for varying values of fixed set outflow as a function of the value of flood control capacity. Safety factor θ=0.01. Number of elements in the sequence: 10000, number of cycles: 10000 |
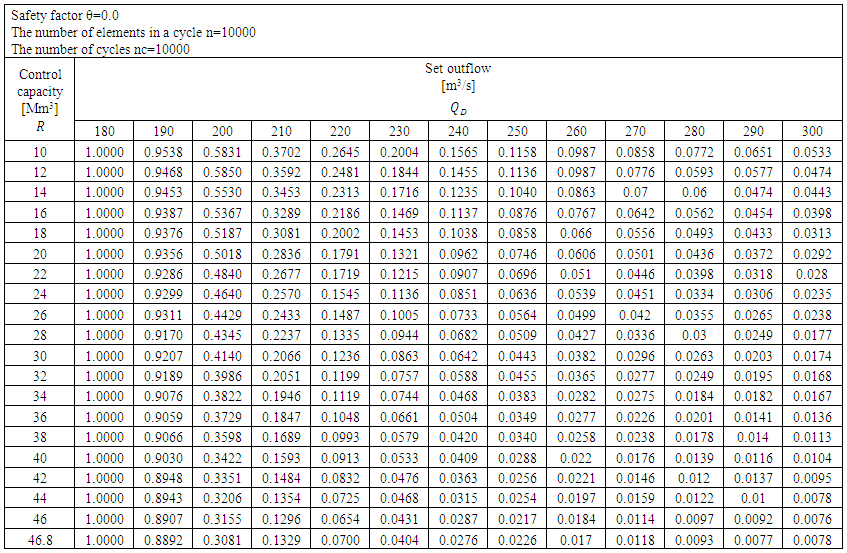 | Table 3. The probability of the flood control capacity being filled. θ =0.0 |
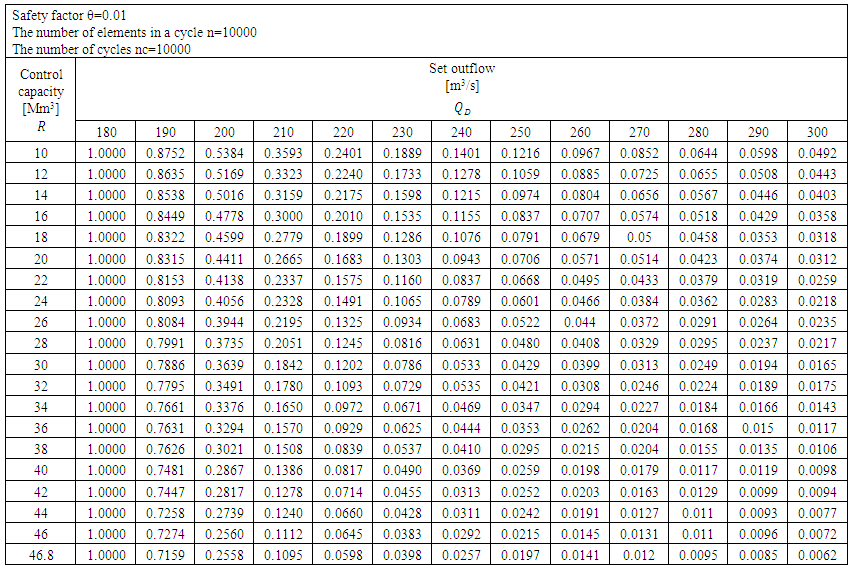 | Table 4. The probability of the flood control capacity being filled. θ =0.01 |
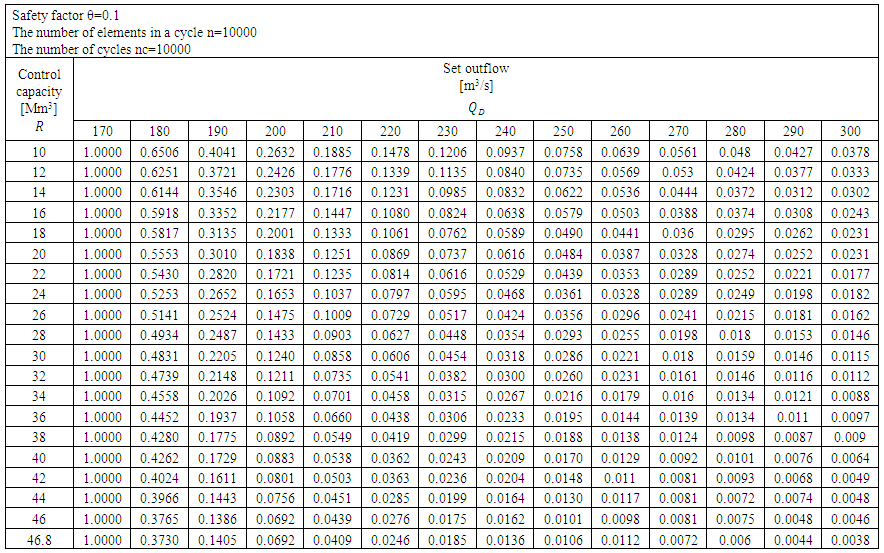 | Table 5. The probability of the flood control capacity being filled. θ =0.1 |
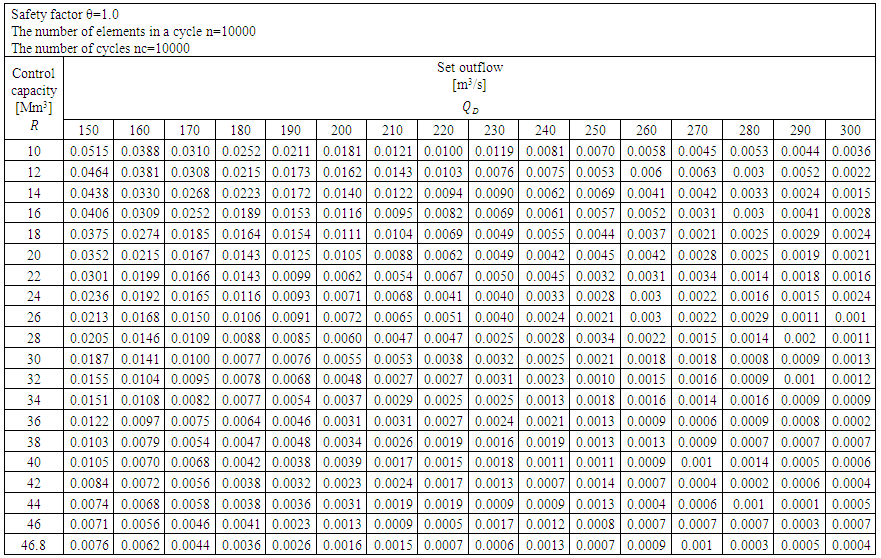 | Table 6. The probability of the flood control capacity being filled. θ =1.0 |
6. Conclusions
This study discusses experiments performed in determining risks for various parameters for control rules implemented in a flood control reservoir, with the application of ruin theory. A unidimensional random process describing extreme values of inflow to reservoir was used in a prior approach to assess the operation of a reservoir with defined parameters for the control rule. This study demonstrates the possibilities of risk assessment offered by a two-dimensional random process. The random processes used are described by a two-dimensional random variable representing flood wave duration and flood wave volume. A description of the probability distribution for the two-dimensional random variable described above is compiled using a two-dimensional Gumbel-Hougaard copula function. Log-normal functions are assumed for marginal distribution functions, based on the experiments described in [3, 4]. The parameter of the Gumbel-Hougaard copula function is estimated using optimization methods.A computational experiment has been defined and designed so as to estimate the value of probability of the flood control capacity being filled, as a function of the following quantities: the safety factor, the value of flood control capacity, the value of set (controlled) outflow. The results of analyses are given in tabular and graphic formats.The proposed approach is more adequate in terms of methodology compared to that previously discussed for several reasons. An indisputable advantage of the present proposal consists in the application of a generalized approach wherein a two-dimensional random process with a single joint distribution are used to describe events that occur in the reservoir: the time of appearance of a specific value of volume and the value of that volume. Another advantage results from the application of the copula function that combines in this case two log-normal marginal distributions describing the indicated random variables. It should be emphasised that the measure of probability of filling a flood control capacity, as computed using the proposed method, represents a valuable tool for estimating and assessing the values of parameters of a retention reservoir. The highest probability value may be regarded as an indicator of instability: a measure indicating the need to increase the volume of set outflow or to provide an additional flood control capacity. The probability of the flood control capacity being filled enables us to compare proposed changes in control rule parameters, but this concept must not be associated with an absolute prediction of the control capacity being or not being filled in the near future. The probability of the flood control capacity being filled is merely a measure of the risk associated with the selection of parameters and cannot be used to avoid possible erroneous decisions concerning reservoir operation.
References
| [1] | Gikhman and A.V. Skorohod, Introduction to the Theory of Random Processes (Saunders, Philadelphia, 1969). |
| [2] | Niemiro W., Matematyka stosowana. Symulacje stochastyczne i metody Monte Carlo [Applied Mathematics. Stochastic Simulations and Monte Carlo Methods]. University of Warsaw, 2013. |
| [3] | Twaróg B., Wybrane aspekty oceny ryzyka w inżynierii środowiska [“Selected aspects of risk assessment in environmental engineering. Lot II. Application of copula functions”. 6th National Seminar on Environmental Hazards. Paszkówka, October 2005, IMGW Monographs, IMGW Warsaw, ISBN 83-88897-74-8, 68-89. |
| [4] | Twaróg B., Wybrane aspekty oceny ryzyka w inżynierii środowiska [“Selected aspects of risk assessment in environmental engineering. Part I. Application of the Gumbel mixed model.”] 6th National Seminar on Environmental Hazards. Paszkówka, October 2005, IMGW Monographs, IMGW Warsaw, ISBN 83-88897-74-8, 90-110. |
| [5] | Twaróg B., Zastosowanie funkcji Copula do budowy rozkładów prawdopodobieństwa wielowymiarowej zmiennej losowej określanej dla zbioru parametrów fali powodziowej [“Application of the copula function in generating probability multivariate distributions of random variable defined for a set of flood wave characteristics”]. Z.Ś-10/2006 ISSN 0011-4561 |
| [6] | Twaróg B., Zastosowanie metody Monte Carlo do generowania dopływów do zbiornika retencyjnego [“Application of the Monte Carlo method in generating inflows to a retention reservoir”]. Czas. Tech., Środ. PK. - 2007, vol. 2, 205-225. |
| [7] | Twaróg B., Wielokryterialna ocena algorytmów wspomagania decyzji w warunkach powodzi z uwzględnieniem ryzyka [“A multi-criteria assessment of decision-supporting algorithms under flood conditions, including risk factors”]. Czas. Tech., Środ. / PK. - 2009, vol. 1-Ś, 119-152, references: 27 items. |
| [8] | Twaróg B., Elementy teorii decyzji – sterowanie zbiornikiem Dobczyce 2010 – ucieczka przed ruiną. Wybrane przykłady systemów wspomagania decyzji i modelowania w gospodarce wodnej [“Elements of decision theory – a case study of Dobczyce reservoir control procedures in 2010: attempt to avoid ruin. Selected systems supporting decision-making and modelling in water management”], ed.: Tomasz Walczykiewicz. – Warsaw: Institute of Meteorology and Water Management - National Research Institute, 2014. – (Monographs of the Institute of Meteorology and Water Management), 131-164: Fig., Tab. 1-Ś, 163-164, Abstr.: – ISBN 978-83-61102-56-4. |
| [9] | Twaróg B., “Ruin theory applied to the assessment of parameters for the control rule implemented in a flood control reservoir TICEAS”: Tokyo International Conference on Engineering and Applied Science, SEDT: Tokyo International Conference on Software Engineering and Digital Technology, ILSBE: Tokyo International Conference on Life Science and Biological Engineering, December 2014, Tokyo, Japan: conference proceedings TICEAS-399. – References: 11 items, Abstr. – ISBN 978-986-5654-07-8. |


 inflow to the reservoir at the moment t,
 set outflow from the reservoir,
 outflow from the reservoir to be discharged at the moment t,
 initial flood control capacity

 volume of water inflow to the reservoir
 total inflow volume in the period
 the first coordinate of the two-dimensional random process used to model times of inflow of specific volumes to the reservoir
 the second coordinate of the two-dimensional random process used to model inflows of specific volumes to the reservoir

 is understood as volume accumulation process in time:
 for a certain
  we obtain:
 is called the safety factor of set outflow.
 type is defined as follows and has the following properties:
 As in the two-dimensional problem, the relation between joint distribution
  and marginal distributions
  is given by:
 Variables
  are marginal distribution functions. If the variables are continuous, the probability density function is given by:
 describing a
  - dimensional random variable is given by:
 - marginal probability density function of a random variable
  .
.

 the Gumbel-Hougaard form (a single-parameter copula):
 the Gumbel-Hougaard form (a two-parameter copula):
 the Frank form:


 - cumulative distribution function,
 are marginal distribution functions,
 - an optimum parameter for the selected copula function,

 - number of observations,
 - the value of empirical cumulative distribution function.A log-normal distribution is adopted as the form of marginal distribution functions for the analysed random variable.

 - cumulative distribution function based on the copula function,
 - the copula function parameter takes on values from a set dependent on the copula function form,
 - the marginal distribution function of a specific random variable, dependent on the parameter vector
  ,
, - distribution parameter vector with coordinates computed for the maximum of the likelihood function,The following form of criterion function is assumed:
 - the value of theoretical distribution function,
 - criterion function.For the indicated form of criterion function, we seek a vector of numerical coefficients (vector of decision variables) at which the criterion function takes on its minimum value:


 Abstract
 Reference
 Full-Text PDF
 Full-text HTML


