-
Paper Information
- Next Paper
- Paper Submission
-
Journal Information
- About This Journal
- Editorial Board
- Current Issue
- Archive
- Author Guidelines
- Contact Us
American Journal of Environmental Engineering
p-ISSN: 2166-4633 e-ISSN: 2166-465X
2016; 6(2): 38-51
doi:10.5923/j.ajee.20160602.02

Monitoring of Fluoride Contamination and Correlation with Physicochemical Parameters of Surface Soil and Groundwater near Tea-Garden of Thakurganj Block of Kishanganj, Bihar, India
 Abstract
 Reference
 Full-Text PDF
 Full-text HTML
1Department of Chemistry, Darshan Sah College, Katihar, Buupendra Narayan Mandal University, Madhepura, India
2Department of Botany and Plant Physiology, College of Horticulture, Noorsarai, Nalanda, Bihar Agricultural University, Bhagalpur, India
Correspondence to: Arbind Kumar , Department of Chemistry, Darshan Sah College, Katihar, Buupendra Narayan Mandal University, Madhepura, India.
| Email: |  |
Copyright © 2016 Scientific & Academic Publishing. All Rights Reserved.
This work is licensed under the Creative Commons Attribution International License (CC BY).
http://creativecommons.org/licenses/by/4.0/

Tea is the new identity of Thakurganj block of Kishanganj district, Bihar, India. Now Kishanganj is the only district in Bihar (India), where tea plantation has developed and today, it has been put on the tea map of the country. The continuous and uncontrolled use of different agrochemicals, pesticides by tea growers, might have increased the pollution rate which might have lead to cause an adverse health effect on the tea garden community. Therefore, assessment of the drinking water sources located near the small tea garden areas is almost necessary. The present study is aimed to monitor fluoride concentration and some physicochemical parameters of 36 surface soil and 36 groundwater samples near tea garden area of Thakurganj block of Kishanganj, Bihar, India. Fluoride concentration in surface soil varied from 1.11-4.9 mg/l and in groundwater varied from 0.21-3.9 mg/l. During the study, 320 people were examined, of which 48% people were affected by dental, 16.9% people were suffering from skeletal and 7.8% people were suffering from non skeletal fluorosis. Fluorosis was found to be high in males compared to females. Correlation study revealed that most of the samples were within the permissible limit but fluoride content was found to be positively correlated with pH, conductance, Cl-, SO42- and total alkalinity and negatively correlated with total hardness, Ca2+, Mg2+, NO3- and PO43-. Questionnaire survey also revealed that majority of residents of rural area were suffering from dental, skeletal and non skeletal fluorosis due to unawareness and lack of precautionary measures against fluoride. If people became aware of the impact of fluoride and use of pure and fluoride free water then, the probability of fluorosis may be minimized.
Keywords: Fluoride, Fluorosis, Physicochemical parameters, Correlation, Surface soil, Groundwater, Tea-gardens
Cite this paper: Arbind Kumar , Seema , Monitoring of Fluoride Contamination and Correlation with Physicochemical Parameters of Surface Soil and Groundwater near Tea-Garden of Thakurganj Block of Kishanganj, Bihar, India, American Journal of Environmental Engineering, Vol. 6 No. 2, 2016, pp. 38-51. doi: 10.5923/j.ajee.20160602.02.
Article Outline
1. Introduction
- Most of the human activities involving industrial and agricultural development and inadequate management of land and water resources have directly or indirectly, resulted in the degradation of hydrological environment [1]. The impact is notable on the quality and quantity of groundwater resources, fertility of soil and the stability of the land mass [2]. Pollution due to fluoride has much worldwide attention; it passes to and from air, water, soil and the living organisms through some biochemical pathways [3]. The persistence of fluoride in the soils can be the cause of various types of toxicity to plants [4] and animals, which feed the grass on such types of soils [5]. Biotite, muscovite and hornblende are the common soil minerals, that may contain a high percentage of fluoride and therefore, they would cause the accumulation of fluoride in soil [6]. In soils fluoride is usually present in the form of minerals like fluorite (CaF2), cryollite (Na3 AlF3) and fluoapatite (Ca10 (PO6)6 F2), which are little soluble, so that small amount of fluoride leaches in to groundwater [6]. Anil and Bhaskara [7] reported that the excess accumulation of fluoride in vegetation, resulted to in leaf loss, damage to fruits and the changes in the yield products. Several researchers have observed that many leaves of the plants suffering of chlorosis and necrosis, which are common symptoms of toxicity of fluoride in plants [5, 8, 9]. If grazing animal feeds on grass on such soil can result in chronic fluoride toxicity and can cause tooth and bone deformation. Crotin et al. [9] reported that high concentration of fluoride in solids in the range of 326-1085 and 372-1461mg/Kg can cause severe fluorosis in cattle and sheep respectively. The mobility of fluoride in soil is not clear. Various researchers reported that pH of soil, concentration of calcium and phosphorous in the soil and the quantity of clay materials are the distinguished factors that direct the mobility of fluoride in soils [10, 11].The occurrence of fluoride exposure in human being is mainly through drinking water, food, industrial exposure, drugs, cosmetics, pharmaceuticals and pesticide residues. Among them drinking water is the major source of daily intake [12, 13]. Soil is the medium through which plants and animals directly or indirectly depend for their nutrients and food. The persistence of fluoride in groundwater is also influenced by physicochemical parameters, availability and solubility of fluoride minerals in water and velocity of flowing water [14-16]. Apart from natural resources, phosphorous fertilizers, industries, ceramic and glass factories, aluminum smelters and combustion of coal are the artificial sources of fluoride in soil and water pollution. The excess use of phosphate fertilizers, fluoride containing pesticides and sewage sludge also contribute to the release of fluoride in water and soils from the anthropogenic sources.Excessive fluoride in drinking water can be the cause of dental, skeletal and non skeletal fluorosis [16]. The low level of fluoride concentration in drinking water (0.6-1.0 mg/L) shows beneficial effect in reducing dental carries and osteoporosis [17], while excess fluoride intake (>1.5 mg/L) may lead to fluorosis which results in thyroid problems, growth retardation and kidney damage [18]. Excess fluoride greater than 2 mg/L may lead to an increase of demineralization leading to the precipitation of calcium phosphate and calcium fluoride. Thus excess fluoride can initiate an erratic calcium metabolism which results in deformation and mottling of teeth. In fluorosis, due to substitution of active hydroxyl group by fluoride, some enzymes like enolase and pyrophosphatase etc. become inactive. Fluoride concentration greater than 3 mg/l in drinking water may cause dental fluorosis, which is shown by weakening of tooth enamel, development of brown or yellow pitches on teeth [19]. Intake of fluoride above 4-8 mg/L may lead to severe toxicity like osteosclerosis in which 50% hydroxyl groups in hydroxyapatite are replaced by fluoride in bones. It leads to skeletal fluorosis and hypercalcification. More than 10 mg/L of fluoride content in groundwater can cause crippling due to skeletal fluorosis [20, 21]. Besides dental and skeletal fluorosis, excessive fluoride intake may lead to non skeletal fluorosis like low hemoglobin levels, muscle fibre degeneration, headache, excessive thirst, skin rashes, deformities in RBCs, nervousness. It also affects reproductive system, digestive system, central nervous system and destruction of about 60 enzymes. Therefore, types and severity of fluorosis depends on the presence of fluoride concentration in drinking water, climatic conditions, continuity and duration of exposure.In April 2010, Rural Development Ministry has estimated that about 33,303 villages in 18 states and in Feb 2010, Bihar Government reported that about 8,188 villages in 11 districts have excess fluoride in water, indicating that endemic fluorosis has emerged as one of the most alarming public health problem of our country. The use of pesticides, weedicides and agrochemicals by tea growers for the growth and the rate of production would have generated a lot of concern for public health and environmental pollution. As per literature review, no work is done on fluoride contents. in soil and in groundwater resources near the small tea garden areas of Thakurganj block. Hence the objective of this work was to determine the level of fluoride in surface soil and of groundwater near the tea garden areas of Thakurganj block and correlation with some other physiochemical parameters.
2. Methodology
2.1. Study Area
- Thakurganj is the second largest tehsil in Kishanganj district, Bihar state, India. It is situated at latitude of 26° 27′ to 26° 45′ north and longitude 88° 08′ to 88° 13′ east (Figure 1) and has an average elevation of 82 meters (269 feet). Thakurganj shares boundaries with neighboring country of Nepal, and the nearby Utter Dinapur and Darjeeling district of West Bengal. Mahananda, Kankai, and Machi are the Main Rivers that flow through Thakurganj of Kishanganj district. It has many industrial companies, few of them are tea factories, tea processing machinery shops, brick making industries and other types of agriculture related shops. The climate of the district is humid with maximum of 400C in May and minimum of 50C in January. Generally there are three seasons; winter, summer and rainy. The average rainfall is 2250 mm of which 80% occurs during monsoon. The climatic conditions of this district are suitable for tea cultivation.
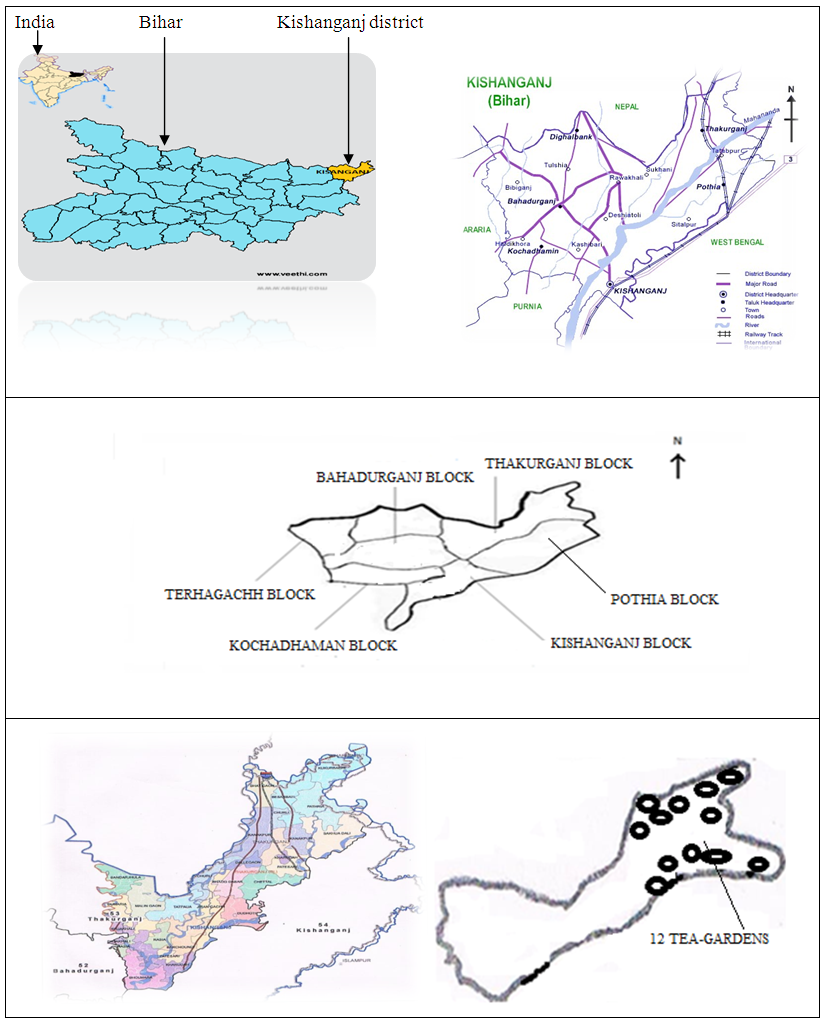 | Figure 1. Sampling location |
2.2. Tea-Garden
- Tea-Garden in Kishanganj district certainly sound amazing, but is a reality. There are acres and acres of lush gardens in Thakurganj, Photia and Kishanganj blocks of Kishanganj district. Tea plantation has made quantum jump in Kishanganj district in the early part of 1990s. Now Kishanganj is the only district in Bihar, where tea plantation has developed and today, Bihar has been put on the tea map of country. The development of tea plantation in this district is not to originate very large employment opportunities, but could to invert the migration of workers form Bihar and increase the income level of the rural people. Today green tea leaves grown in the district are now in high demand and has thrown a challenge to the states west Bengal and Assam which are traditional tea growing states of India.
2.3. Collection of Samples
- Groundwater samples were collected in one liter screw capped pre cleaned polyethylene bottle, from thirty six different locations (hand pumps, open wells, tube wells) near small tea garden areas of Thakurganj block, Kishanganj district during June-January 2014-15. Hand pump and Tube well were operated for 5-10 minutes before collection to flush the stagnant water inside the tube and get fresh water in accordance with described sampling methods (22, 23) and stored in ice box. Each polyethylene bottle was thoroughly cleaned and rinsed with water being sampled. Preservation of samples was done as per standard procedure (APHA). Thirty six soil samples were also collected from 12 small tea gardens from the same area. The samples were taken from 1-20 cm depth from each area. Each soil sample was kept in separate plastic bags and taken to the laboratory and dried for at least three hours. Each soil sample was ground to fine particles and sieved with mesh size of less than 2 mm. About 40 g of each soil sample was digested with aqua regia and digested sample was cooled and then filtered into a 100 ml volumetric flask using Wahatman No. 1 filter paper. After filtration the extracts were analyzed for fluoride and other physicochemical parameters by the same procedure. Sample from each location was collected two times at 30 days interval to determine the average value of the results, which were compared with drinking water standards of BIS [24] and WHO [25].
2.4. Determination of Physicochemical Parameters
- Various physicochemical parameters in groundwater like pH, electrical conductivity, fluoride, chloride, sulfate; nitrate, phosphate, total alkalinity, total hardness, calcium and magnesium were determined by standard procedure. Temperature, electrical conductivity and pH were measured immediately at the spot after the collection of samples with the help of Water and Soil Kit. Total hardness of water (mainly due to Ca++ and Mg++) was analyzed by EDTA titrimetric method in presence of metal ion indicator erichrome black-T (EBT) [26]. The alkalinity in drinking water is mainly due to the presence of carbonates and bicarbonates, which was determined by acidimetric titration [27]. Sulfate was measured by gravimetric method as recommended by UNEP [28] earlier given by APHA [29].
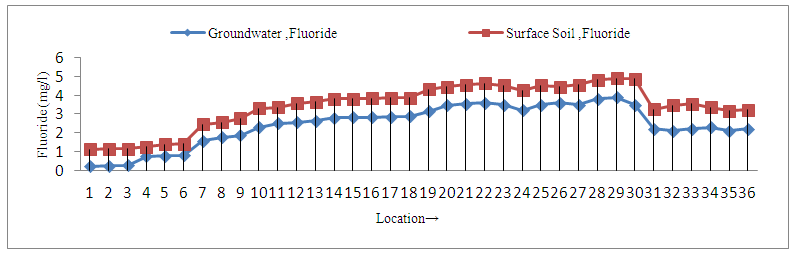 | Figure 2. Fluoride concentration in Groundwater and Surface Soil sample around tea garden areas |
3. Results and Discussion
3.1. Assessment of Physicochemical Parameters
- The present study reveals that concentration of fluoride and pH were found to be higher in all sites of surface soil samples than groundwater samples, whereas all other physicochemical parameters of surface soil were lower than groundwater samples in and around small tea garden areas (3a, 3a and 4a, 4b). On the basis of occurrence of the fluoride contents, all sampling stations were categorized as Category I-Low fluorotic areas, Category II-Moderate fluorotic areas and and Category III- High fluorotic areas.
3.1.1. Low Fluorotic Areas
- All the samples of groundwater and surface soil in and around tea garden number 1 and 2 were found to be low fluorotic i.e. less endemic areas. The fluoride content varies from 0.21-0.81 mg/l in groundwater whereas 1.11-1.41 mg/l in surface soil samples. The minimum concentration, 0.21 mg/l in groundwater and 1.11 mg/l in surface soil sample at S1 of tea garden no.-1 and maximum, 0.81 mg/l in groundwater and 1.41 mg/l in surface soil sample at site S6 of tea garden no. - 2. The present investigation also reveals that all six sites of groundwater samples have fluoride concentration below 1.0 mg/l (Figure 1), which was maximum desirable limit as recommended by BIS. The concentration of fluoride 1.0 mg/l is beneficial for dental enamel especially for children below 10 years. Therefore, there is no possibility of fluorosis in these habitations.
3.1.2. Moderate Fluorotic Areas
- Out of 12 small tea gardens 4 tea gardens (3, 4, 11 and 12) were under moderate fluorotic i.e. moderately endemic area. In these areas fluoride concentrations varied from 1.57-2.55 mg/l in groundwater and 2.45-3.55 mg/l in surface soil samples. Out of 36 samples of groundwater samples 33% samples falls in Category-II, in which fluoride concentration was above 1.5 and below 3.00 mg/l (Figure 1), a maximum permissible limit as recommended by BIS and WHO. At this concentration, teeth lose their shiny appearance and chalky black, grey or white patches develop known as mottled enamel [36]. Dental fluorosis is common in these habitations. In some cases, the pre stage of skeletal fluorosis may occur after age of 45 [37].
3.1.3. High Fluorotic Areas
- Tea gardens number 5, 6, 7, 8, 9 and 10 come under high fluorotic i.e. highly endemic area and fall in the category III. In these areas fluoride concentration varied from 2.5-3.9 mg/l in groundwater and 3.66-4.9 mg/l in surface soil samples. In 18 sites (50%) of 12 small tea gardens fluoride concentration was above 2.5 mg/l and below the 4 mg/l (Figure 1) . The intake of fluoride /day by the population in this habitation is very high and cause dental as well as skeletal fluorosis [38, 39]. High fluoride in soil can affect essential plant minerals availability and uptake which is the cause of hindrance of plant growth. Excess fluoride tends to affect the soil pH, it makes the soil more acidic by forming hydrofluoric acid due to interaction of fluoride and hydrogen ion. In addition, the high fluoride concentration in the soil can cause certain effect during metabolism in crop such as; decrease in oxygen uptake, reduction in assimilation rate, photosynthesis, inhibition of starch synthesis, inhibition of pyrophosphatase, injured cell membrane, synthesis of fluoroacetate the most poisonous organic compound, abnormal fruit development, chlorosis and leaf distortion [4]. High concentration of fluoride in the cultivated soil during the rainy seasons is washed by rain water into the stream, irrigation ponds and dams where ingestion by aquatic plant and animal can occur. The intensity of fluorosis in the residents around small tea garden areas were found to be the proportional to the fluoride levels in surface soil samples. Due to excess use of fertilizers, pesticides and agrochemicals in the tea garden, soil and groundwater resources of the tea garden are contaminated and degraded. The phosphate fertilizers and minerals present in soil and groundwater undergo dissolution and increase the fluoride level in solid and water resources. The residents around tea garden were affected by fluorosis because of the fact that the people of these areas used locally available paddy, vegetables and fruit which contain more fluoride level. The persistence of high concentration of fluoride in drinking water at other areas of Kishanganj district has been reported in our previous work [40]. High level of fluoride in West Bengal adjacent to Kishanganj district has also been reported by several researchers [41-43]. It is noted that fluoride in fluoride affected areas and other areas adjacent to Kishanganj district is in the same geological set up. It is assumed that fluoride bearing minerals may contribute high fluoride content in groundwater during the course of rock type minerals such as fluorspar, fluorite, apatite, rock phosphate and phosphites. The use of heavy amount of chemical fertilizers, weedicides, pesticides and other chemicals by tea growers contribute high fluoride concentration in water resources. It has been found that in some tea garden areas the concentration of fluoride is low, due to dilution by rain water, as this area is a rain shadow area within North-East India.
3.2. Basic Statistical Analysis
- Basic analytical data for the fluoride and other important physicochemical parameters of the groundwater and surface solid samples is presented in Table 1 and 2, in term of minimum, maximum, mean, median, sum of the values (Ʃn) sum of square values (Ʃn2), population standard deviation (σn), sample standard deviation (σn-1) and variation. The pH of the groundwater samples varied from 6.7-9.5 with mean value standing at 8.2, whereas for the surface soil samples were found to be in the range from 7.2-9.7 with the mean value standing 8.76.The maximum value of pH were noted at S20, S21, S22, S23, S24, S29, S30, S31 (Figure 3a) of ground water near the tea garden. It indicates that slightly alkaline condition in most of the cases, which favors the dissolution of fluoride bearing minerals in groundwater. Similarity between ionic size of fluoride and hydroxyl ion they replace each other at higher pH which may be also the cause of high concentration of fluoride in water. The mean conductivity value of groundwater was recorded to be 595 µS/cm, while that of surface soil was found to be 450 µS/cm, a much lower value than water samples. All the samples of groundwater and surface solid were under the permissible limit of WHO. The alkalinity values were noted to range from 351-519 which was the maximum than desired limit of BIS (200 mg/l) and under the permissible limit of WHO (500 mg/l). The mean value of alkalinity of surface solid sample was found to be 343.77 mg/l with sample standard deviation 48.43 mg/l and population standard deviation 47.75. Similarly the chloride ion concentration varied from 31.4-145.5 mg/l and 21.5-115.9 mg/l in groundwater and surface solid samples respectively. The higher value of chloride ion was found at S28, S29, and S30 in both groundwater and surface soil samples. It may be due to accumulation of salt concentration (Cl-) especially from evaporation or loss of water in unsaturated zone.
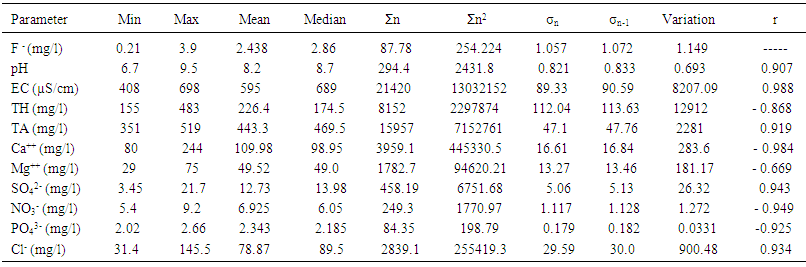 | Table 1. Basic statistics for the physicochemical parameters of groundwater samples near tea garden areas |
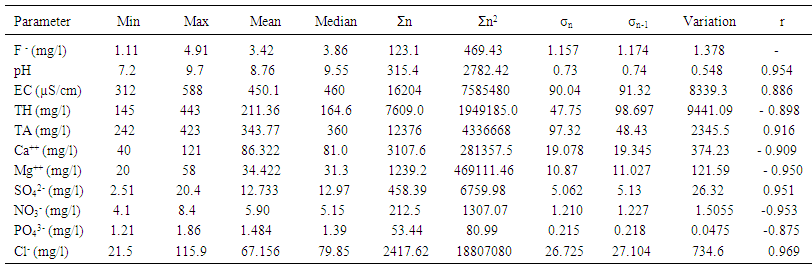 | Table 2. Basic statistics for the physicochemical parameters of surface soil samples near tea garden areas |
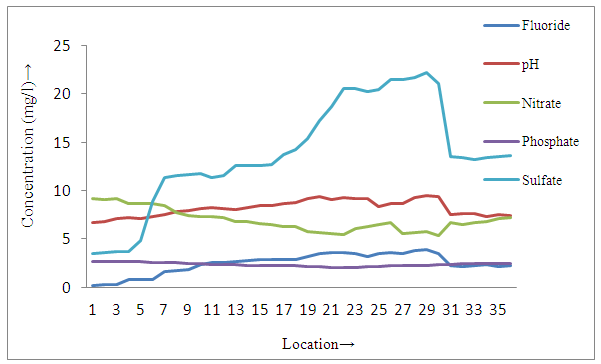 | Figure 3a. Distribution of different parameters in groundwater samples near tea garden |
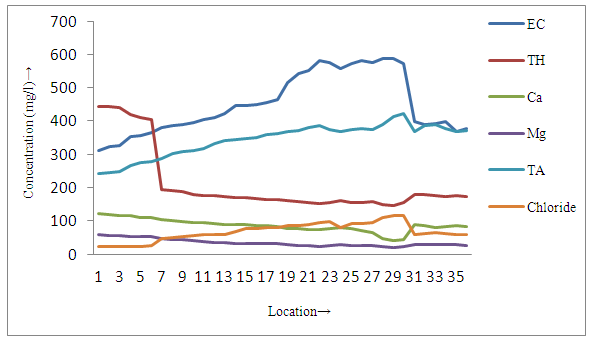 | Figure 3b. Distribution of different parameters in groundwater samples near tea garden |
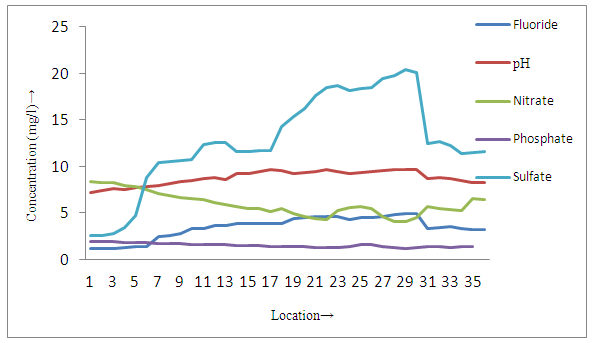 | Figure 4a. Distribution of different parameters in surface soil samples near tea garden |
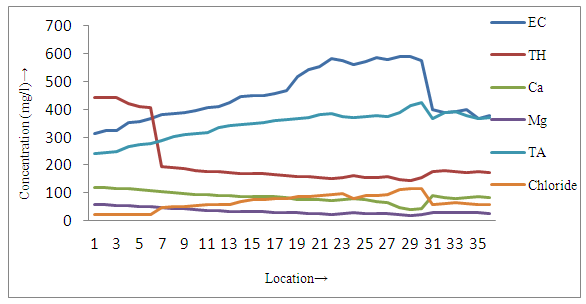 | Figure 4b. Distribution of different parameters in surface soil samples near tea garden All parameters were measured in mg/l except pH and electrical conductivity (µS/cm) |
3.3. Correlation Coefficient for Physicochemical Parameters
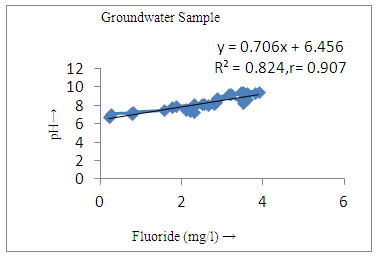
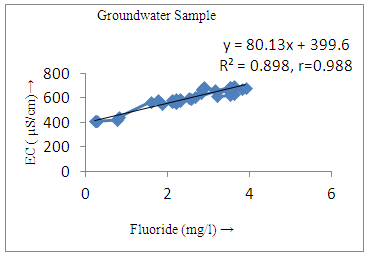
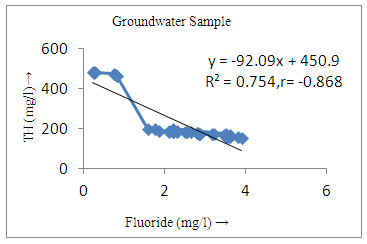
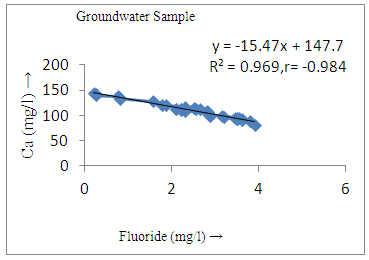
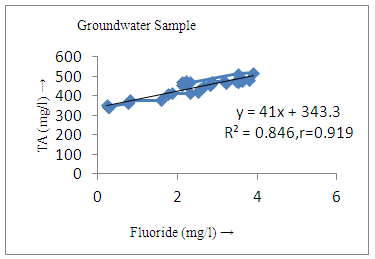
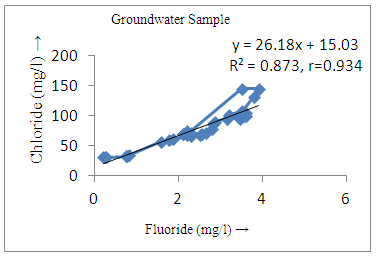
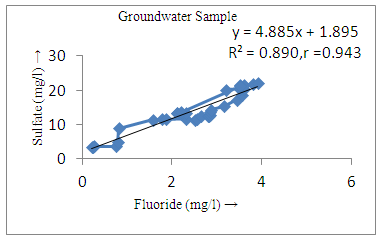
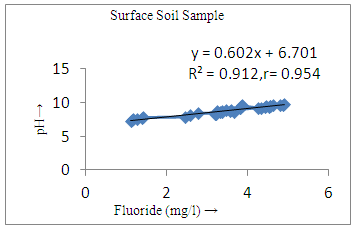
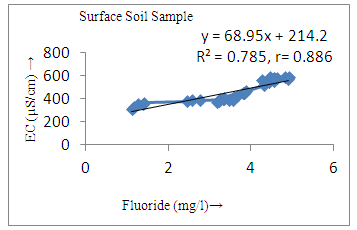
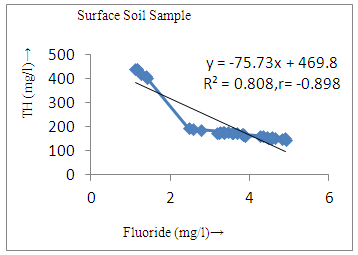
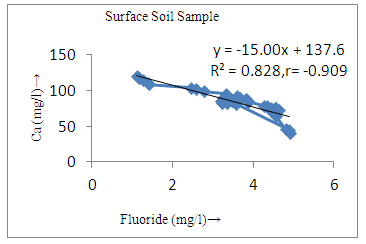
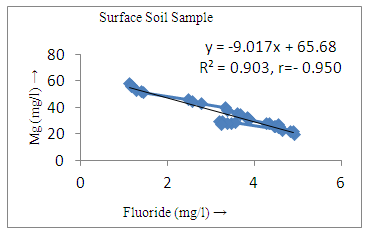
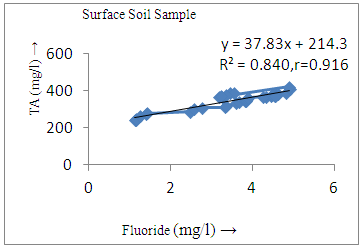
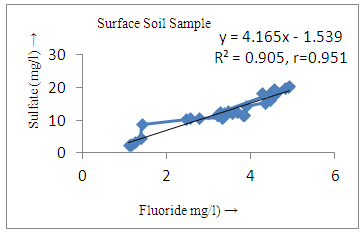
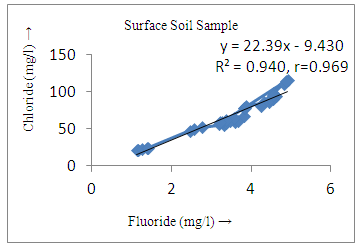
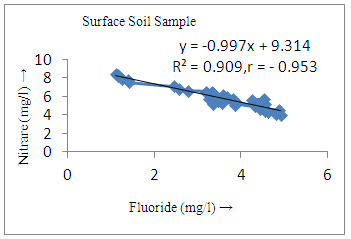
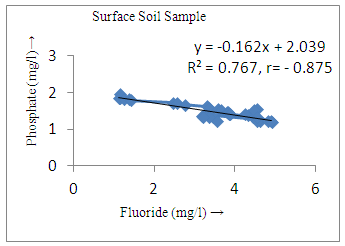
- The controlling mechanism of fluoride concentration in surface solid and groundwater samples can be understood from correlation coefficient of fluoride with pH, calcium, magnesium, pH, alkalinity and phosphate. The relation between fluoride-pH (r=0.954, 0.907) and fluoride-alkalinity (r = 0.916, 0.919) showed the significant positive trends in both surface solid and groundwater (Figure 5a, 6a 5f and 6f). This indicates that due to weathering and leaching of fluoride minerals in rock formation under alkaline environments lead to the increase of fluorite in the groundwater [44, 45]. When pH >8, fluoride concentrations commonly exceed 1.0 mg/L. Saxena and Ahmed [46] reported that an alkaline pH ranging from 7.4-8.8 resulted in high fluoride concentration (1.7-6.1 mg/L) in groundwater sources in India. Alkaline pHs which increased the solubility of fluoride-bearing formations likely contributed to increased fluoride concentrations at S20 S21, S22, S23, S24, S25, S26, 27, S28, S29, S30 (Figure 1) of both surface solid and groundwater samples near tea garden areas. Similar positive correlation was also shown by several researchers [47, 48]. Another significant correlation was observed between fluoride and chloride within r value of 0.934 (Figure 5g) in groundwater and of 0.969 in surface solid (Figure 6h). Chloride in water sources resulted from agricultural activities, industries and chloride rich rocks. High chloride concentration was due to invasion of domestic waste and disposal by human activities [49]. High chloride concentration in drinking water may lead to laxative effect [50]. Fluoride was also found significantly to correlate with sulfate ion with an r value of 0.943 (Figure 5h) in groundwater and 0.951(Figure 6g) in surface solid samples. Agricultural activities were also sources of high SO42- ion in groundwater in and around tea garden areas. The conductively also showed positive correlation with fluoride in groundwater (r = 0.988) and in surface solid samples (r = 0.886) as shown in Figure 5b and 6b.The correlation study revealed that high level of fluoride in water was associated with low calcium content and high pH values. The high pH of water displaces fluoride ions from mineral surface [51]. From correlation study it was observed that Ca2+ (r = -0.984, -0.909) and Mg2+ (r = -0.669, -0.950) showed negative correlation with fluoride (Figure 5d, 6d and 5e, 6e). This was probably due to low solubility of fluoride with these ions [52]. Lower concentrations of calcium increased the solubility of CaF2, with increase in the concentration of fluorides in groundwater. The reaction between Ca++ and F- ions indicated that the fluoride concentration was controlled by equilibrium of fluorite [53]. When the water was saturated with respect to fluorite, low calcium concentration lead to higher fluoride concentration [54]. Higher fluoride concentration was therefore expected in groundwater from aquifers with low calcium concentrations. The results generally showed that increase in calcium was associated with decrease in fluoride and vice versa. TH also showed negative correlation (r = -0.868, - 0.898) with fluoride (Figure 5c, 6c) because the total hardness was due to the presence of calcium and magnesium carbonate and bicarbonate. The decrease in hardness, resulting in higher fluoride concentration contributed to calcium complexion effect. The dissolved salts and minerals present in the soil around tea gardens might increase the concentration of total hardness in water bodies near the gardens. The uses of chemical fertilizers by tea growers directly or indirectly affected the concentration of inorganic chemicals in water which effected the concentration of TH in water. Nitrate (r = -0.949, -0.953) and phosphate ions (r = -0.925, -0.875) also showed negative correlation with fluoride in groundwater (Figure 5i, 6i and 5j, 6j). The phosphate ion in the water samples was due to anthropogenic activities. geogenic formation and dilution of minerals from rock and soil [52]. The drinking water contaminated by nitrate ion in water samples resulted from the leaching of nitrate present on the surface of percolating. Therefore ingestion of the high fluoride content in the soil couple with uptake of the underground water within the study area by the plants and animals could have potential to cause fluoride toxicity. It is therefore important that farmers and tea growers should check on the fluoride ion levels in cultivated soil using fertilizers which could contribute an additional fluoride to such soil.
 | Figure 5a. Correlation between pH and fluoride |
 | Figure 5b. Correlation between EC and fluoride |
 | Figure 5c. Correlation between TH and fluoride |
 | Figure 5d. Correlation between Ca and fluoride |
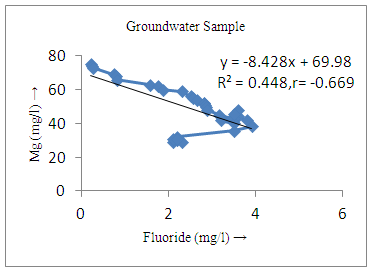 | Figure 5e. Correlation between Mg and fluoride |
 | Figure 5f. Correlation between TA and fluoride |
 | Figure 5g. Correlation between chloride and fluoride |
 | Figure 5h. Correlation between sulfate and fluoride |
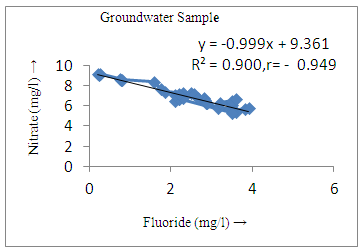 | Figure 5i. Correlation between nitrate and fluoride |
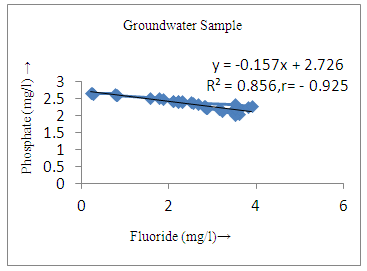 | Figure 5j. Correlation between phosphate and fluoride |
 | Figure 6a. Correlation between pH and fluoride |
 | Figure 6b. Correlation between EC and fluoride |
 | Figure 6c. Correlation between TH and fluoride |
 | Figure 6d. Correlation between Ca and fluoride |
 | Figure 6e. Correlation between Mg and fluoride |
 | Figure 6f. Correlation between TA and fluoride |
 | Figure 6g. Correlation between nitrate and fluoride |
 | Figure 6h. Correlation between nitrate and fluoride |
 | Figure 6i. Correlation between nitrate and fluoride |
 | Figure 6j. Correlation between phosphate and fluoride |
3.4. Evaluation of Impact of Fluorides on Human Halth based on Questionnaire
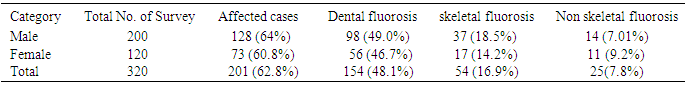
- The present survey revealed that out of 320 people, 201 (62.8%) people were suffering dental, skeletal or non skeletal fluorosis. The disease incidence was more in males 128(64%) than females 73 (60.8%). (Table 3)
|
3.4.1. Dental Fluorosis
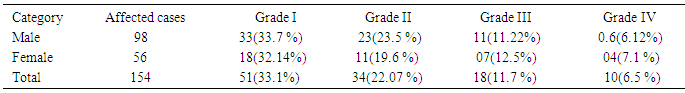
- Among the different clinical signs and symptoms of dental fluorosis, out of 154 patients 51 (33.11%) people had white opacities, faint and yellow line of grade I, 34 (22%) people had brown stains of grade II, 18 (11.7%) people had brown line, pitting and chipped off edges of grade III and 10 (6.5.0%) people had brown black and/ loss of teeth of grade IV, whereas 119 (37.2%) people were having healthy teeth as shown in Table 3. The occurrence of dental fluorosis of grade III and IV was found more in female and grade I and II in male. Earlier studies have proved that the direct link between the degree of dental fluorosis and the amount of fluoride in groundwater in the respective communities and countries. Choubisa [55] reported prevalence of dental fluorosis to be (45.7%), Bharthi et al. [56] (35%), Shourie [57] (36.5%), Vacher [58] (51.57%), Thaper [59] (59.1%), Ramchandran [60] (66.2%) and Tiwari and Chawala [61] (81.6%).
3.4.2. Skeletal Fluorosis
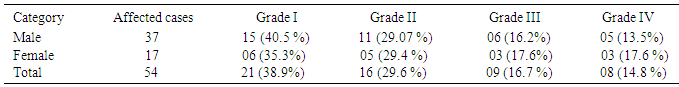
- Similarly distribution of degree of skeletal fluorosis was found high in males 37 (18.5%) compared to females 17 (14.2%). Table 5 showed that different grade of skeletal fluorosis, out of 54 patients 21 (38.9 %) people had mild-generalized bone and joint pain of grade I, 16(29.6%) people had moderate-generalized bone and joint pain, back pains and stiffness of back of grade II , 9 (16.7%) people had stiffness and rigidity, restricted movement of the spine and joints of grade III and 8 (14.8%) people had deformities of spine and limbs, knock-knees, crippled or in bed ridden state of grade IV. The prevalence of skeletal fluorosis of grade I was found more in male, whereas grade II was equally occurred among males and females and grade III and IV were more in female. Several studies in the past have also shown the effect of fluoride as skeletal fluorosis. Choubisa [55] (22%), Bharthi et al [56] (17%) and Majumdar [62] (23.8%), showed various degree of skeletal fluorosis.
|
|
3.4.3. Non Skeletal Fluorosis
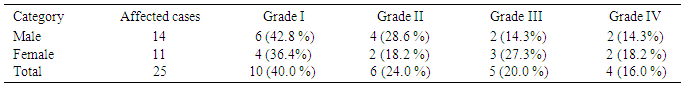
- Out of 320 examined people 25 (7.8%) was suffering from non skeletal fluorosis, among which 11(9.2%) were females, slightly higher than males 14 (7.01%). On survey it was found that some common patients were suffering from different grades of non skeletal fluorosis. Table 6 showed that out of 25 patients 10 (40%) had pain in stomach, 6 (24%) had loss of appetite 5 (20%) had muscle weakness and 4 (16%) had polyurea/polydispia and depression. The occurrence of non skeletal fluorosis of grade I and II was found more in male and grade III and IV in female.
|
4. Conclusions
- Finally it is concluded that in the present study, fluoride concentration in surface soil varied from 1.11- 4.9 mg/l and in groundwater varied from 0.21-3.9 mg/l near 12 tea garden areas of Thakurganj block of Kishanganj, Bihar, India. A linear correlation of fluoride with other physicochemical parameters was very useful to get fairly accurate idea of the quality of drinking water. The continuous and uncontrolled use of different chemicals in the tea garden areas of the region might increase the pollution rate which may lead to cause an adverse health effect on the tea garden community. So, awareness among the small scale tea growers and workers is to be imparted regarding, use of fertilizers and pesticides. Questionnaire survey results generally indicated that majority of residents of the tea gardens were suffering from dental, skeletal and non skeletal fluorosis due to unawareness and lack of precautionary measures against the impact of fluoride. Therefore this work will be helpful for students, teachers, scientists, researchers and governmental and non governmental agencies to take correct and appropriate steps by creating awareness.