E. C. Merem1, J. Wesley1, P. Isokpehi1, E. Nwagboso2, S. Fageir1, S. Nichols1, M. Crisler1, M. Shenge1, C. Romorno1, G. Hirse1
1Department of Urban and Regional Planning, Jackson State University, Jackson MS, USA
2Department of Political Science, Jackson State University, Jackson MS, USA
Correspondence to: E. C. Merem, Department of Urban and Regional Planning, Jackson State University, Jackson MS, USA.
| Email: |  |
Copyright © 2016 Scientific & Academic Publishing. All Rights Reserved.
This work is licensed under the Creative Commons Attribution International License (CC BY).
http://creativecommons.org/licenses/by/4.0/

Abstract
The Pacific coastal states continue to be at risk from both locally and distantly generated tsunamis. At a time of intense ecological uncertainties, regional assessment of tsunami hazards in the region is not only vital, but it offers opportunity in these areas to gauge the level of readiness needed in mitigating eventual disasters. While there is a growing anxiety to the next big seismic catastrophe in the Pacific Northwest states, very little has been done to adequately assess the vulnerability to future tsunamis. Accordingly, this research uses a mix-scale method of descriptive statistics technique connected to GIS and spatial images to evaluate the impending risks in the study area. The results point to widespread occurrence of earth quakes and the continual exposure of the region to the threats of potential tsunamis. The gravity of the risks is manifested by the relative prevalence and likelihood of underwater tremor in the area than other regions of the US. Additionally, the potential economic, ecological and physical impacts show risks of fatalities, destruction of infrastructure including roads and bridges (in California and Oregon) coupled with over hundred billion dollars in damages. The spatial analysis captured the dispersion of landslides, ground movement, liquefaction threats in coastal Oregon and the probable rupture of the Columbian river bedrock followed by flooding and erosion of hundreds of dams. Other aspects of the GIS analysis showed spatial concentration of various elements of growth known to influence the threats under different periods. Aside from limited efforts to minimize the dangers, impediments against the mitigation of tsunami risks remain in the region. With the risks attributed to physical and socio-economic elements of unstable geology, infective policy, population growth and development as well as weak and obsolete plans. The paper offered suggestions ranging from the strengthening of policy to continued need for spatial analysis of tsunami threats in the region as remedies.
Keywords:
Pacific Northwest, Tsunami hazards, GIS, Assessment, Seismic disaster, Region, Factors, Fatalities
Cite this paper: E. C. Merem, J. Wesley, P. Isokpehi, E. Nwagboso, S. Fageir, S. Nichols, M. Crisler, M. Shenge, C. Romorno, G. Hirse, Assessing the Vulnerability of the US Pacific North West Region to Tsunami Hazards, American Journal of Environmental Engineering, Vol. 6 No. 1, 2016, pp. 3-21. doi: 10.5923/j.ajee.20160601.02.
1. Introduction
Conceptually, a tsunami is a series of long waves of 50 feet or more in height generated by an abrupt displacement of a large volume of water. On many occasions, they are activated by submarine earthquakes and volcanic eruptions that devastate the adjoining coastal communities. Most Tsunamis are usually classified as either local or distant. Locally generated tsunamis have minimal warning times and may be accompanied by damages from the associated earthquake through ground shaking, surface faulting, liquefaction, or landslides. Distant tsunamis may travel for hours before striking a coast line [1, 2]. Considering their consequences, local tsunami problem is of a particular concern to coastal communities along the Pacific coast of Alaska and in the Pacific Northwest from Northern California to the state of Washington. A case in point is the major tsunami produced by the 1964 Alaska earth quake. This was a generated by a wide 700 km –long zone of sea floor meandering along the Alaskan – Aleutian subduction zone. Afterward, tsunami waves arrived at Kodiak Island following the earth quake in just under thirty minutes. The ensuing local shock waves produced by the submarine volcano precipitated most of the causalities during the seismic event. Accordingly, NOAA has determined that the Pacific coasts of Alaska, California, Hawaii, Oregon, and Washington face the greatest tsunami risks. With the vulnerability of the Pacific coast to such hazards, limited information exists on the likely impacts of a tsunami in those areas [3]. Some of these areas lack inundation maps and spatial information tools showing the potential extent of tsunami flooding in communities while the others are still using unreliable maps. The assessment of likely impacts on people and infrastructure among the states has been limited, in part due to a lack of tsunami loss estimation software for floods and other hazards. Even though federal warning centres have the capacity to quickly detect tsunamis, false alarms and the limitations of these warning systems hamper their effectiveness. Just as 16 previous warnings were not followed by destructive tsunamis on US shores, citizens would not only run the risk of ignoring future notices, but such limitations may impede timely response to real dangers within communities [4]. While the United States is not subject to frequent tsunamis, the impact of just one tsunami can be truly catastrophic – as shown by the December 2004 Indian Ocean tsunami [5]. Going by its impact, questions were raised about the vulnerability and readiness of US coastal cities for such an event. The magnitude of the tsunami led to the death of more than 200,000 people along with the displacement of over 1.5 million and significant damages in 12 countries in Asia and East Africa. Although the earth quake that triggered the tsunami was immediately detected, the existence of a tsunami was not quickly confirmed and a warning message was not delivered to those in the tsunamis path. As a result, casualties and damages occurred not only near the earthquake source where communities had little time to react, but also in coastal communities that were impacted hours later. Another dimension to the issue is that most people in California see the St Andreas Fault as the likely source of the next big one, but experts point to the Cascadian zone as the biggest threat to the west coast. Not too long ago in 2011, a mega –magnitude 9 earth quake hit the Tohoku region of north western Japan, unleashing one of the most destructive tsunamis with over 15,000 people dead [6]. Now scientists are bringing our attention to the threats of the Cascadian subduction zone with a big warning. Such tectonic time bomb has the potentials of causing a massive tremor. The 2011 Japan tsunami as well as other natural disasters like hurricane Katrina has raised concerns about better responses to any eventual tremor on the Cascadian fault lines in places like California, Oregon, and Washington. Concerned about the potential impact of these seismic hazards to the west coast, many authors such as Lin [7], Thompson [6], and Folger [8] have been posing the question as to when would the next big one strike? Notwithstanding these concerns, the US Pacific coastal states continue to be at risk from both locally and distantly generated tsunamis. Being a region where over half a million people live, work, and travel each year through potential inundation prone areas along the Cascadia sub-duction zone (CSZ). During the past two centuries, all five states have been hit by tsunamis which inflicted considerable causalities. More so, no studies have been conducted to assess the imminent or potential risks inherent in the area. While current analyses have shown the capability of impending tsunamis in inflicting substantial havoc on the environment, many states in the PNW still lack effective mechanisms in mitigating the problems. Without a comprehensive analysis of the anticipated dangers rooted in a mix scale approach connected to GIS to inform decision making and planning, environmental systems will suffer incalculable damages. Accordingly, this research focuses on the assessment of tsunami hazards and the vulnerability of the PNW region. There is emphasis on the issues, trends, impacts, factors and mitigation efforts. The research has four objectives. The first aim is to analyse the current issues in tsunami hazards. The second objective assesses the risks posed to the PNW region while the third objective is centred on the evaluation of factors fuelling the impending hazards. The fourth and last objective focuses on the identification of mitigation measures and the design of a decision support tool for policy makers. The paper has five sections with the introduction as the first, followed by the methods and materials in the second part. The third section describes the results in terms of environmental impact assessment, factors, and efforts while sections four and five highlight the discussion and conclusion.
2. Methods and Materials
The study area of the US Pacific North west region in Figures 1-2 contains the 5 states of Oregon, California, Washington, Hawaii and Alaska. The region boosts of a diverse climate in a geologically active zone with live volcanoes and seismic faults. 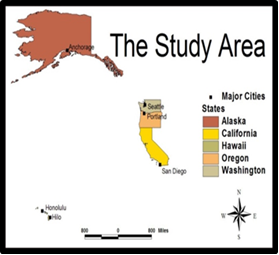 | Figure 1. The Study Area with Cities |
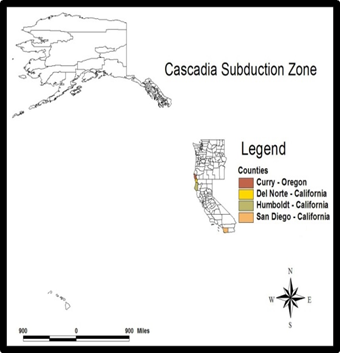 | Figure 2. Some of the Areas under Threat around the CSZ |
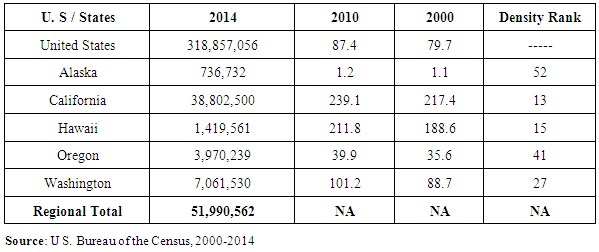
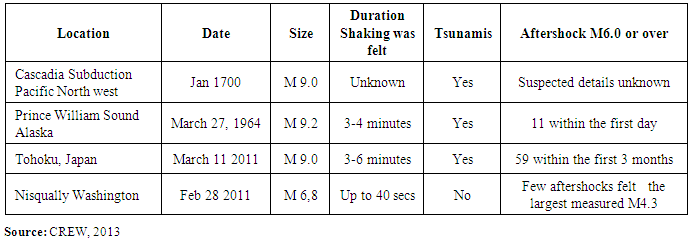
With its diverse geographic region, the area has many mountain ranges covered with a tapestry of green forested land areas and a pristine environment made of lakes and rivers with an outlet to the Pacific Ocean [9]. Considering the nature of the ecology, some of its cities (Portland, Eugene, and Seattle are ranked among the top eight greenest cities in the country [10]. Situated along the Cascadian subduction zone (CSZ) with a population of over 51 million in 2014 [11], some of the states in the region have a nationally ranked population density attributes that are represented within the top 27 in the US (Table 1). Being an active geologic zone as shown in Table 2, the CSZ is a very long sloping fault that stretches from mid Vancouver Island to Northern California (Figure 2). Because of the very large fault area, the CSZ could produce a very large earth quake capable of wreaking heavy damages. Although no great tremor has ruptured the zone in recent historical times, there is increasing evidence that a number of earthquakes in the 8.5 to 9 range have occurred within the past 2000 years, generating tsunamis that caused extensive flooding in the coastlines of Washington, Oregon, and California. Table 1. Population and Density 2000-2014
 |
| |
|
Table 2. Examples of Great Subduction Zone Interplate Earthquakes
 |
| |
|
Just as the shorelines of the major rivers in the region including the Columbian river would be at a very big risk of flooding. The proximity of the Southern portion of the Cascadia subduction zone to the coast line makes it likely that tsunami waves will arrive in Humboldt and Del Norte counties of California, Curry County and Oregon coasts only a few minutes after such an earthquake. Along the central and northern parts of the Cascadia subduction zone, waves might arrive in as little as 20-40 minutes after a large earthquake [4]. In terms of the individual areas, according to NOAA, the general areas most threatened by both distant and local tsunami hazards are Hawaii and the west coast states of California, Oregon and Washington, whereas Alaska is prone to primarily local tsunamis. Known for its pristine environmental features of sensitive wetlands, large rivers, fish and wildlife streams and forested areas, in the past several years, population pressures in the coastal zones of the study area are resulting in unprecedented shoreline development, putting residents, tourists and property at increased risk from giant tidal waves called tsunamis. Since 1946, six tsunamis have killed nearly 500 people and damaged hundreds of millions of dollars of property in Alaska, Hawaii and along the west coast of the United States. Of these areas Hilo, Hawaii suffered seven significant tsunamis in the last century. Along these lines, crescent city California experienced two damaging tsunamis in four years between 1960 and 1964. While many of the communities at risk in the Pacific region have no recent experiences with tsunami damage, there could be the danger of a false sense of security regarding the hazard. Accordingly, hundreds of cities in the pacific states of Alaska, California, Hawaii, Oregon, and Washington remain susceptible, while nearly a million residents of the cities would be inundated by tsunami [1]. In the process, the United States Pacific coastal states continue to be at risk from the menace of tsunamis [1, 4]. Throughout its history, the study area has been struck by tsunamis with very grave consequences. This susceptibility can be minimized by effective hazard impact analysis and plans, mitigation measures and the construction of more hazard resistant structures such as steel reinforced concrete buildings. Worried about the impacts of tsunami hazards on the environment and infrastructure, hazard assessment is emerging as a high priority in cities within the region. Aside from a few exceptions, hazard plans in the area are quite weak and suffer from lack of coordination [12]. In the face of these limitations, assessing tsunami threats in the region using geo-spatial analysis would usher in an effective road map for crafting effective mitigation measures.
2.1. Methods Used
This paper stresses a mix scale approach involving the integration of primary and secondary data provided through government sources and data bases from other organizations. The sources consists of the United States Geological Survey (USGS), Oregon Department of Geology and Mineral Industries, National Oceanic and Atmospheric Administration (NOAA), the Government of Oregon, The Federal Emergency Management Agency (FEMA) and the Government Accountability Office (GAO), the cities of Seattle, Portland, Sandiego, and the University of Maryland Online Free data unit. Accordingly, some of the spatial data and images used in the research were procured through the United States Geological Survey (USGS) and other agencies. Part of the mix-scale approach also involves the use of descriptive statistics connected to GIS mapping, coupled with the visualization of areas under threat with demographic and socio-economic elements and the display of images showing the threats of tsunami in some parts of the study area. The methodology also drew largely from a keyword literature search for the relevant documents on tsunami, Pacific North west, earthquakes, natural disaster and western region in the study area and access to archives of the states and federal agencies dealing with tsunami in the US.
2.2. Identification of Variables, Data Acquisition and Design
The first step involves the identification of variables needed to assess tsunami hazard at the regional level. The variables consist of socioeconomic and environmental information, including the number cities under threat, population, population change, income, poverty level, density of population, hazard level, number of earthquakes, regions, repair time, economic impacts, critical infrastructure, and services, location of earth quake, ranks, distant and local tsunamis, magnitude of earth quake and tsunamis. This process continued with the design of data matrices for variables covering the various periods from 2000, 2010, 2008, 2014 and others. In addition, to the design stage, access to databases and abstracts that are presently available within the Federal and state regional archives in the pacific North west, the United States Geological Survey, (USGS); the Federal Emergency Management Agency (FEMA), the Oregon Department of Geology and Mineral Industries, the United States National Oceanic and Atmospheric Administration (NOAA); the Government Accountability Office (GAO), the University of Maryland free Online Data Services and host of other organizations facilitated the search and the design process.
2.3. Stage 2: Step 2: Data Analysis and GIS Mapping
In the second stage, descriptive statistics and spatial analysis were employed to transform the original socio-economic and land-use data into relative measures (percentages/ratios). This process generated the parameters for assessing the extent and nature of tsunami threats. This was facilitated by measurements and comparisons of the trends over time. While this approach allows for a display of the levels, probability, magnitude, locations, tsunami types, ranking, the scales and inherent threats, the tables highlight population, risk centres, or regions, income levels, frequency of earth quakes, the economic costs, physical infrastructure under threats and the natural variables. The remaining steps involve spatial analysis and output (maps-tables-text) covering the study period, using ARCVIEW 11. The spatial units of analysis consist of the states, region and the boundary and locations where tsunami hazards remain imminent. The geographic data for the Pacific North West which covered its boundaries and states also includes ecological data of land cover files, paper and digital maps from several years. The outputs of the spatial data were mapped and compared to see the dispersion of the trends, the threats and the socio-economic factors that trigger the growing risks of tsunami. The spatial data acquired from USGS, Oregon department of Geology and Natural Resources consists of separate maps and raw simulation images and maps depicting projected tsunami menace and destructiveness under different periods of 2011, while the information from the University of Maryland covered the data for the base maps. The remaining procedure involves spatial-temporal analysis and output (maps-tables-text) covering the study period, using ARCVIEW GIS. The spatial units of analysis consist of the Pacific Northwest region and the five states and cities located in the area. From the process, the outputs for the areas were then mapped. The production of the maps in ARCVIEW GIS also required the common geographic identifier codes for the states and the selected cities. The fact that the cities stayed unchanged made it imperative to assign common geographic identifier codes that quickened the production of maps for analytical coherency. Surely the spatial boundaries of the core cities or areas of interest under analysis remained constant within a common geo identification code. This process helped delineate the location of sensitive areas that have been identified as sites of looming tsunami impacts.
3. Results
This section of the paper focuses on environmental assessment of the risks of probable destruction of the Pacific Northwest region from tsunami with an initial coverage of the five states. This is followed by a regional analysis of the scale and frequency of the eventual hazards, earth quake assessments, economic and physical assessment of the impacts in three states of the region as well as a spatial analysis. The factors and the assessment of the state of existing mitigation plans are also covered.
3.1. The Potential Destructiveness and Impacts of Tsunamis (Environmental Assessment of the Risks)
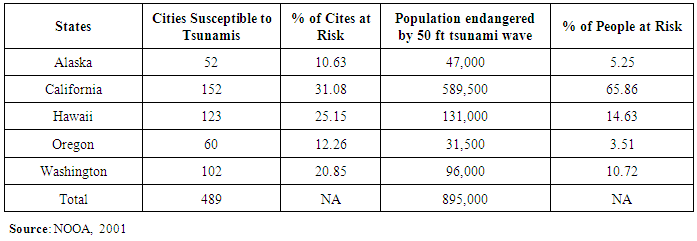
Regarding the potential destructiveness of tsunamis in the five Pacific states, an estimated number of 489 cities within the Pacific states of Alaska, California, Hawaii, Oregon, and Washington are susceptible. In the same area, almost 900,000 residents of these cities would be inundated by a 50 foot tsunami wave [1]. Among these five states, California, Hawaii, and Washington face the biggest threats compared to the other two. Being an endangered area, California has about 152 cities and over half a million residents that are at risk while Washington followed up with 102 cities and 96,000 residents. In a similar vein, about 123 cities and 131,000 people remain vulnerable in the state of Hawaii. Elsewhere Oregon and Alaska have 60 to 52 cities populated by 31,500 to 47,000 people that are threatened. The percentage distribution of the trends shows California accounts for 31.08% of all at risk cities, followed by Hawaii and Washington each representing over twenty percent (25.15 to 20.85%) of vulnerable cities in the Pacific North west region. In addition to that, Alaska and Oregon round up the list of other states in the region with 10.63%-12.26% of the cities grouped in the tsunami hazard zones of the study area. Furthermore as the Table shows, while the majority or 65.86% of population at risk reside in California, about 14.63% to 10.72% of the endangered population in the region call Hawaii and Washington home. This is higher than the 5.25% to 3.51% of residents of Alaska and Oregon that are in harm’s way from the threats of tsunamis (Table 3).Table 3. Potential Destructiveness of Tsunamis in the Five Pacific States
 |
| |
|
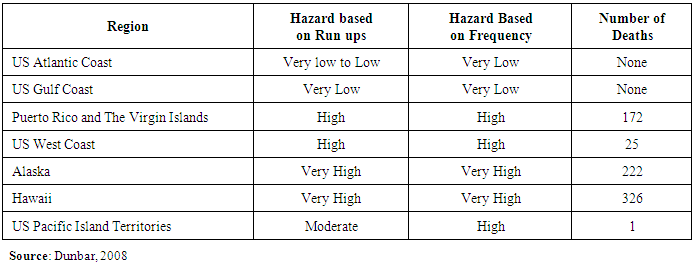
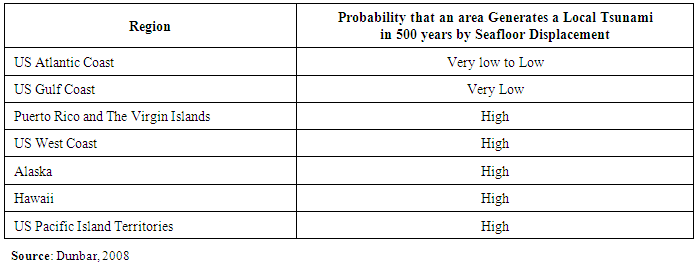
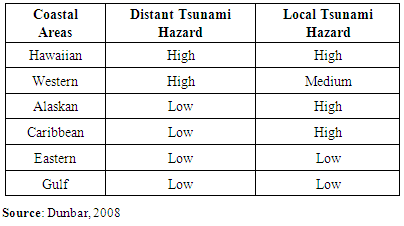
The assessment of regional vulnerability of various areas in the US under three categories of tsunami hazards (run ups, frequency and number of deaths) shows the hazard to be less of a threat from the Atlantic region to the west coast area. From the categories outlined on the table, the US Atlantic and Gulf coast areas were classified as very low in terms of hazards with no reported cases of deaths. Moving further along to Puerto Rico, the Virgin Island and the US west coast one notices that tsunami threat levels from run ups and frequency grows to high levels with reported human casualties estimated at 172 to 25. For the Pacific North west states of Alaska and Hawaii, the risk soars to very high levels of 222 to 326 in terms of reported number of deaths while the threshold for the US Pacific Islands stood at moderate and high with only 1 death. Another thing to note is the probability that any of these regions would generate a local tsunami in 500 years through sea floor displacement seemed less obvious at very low possibility in the Atlantic and Gulf coast regions. Understandably, the probability seemed much higher among the Pacific Northwest areas of the US West coast, Alaska and Hawaii. At that same time, one need not overlook the fact that the coastal areas of Alaska, Hawaii and the western region remain vulnerable to distant and local tsunami impacts. The breakdown of the values points to high and very high threshold for the threats of local and distant tsunami types for the Hawaiian coastal areas. This is followed by medium to high for the western region coupled with low and high for the Alaskan coast. The other regions on the table most notably, the East, the Caribbean and the Gulf face lower risk levels compared to the former (Tables 4-6). The forgoing scenario shows the high risks of tsunami exposure in the Pacific Northwest to be at levels greater than the other eco-zones in the US [13]. Table 4. Qualitative Tsunami Assessment Based on NGDS Database
 |
| |
|
Table 5. Qualitative Assessment of Tsunami Hazards Based on USGS and NSHM Databases
 |
| |
|
Table 6. Relative Tsunami Hazard for Distant and Local Tsunamis in US Coastal Areas
 |
| |
|
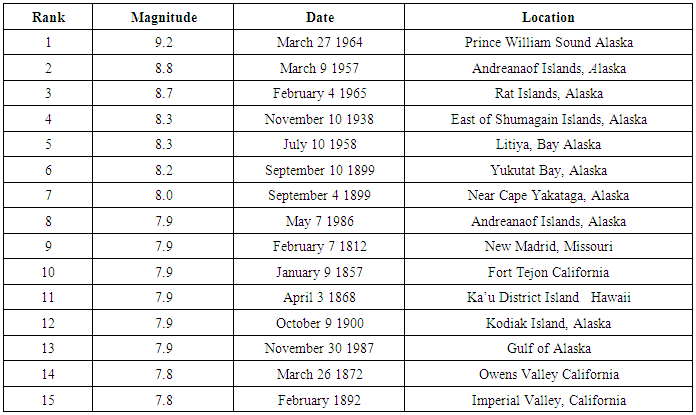
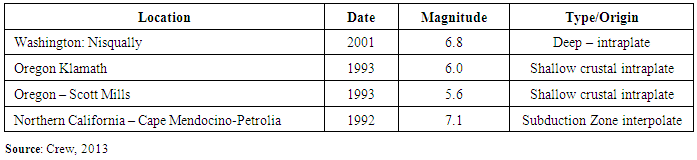
3.2. The Occurrence of Earth Quakes in the Region
Of the recorded 15 largest earth quakes in the country over the years, about 99% of them occurred in the Pacific Northwest region in terms of frequency and the scale. Alaska topped the list with 10 occurrences starting with the 1964 earth tremor at Prince Williams which measured at 9.2 on the scale. Note that in the later years, the Islands in Alaska which ranked 2-4 saw many earth quakes of immense magnitude of over 8.0. This surpasses the levels of earth quakes as represented in the rankings from numbers 8 through 15 for the states of Hawaii and California. All in all, the three states of Alaska, Hawaii and California seemed to have experienced more tremors in the country during the periods in question than the other states (Table 7). Looking at the most recent ones between 1992-2001 in Nisqually, Klamath, and Scott Mills in Washington and Oregon and in northern California, it is evident that the Pacific North west region stands out as a geologically active zone (Table 8). Table 7. The Largest Earth Quakes in the United States
 |
| |
|
Table 8. Examples of Recent Earthquakes in the Pacific Northwest
 |
| |
|
3.3. The Economic and Physical Assessment of Impacts among the States
The tsunami impact analysis on the Pacific North West region revolves around many scenarios involving higher probability of occurrences in the foreseeable future in light of current experiences. This is based on the physical and economic impact analysis in selected states of the Pacific North west region (Table 9, 10, 11). In the context of physical impact, should a Cascadian earthquake of 9.0 scale equivalent to the tsunami that struck Japan in 2011 occur in the study area, human fatalities in Oregon could range from 1,250 to 10,000. The area would experience severe shaking lasting 5-6 minutes with the destruction of tens of thousands of structures worth over $32 billion dollars in property damage. While parts of northwest Oregon near to Astoria could drop 4-8 feet in elevation, tens of thousands would be rendered homeless coupled with severe infrastructure loss causing economic slowdown [14]. Table 9. The Projected Cascadia 9.0 Impact on Oregon
 |
| |
|
Table 10. Economic Impacts of a Cascadia Subduction Zone Earthquake
 |
| |
|
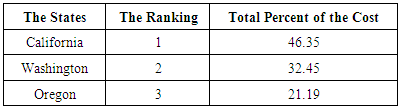
Table 11. The Total and Percentage of Economic Cost of Eventual Impacts of Cascadia M9.0
 |
| |
|
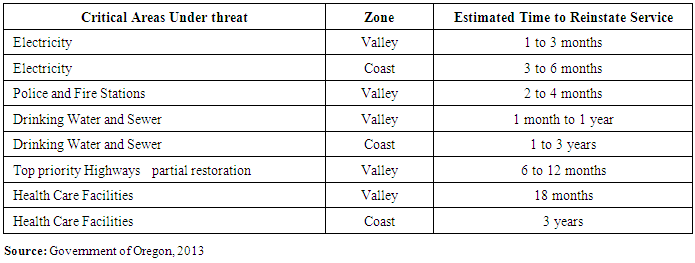
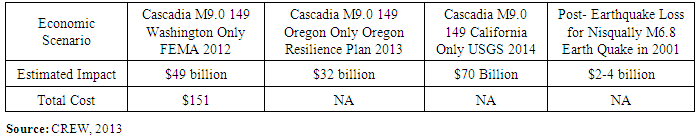
Furthermore, Table 9 outlines the extent and nature of hazards to impact critical infrastructure, the areas at risk and the projected time needed to restore essential services. In all these, the anticipated physical impacts for Oregon cover far ranging areas of essential services to the communities. It consists of the disruption of electricity, drinking water and sewer, high ways, police and fire service, health care infrastructure in the valley and coastal regions of the state over a lengthy period. Of these services, electricity outage along the valley and the coastal areas is expected to last multiple months of 1-3 and 3-6 respectively. Another dimension to the Cascadian subduction threat touches on the disruption of police and fire service with the period of service reinstatement stretching over 2 to 4 months in the designated places. Considering the importance of water and sewer lines to public hygiene in communities, damages to these facilities will have estimated repair time of one month to 3 years while it could take up to 6 to 12 months to repair high ways.Health facilities on the other hand, require 18 months to 3 years to be up and running in the valley and coastal regions of the state. Among the services likely to be impacted, drinking water, and sewer, highways and health care facilities would require much lengthy time of 1 to more years to repair compared to other essential services in the coastal and valley region of Oregon [14], (Table 9). Aside from threats to energy sources in coastal Oregon, the impact will result in massive damages in the neighboring states of Washington and California.The economic impact costs based on monetary equivalent of the fallout from Cascadian earth quake of magnitude 9.0 is presented in the table. It covers probable trends in the states of Washington and Oregon ranging from $49 to $32 billion. This is followed by a post-earth quake cost of $2.4 billion attributed to the Nisqually area of Washington. The other projected economic impact cost of $151 billion dollars shows California holding the biggest percentage rate of 46.35% followed by the state of Washington at 32.45 % while Oregon finished at 21.19% of the combined economic damage expenses (Table 10-11). Knowing that the CSZ located in the Pacific coast has been identified as the biggest threat in western Washington. Current projections offer an insight into impacts should a rupture from 9.0 magnitude earth quake rattle the Seattle area for more than 6 minutes. Under these circumstances, a Cascadian tremor could cause over 10,000 deaths, with more than 20,000 injuries coupled with $49 billion in damage costs in Washington [15]. In the case of California, any sudden strike by a 9.0 earthquake on its sparsely populated north coast would have a catastrophic effect. A Colossal tsunami triggered by such a quake will erode coastal areas, demolish US HWY 101 and impose about $70 billion in damages costs on a vast area of the Pacific coast. While this will be followed by the submerging of at least 100 bridges, the destruction of power lines and the isolation of coastal areas, residents would have only 15 minutes to flee to higher ground with as many as 10,000 causalities.
3.4. Spatial Analysis
The spatial analysis center around four major themes associated with the impending hazards in the study area. The themes consist of an analysis of liquefaction and landslides, the actual threats to the region from the activities and collision of two plates. This section will also emphasize the impacts on the Columbia River and the spatial dispersion of various socio-economic elements over time.
3.4.1. Liquefaction and Landslides
From the map it is evident that significant part of Oregon from the upper north, lower and some parts of the east and the central regions are vulnerable to potential ground movement of greater than 1ft due to the threats of liquefaction and landslides. With both threats distinguished by purple for liquefaction and red for landslides, note the broad convergence and spread of liquefaction along the north central and the east central areas of Oregon coupled with a few patches clustered around the north west and south west. Landslides captured in the red color as the map shows seemed fully concentrated in different parts of Oregon and within the vicinity of some of its cities. This raises the spectra of risks to both built and natural environment from the probability of coastal tsunamis triggered by the Cascadian Subduction Zone (CSZ). Another interesting observation touches on vicinity of the risk centers to the coast lines of Oregon on the western edge of the map (Figure 3). 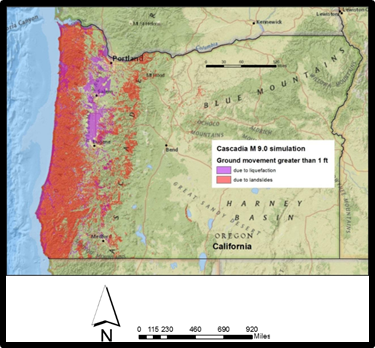 | Figure 3. Cascadian 9.0 Simulation: Source: Government of Oregon, 2013 |
3.4.2. The Actual Threats to the Region from the Activities of Two Tectonic Plates
The CSZ being a fissure in the earth’s layer stretches through approximately 60 miles offshore and about 800 miles between Northern Vancouver to Northern California. While it originates where Juan de Fouca plate sub ducts beneath the continental plate, to the south, the scattering Gorda ridge drives the Gorda plate south east. Additionally, the zone forms part of the pacific ring of fire, the bearing upon which quite a few immense tectonic plates run into. Within this fault line, a piece of the Pacific Ocean bottom referred to as the Juan de Fouca plate slips east ward and downhill – subducting beneath the continental plates of North America. The minute one of both plates drags each other and gets trapped, a colossal pressure is bound to develop till the rocks rupture and the fault splits separately in a massive tremor. In other words, should these plates get jammed jointly by frictional forces or resistance, tension would accumulate in the rocks and the upper plate would lean down alongside the exterior area and stiffen inland, jolting skyward until the rocks beside the fault collapse. In the ensuing release of stress during such a tremor, the higher plate would break to the west in the direction of the original form (Figure 4). Being an epicenter of 44 tremors in the past 10,000 years, an eventual 9.0 magnitude earth quake on the coast of Oregon, California, and Washington in the Pacific Northwest will be extremely catastrophic in these circumstances hence the vulnerability[6, 15, 22]. 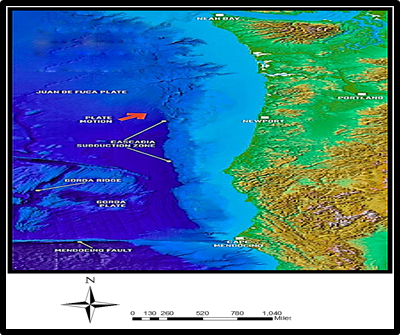 | Figure 4. The CSZ Impact Zone. Source: Thompson 2012; CREW 2014 |
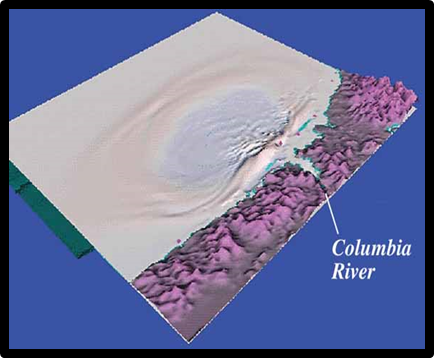 | Figure 5. Computer Simulation of a Major Seashore Earthquake on CSZ: source: USGS, 2000 |
3.4.3. The Impacts on the Columbia River in Washington and Oregon
Considering the geologic history of the region in the face of growing hazards on the coastlines of Washington, Oregon, and California, there is a greater possibility that the shorelines of communities along the major rivers including the Columbia would be at a very big risk of heavy flooding from tsunami waves [16]. The closeness of the southern portion of CSZ to the coasts makes it likely that heavy flood waters from tsunami waves will severally obliterate communities. Infrastructures including hydroelectricity dams, wildlife and natural habitats and Native American communities along the Columbia River off the coasts of Washington and Oregon will be affected under a few minutes in the event of such a tremor. A disaster of such scale would reach catastrophic proportions in terms of human lives, property and the degradation of the surrounding ecology. Notwithstanding the physical attributes of the Colombia River, it could be turned into a sea of debris unleashed by a magnitude 9.0 earth quake in the event of Cascadian Subduction Zone (CSZ) implosion. Being the fourth largest river in the US with hydroelectricity potentials surpassing other rivers in the continent, the river provides essential services to over 400 dams, coupled with meeting the irrigation and agricultural needs of communities. There is also its role as a repository for biodiversity which is central to cultural and economic life and the ecology of the area. In a region where dams perform several essential functions ranging from flood control, navigation, storage and delivery of stored water, irrigation has gradually transformed the area as a major agricultural hub for the cultivation of essential crops. With such benefits, any tectonic implosion of the magnitude shown in the computer simulation diagram, the Cascadian Subduction Zone (CSZ) would not only impede life support infrastructure, but the rupture and flooding of the river would wipe out communities in the built and natural environment along the Columbia river basin in the states of Washington and Oregon (5) [17].
3.4.4. The Spatial Dispersion of Socio-economic Elements
The map outlines the spatial distribution of the number of susceptible cities in the five Pacific Northwest states of the study area in the event of a major tsunami. With these number of at risk cities captured under 5 different classes in colors of yellow, orange, light and dark red and blood color. The threshold of gauging their risk levels as the map shows consists of multiple categories of maximum, moderate, and minimum forms of impending vulnerability for the designated number of cities. Among at risk areas, note that those in Hawaii and California (represented in red and dark red) were visibly prominent in the southern and south west portion of the region. Both states not only have more at risk cities (in the order of 124-152 to 110 -125) under the maximum threshold, but they do outnumber the other states in that category in terms of susceptibility to a mega underwater tremor. The moderate or medium group in light red and orange represents other classes of vulnerable cities (in the 61-103 to 53-60 categories). These are in the upper north portion of the area along Washington and Oregon. Alaska on the uppermost corner of the Pacific Northwest region represented in yellow has the lowest concentration of cities (0-53) deemed vulnerable to a tsunami (Figure 6).  | Figure 6. The Distribution Number of Cities Vulnerable to Tsunami |
Regarding the fate of endangered population in the event of underwater tremor in the Pacific north western region, from the information on the map, the states of California and Oregon covered in red and orange colours again have the highest number of residents likely to be in harm’s way along the coastal areas of both states. Hawaii represented in yellow in the lower end of the study area stands alone in the medium category. Elsewhere Washington and Alaska in the uppermost section of the region shown in mild and pure green rounded up the lower tier of population numbers at risk. The breakdown of the demographic distribution in the high level concentration of citizens in vulnerable terrains shows the numbers for California and Oregon in the order of 315,001-589,500 and 131,001-315.000 while in the medium side of the scale on endangered population, the Hawaii area in yellow stands out at 90,001-131,000. The lower level of exposure involves the other two states (of Washington and Alaska) adjacent to the CSZ fault zone where the population at risk in both places ranged from 47,001-96,000 to 0-47,000 respectively (Figure 7). 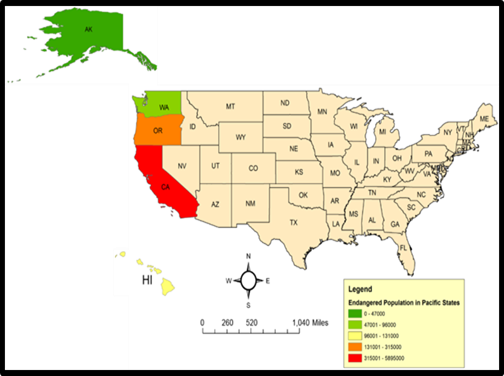 | Figure 7. Populations at Risk to Tsunami |
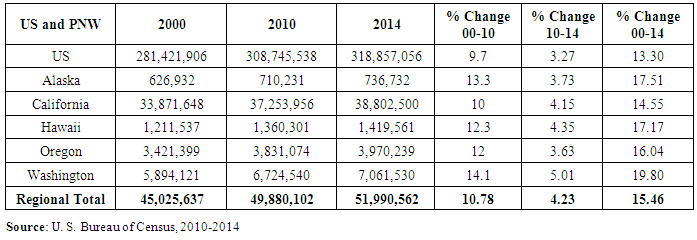
Another twist to the spatial dimensions touches on the changing patterns of population distribution known to influence the vulnerability of the region between the periods of 2000-2014, (Figure 8). In a geologically unstable region such as the study area, the distribution of population across time and space remains highly critical in understanding the gravity of eventual risk levels from the seismic hotspots. Being a measure of vulnerability levels between 2000 through 2014, the spatial distribution of population in the area showed major gains spread across the upper most states of Alaska and Washington followed by Hawaii in the lower edge of the map. The two other states (Oregon and California) represented in red and orange along the northwest portion also saw notable gains in population. As the map shows, Washington (in green color) located in the northern area of the map had the highest gains in population estimated at a rate of 19.80% along with Hawaii at 17.54% and Alaska with 17.17 percentage points while California and Oregon saw increments of 16.04 to 14.55% respectively (Figure 8). 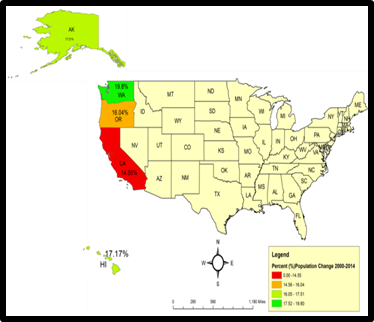 | Figure 8. The Population Change 2000-2014 |
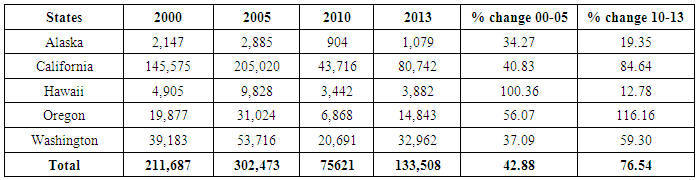
Between 2000-2005 and 2010-2013 periods, the states of Hawaii and others saw notable presence in increases in the issuance of building permits (Figure 9-10). Being the matrix driving the growing build up along seismic fault zones of the Pacific Northwest region, the spatial distribution of building permits over the thirteen year period notwithstanding the housing bubble adds an interesting insight on the socio-economic elements compounding the impending risks. In the first five years (2000-2005), when Hawaii showed the highest gains of over 100% percentage points in the number of building permits as a measure of growth, Alaska and Washington had similar levels of gains of 34-37 plus percentage points. Oregon and California rounded the medium gains with 56.07-40.83% (Figure 9). In the ensuing periods of 2010-2013, a complete reversal of pattern emerges with Oregon and California (differentiated in red and orange) showing the visible concentration of highest levels of gains in permits in the order of 116.16 -84.64%. During that period, Washington stood firm with 59.3%. Alaska and Hawaii on the other hand saw increases (19.23%-12.38) in lower double digits at levels different from the previous years (Figure 10).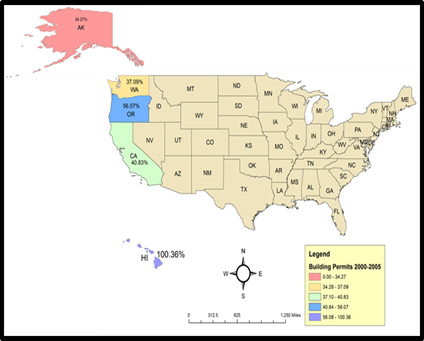 | Figure 9. Building Permits 2000-2005 |
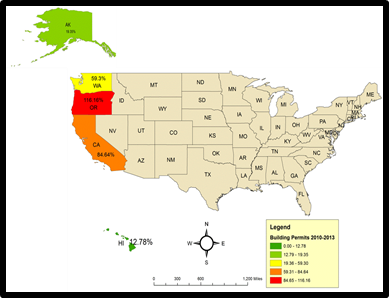 | Figure 10. Building Permits 2010-2013 |
3.5. Factors and Evaluation of Current Efforts
The projected upheavals likely to face the Pacific Northwest region in the event of any mega tsunami do not happen in isolation. It seems compounded by several factors ranging from the demographic element of population growth, the lack of monetary support to track and prepare for the dangers, geo-physical parameters and defects in current policies and planning. While these factors are described in detail below one after the other, details of the evaluation of current efforts are contained in Appendix 1.
3.5.1. Demography
In both developed and developing nations, coastal areas contain the most rapidly growing towns and cities. In the process, population pressures in the coastal zones of the Pacific Northwest continue to drive unparalleled shoreline expansion, placing inhabitants, visitors and assets at amplified danger from colossal storm surges referred to as tsunamis. This is evident with the pace at which overall population figures of the region went from over 45 million inhabitants in 2000 to more than 49 to 51 million plus between 2010 through 2014. During these periods (2000-2010 and 2000-2014) each state posted double digit growth rates that surpassed the levels for the entire US average (Table 12). At same the time, the coastal regions of United States are some of the most attractive areas to live in. This can be buttressed by the 180 million Americans who visit the coast each year in the summer. As a result, coastal population tends to double. The fact that almost half of the US population troop to coastal areas every summer raises the profile and burden of coastal areas of the Pacific region as epicentres of tsunamis. All in all, coastlines like those in the Pacific Northwest have always been a favoured location for human settlements due to their exotic and appealing nature. They have both aesthetic and economic appeal as well as opportunities for boating, fishing and swimming. The pressure exerted by humans in coastal communities emanates from housing needs, hotels, roads, etc. Because of the attractiveness of coastal locations and the long gaps between devastating tsunami events, coastal communities have continued to develop with new housing, maritime facilities, and resort development in recent times. As a result more people and facilities are not only threatened by destructive force of tsunamis. [1], but they are now in harm’s way more than ever [17]. This puts enormous strain on the carrying capacity of the environment which in turn accentuates the vulnerability of the population to any eventual seismic event in an unstable geology. Table 12. Population 2000-2014
 |
| |
|
3.5.2. Development Pressure
The attractiveness offered by coastal beaches of the Pacific Northwest means more influx of people and the recourse to infrastructural development to meet the needs of a growing population and multitudes of visitors. As a proof of this pressure, compare the growth rates of the pacific North West and the US as a whole. When the United States experienced 9.7% increase in overall population growth, the region saw a 10.78 % spike from 2000 through 2010 and by 2010-2014 and 2000-2014, the entire pacific region did outgrow the US as well by 4.23 to 15.46%. Additionally, by 2000-2010, the five states in the study area, posted significant population growth rates which exceeded that of the U.S. Amongst these states, California emerged with the lowest rate of the five at 10% with Washington being the highest at 14.1% and the trend continued in 2000-2014. In that period, Washington emerged with a growth rate of 19.80% while Alaska and Hawaii followed up with over 17% a piece and the numbers for Oregon and California stood at 16.04% - 14.55% respectively (Table 12). Similarly, as population density increased nationally, each state experienced population density surges from a low of 1.2 persons per square mile in Alaska to a high of 239.1 persons per square mile in California. Other population indicators show that growth in the five western states reflects the trend in the other states nationwide. Between 2000 and 2010, the states of Washington, Alaska, Hawaii, Oregon, and California were ranked in the top 20 (13th, 14th, 17th, 18th, and 20th) respectively in population growth nationwide [18]. With such rankings in population growth, meeting infrastructural demands for roads, malls, and new subdivisions in those settings for a timing number of citizens requires planning and inroads into uninhabitable and unstable terrains with increased exposure to the risk zones of potential tsunamis. This is evident with the number of building permits issued from 2000 to 2014 in the region. With an overall total of 211,687 permits in 2000, note the considerable jump to 302,473 in 2005 followed by the gradual slide to 75,621 during the housing bubble of 2010 and an upswing in 2013 at 133,508. This is equivalent to 42.88 to 76.54% in rates of increase between 2000-2005 and 2010-2013 [19]. Clearly, all states posted double digit increases in the issuance of permits which is an ample metric of growth patterns in the area despite an unstable geology and tsunami dangers involved (Table 13).Table 13. Building Permits 2000-2013
 |
| |
|
3.5.3. Economic Wellbeing
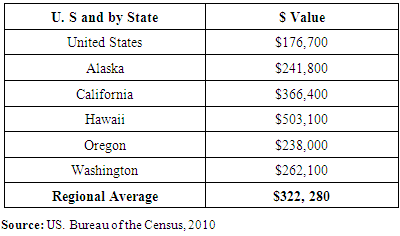
The states and the cities of the Pacific Northwest region, have economic hubs that are generating new jobs. These hubs draw people and migrants across the country and the globe for conference events, conventions and real estate speculation. In the process, the entire coasts have been rapidly urbanized with economic advantages. Considering their aesthetic and economic appeal as well as opportunities for boating, outdoor, fishing and swimming, these ecological resources of the zone provide numerous job opportunities and sense of economic wellbeing and access to pristine environments. All these translate into higher prices for beach front homes and properties with huge revenue base for speculators and the tax coffers of cities. Median value of owner occupied home at $322,280 in all five Pacific Northwest states as the analysis shows outpaced the US average of $176,700. Amongst the states, the price of homes for Hawaii and California at $503,100-$366,400 topped the list while the average value for the remaining states of Oregon, Washington and Alaska stood at $247,300 (Table 14). Such conventional economic indicator does affirm the advantages of the region [20]. Table 14. Median Value of Owner Occupied Homes 2009-2013
 |
| |
|
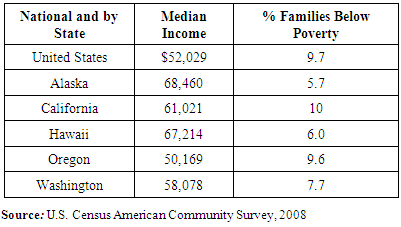
In other areas, income and poverty figures suggest these states are generally comparable to or better than the overall US population. Poverty figures for the United States show that 9.7% of families live below the poverty line. Comparatively, four of the five study area states have a smaller percentage of families living below the poverty line, ranging from a low of 5.7% in Alaska to a high of 9.6% in Oregon. The only exception, California has over 39 million residents with a poverty rate of 10% higher than the national level. According to the U. S. Census Bureau (2008) American Community Survey, the median income in the U.S. stood at $52,029. By comparison, four of the five states showed median incomes that exceeded the national average, ranging from $58,078 in Washington to 67,214 in Hawaii. Oregon’s median income of $50,169 fell below that of the national average [21]; (Table 15). With all these added advantages, real estate speculators would not only put up homes for sale, but they are bound to have willing buyers of beach front homes. Cities in these settings lean towards the development of new areas in lieu of market confidence and falling interest rates regardless of the unstable geologic terrain.Table 15. Median Household Income and Percentage of Families Below Poverty 2008
 |
| |
|
Given the environmental risks from possible tsunamis, it comes as no surprise that reconciling these competing demands (economy-environmental risks) becomes a challenge to coastal planners. Without being told, human activity through economic development can interfere with the natural process of the coast through cumulative impacts in case of underwater volcano. As more people and cities exploit the economic benefits of the region, people would be concentrated on the coast. Conflicts on how to reconcile public safety in the event of a tremor and economic returns from the use of coastal resources with exposure to tsunami risks continue to heighten. Accordingly, unsustainable human activities are placing enormous burdens on the Pacific coastal zones’ ecosystem beyond the capacity to absorb tsunami impacts. Such lust for growth threatens the vitality of a coastal zone and resiliency needed to survive a major earth quake in the area.
3.5.4. Geophysical and Environmental Parameters
Another twist to the limiting factors likely to compound the response of the Pacific North West comes from the natural pressures mounted from the unstable geology of the region on the adjoining coastal zone ecosystem. Clearly stated, many of the pressures exerted on coastal areas of the study area are part of natural process. As a result, winds and waves that are attributed to seismic events such as tsunamis move materials that affect coastal landscapes and they are abundant in these areas from one period to the other. While these include inclement events that occur during coastal storms and hurricanes, such pressures impact the stability of an already fragile geology. Added to that is the proximity of the CSZ in the area. The Cascadian fault is part of several seismic hotspots around the globe where plates of the earth’s crust grind and drive three tectonic plates pushing against each other. Being a very long sloping fault line stretching through multiple states, it separates Juan de Fuca and the North American Plates. Because of the very large fault area, CSZ as mentioned previously could produce a very large earth quake measuring magnitude 9.0. When ruptured with massive force, it has the capacity to wreck mayhem in the region [15, 22]. The risk exposure for the entire region and the fate of communities in the surrounding ecology are compounded by the level of impending hazards and geophysical parameters in a very unstable environment.3.5.5. Defects in Public Policy and PlanningThe current defects in policy and land use planning seem to be exacerbating the problems. Part of the risk exposure emanates from how communities manage their land and resources in the region. This is especially true in the Pacific coastal zone where land use development is taking place in unsafe areas. Such type of land use regulation with its attendant risks fall within the domain of local government because it is site specific. The frequency of flooding, earth quakes and mud slides both past and present coupled with the proximity of developments in hazard prone areas indicates that current policies encourage behaviours that could place more people and property at risk from coastal hazards in the region in the event of a major tsunami. Surely, the federal flood insurance is often cited as an example of how hazardous development is subsidized and how the wrong kinds of incentives are created. With the availability of various types of hazard insurance that encourages development in coastal areas. Coastal development subsidies are provided in the form of tax expenditures and deductions with benefits to cities and land speculators. This often accentuates the inherent risks, hence the vulnerability [9].
4. Discussion
In the context of this research, the surrounding ecology of the Pacific Northwest region boosts of different life forms, extensive costal lines, attractive landscapes, pristine lakes, rivers and major water ways that are destinations to countless visitors and sprawling settlements. Of particular concern in the area is the mounting tsunami threat and uncertainties rooted in the CSZ where population growth and development pressures continue to creep into geologically unstable terrains. An analysis of the trends based on a mix-scale method of spatial information systems connected to descriptive statistics and mapping images indicates that the US Pacific coastal states continue to be at risk. Notwithstanding that all five states have been hit by tsunamis that caused notable losses. The assessment of current mitigation efforts in several coastal counties in the states indicates that most plans are out-dated and not effective enough in case of any major tsunami event. Furthermore, since 1946-1964 six tsunamis have killed many people and damaged hundreds of millions of dollars of property in Alaska, Hawaii and California along the west coast. Additionally, the analysis of probable destructiveness of tsunamis in at risk areas in the five states revealed that 489 cities within Alaska, California, Hawaii, Oregon, and Washington states are susceptible while close to million residents would be inundated by a 50 foot tsunami wave. Among the five states, California, Hawaii, and Washington face the biggest threats. In comparing the Pacific Northwest region to various areas in the US to three categories of tsunami hazards based on run ups, frequency and number of deaths, one notices ample risk levels for the study area. Under these scenarios, the three states of Alaska, Hawaii and California remained epicentres of earth quakes time after time than other areas. Another aspect of the analysis touched on the CSZ threat to the broader economic and ecological assets of the region. This involved a physical and economic impact assessment of probable 9.0 tsunami event estimated at $150 billion damage costs in three states (of California, Oregon and Washington). Of these states, California accounted for the biggest costs representing 46.35% of the liabilities while the other two states of Washington and Oregon incurred 32.45 to 21.19% of the costs respectively. Additional projection of tsunami impacts in the area points to the probability of colossal fatalities of tens of thousands of deaths in Oregon, Washington and California. The analysis further showed that a giant tsunami created by the quake would wash away coastal towns in California’s sparsely populated north coast with a catastrophic effect. This would involve the destruction of US HWY 101 and a huge strip of the Pacific coast and the loss of many bridges and the tumbling of power lines with less time for residents to flee to higher ground. Given the region’s history in producing tsunamis along the coastlines of Washington, Oregon, and California, there is a greater possibility that the shorelines of the major rivers including the Columbia River would be at a risk of heavy flooding. The closeness of the southern portion of CSZ to the coastal shorelines makes it likely that tsunami waves and heavy flood waters will severely obliterate communities and infrastructures in the built and natural environment. In the event of such a seismic tremor, over 400 hydro-electricity dams would be impacted coupled with the destruction of wildlife and fishery habitats and major rivers along the Columbia basin off the coasts of Washington and Oregon in just under a few minutes. The spatial analysis of the trends using GIS shows also that significant part of Oregon from the upper north to lower portion and some parts of the east and the central regions are vulnerable to potential ground movement of greater than 1ft due to the threats of liquefaction and landslides. Interestingly, the projected threats and the levels of anticipated upheavals likely to occur in the Pacific Northwest region in the event of any tsunami from volcanic activities along the CSZ do not happen in isolation. The situation could be compounded as a result of several factors ranging from demographic element of population growth, uncontrolled development, the lack of monetary support to track the dangers, geo-physical parameters and defects in current policies and planning. Of great concern is the pace at which the region’s population had accelerated over the years and outpaced the US average. Seeing that coastal areas of the region are sought after destinations with some of the fastest growing towns and cities, population pressures in the coastal zones of the Pacific Ocean fuel rapid seaside development that is putting citizens and infrastructure at harm’s way in the event of tsunamis. This is compounded by double digit population increases between 2000 through 2014 coupled with the lure of pricey homes and favourable median income levels that draw people into these areas. Such a scenario not only imposes enormous strain on an already unstable and fragile ecosystem, but the pressures from human settlements as indicated by the growing rates of building permits issued and the median value of homes over the years on places near to fault lines are so daunting that they do accentuate the exposure of human settlements to heavy tsunami risks. Another dimension that heightens the risk exposure stems from the unforgiving terrain of the Pacific North west known for its unstable geology. The grinding of two plates in the area not only remains immense, but the risk would be amplified. Being a region upon which active volcanoes still roar across towns and communities, it could at times be one of the most unsafe environments where lives and properties can be put at risk in any moment. The thought of a magnitude 9.0 tsunami and the ensuing physical and economic damages remains a very catastrophic nightmare that could stifle life support of the areas. Aside from the inadequacies in current efforts to mitigate the eventual impacts and a lack of will to commit research funds to study the issues, the responsibilities of planners in the region are immense due to the gravity of the threats to communities and the natural environment. Even though no city would want to put its citizens in harm’s way deliberately, the geophysical danger of an unstable terrain like the Pacific North west region remains uncontrollable in the event of any major tsunami. The magnitude of the costs and the gravity of the projected damages all point to a region at risk. As a result, the area could well be on a brink of a major seismic event unlikely to spare anything that comes its way. This would not only create major paralysis of socio-economic acuities in the region within affected cities and states, but will take a while for restoration. From the experiences elsewhere, at risk areas would need to mobilize and access massive resources in order to sustain any major recovery effort that follows. Not to mention the pains of rebuilding, and the digging of debris and rubbles from submerged towns and the tracking of causalities, the outbreak of diseases or epidemics and the contamination of aquatic environments often synonymous with such seismic events. The immense pains from such an event stands as a challenge for planners and decision makers in a region still lacking state of the art inundation maps and up to date plans to mitigate the damaging aspects of the projected disaster in the area. To map the threats and the factors, the study used a mix scale method of temporal spatial analysis consisting of simple descriptive statistics analysis connected to GIS. The calibration of spatial information required in the GIS analysis relied heavily on the documentation of the county, state and regional boundary lines covering the study periods of 1992 -2014. With the emergence of GIS and its ability to spot areas at risk across time and space, analysing the spatial diffusion of seismic and ecological impacts and socio-economic factors likely to inflict environmental and fiscal stress on the Pacific North west region stands as a worthy endeavour. This remained indispensible during the design stage of data sets needed for environmental analysis. Consequently, GIS technique as used here provides a decision support device for planners in visualizing potential tsunami hazards likely to emerge along the geologically unstable zones in coastal counties of the PNW region. Accordingly, the analysis of the trends using a set of ecological, socioeconomic and physical indicators anchored in GIS techniques and descriptive statistics found the PNW to be an unstable geological terrain, overly vulnerable and on the brink of a potential tectonic catastrophe capable of obliterating both built and natural environment due to many factors. Given the probability of the aforementioned threats, current mitigation and efforts in the PNW still falls short and unlikely to withstand the ferocious impacts of a major tsunami from a seismic jolt in the foreseeable future. To mitigate the threats, the paper offered several recommendations ranging from the need for team building and regional approach. For the details see Appendix B.
5. Conclusions
This research focused on the growing threats of tsunami hazards and the vulnerability of the Pacific North west region with numerous important outcomes: a) there are frequent tremors in the area; b) mix scale method remains a vital investigative device; c) the natural and built environments are at risk; d) there is a growing possibility of major tsunami in the area; e) the impending threats are compounded by many factors. All in all, the potential destructiveness and impacts of tsunamis on population and cities and the ecology of the Pacific North West remains quite obvious and threatening. Added to that, the region has had its full share of frequent tremors than other regions in the country with sizable destructions over the years. Given the gravity of both past and impending threats, the results herein laid the grounds for improving tsunami hazard planning among the five states in a geologically turbulent environment. In showcasing the nature of hazards in the study area and the vulnerability of over 50 million people, there is no denying the fact that such a rich eco-zone with vast tapestry of natural and economic attractions remains prone to a mega tsunami. The likely fallout from a 9.0 tremor as shown in the simulations would not only shape future planning, but with the risks to society and the ecosystem, it will instil a culture of continued alertness more than ever. Accordingly, in the absence of such analysis herein, local planning could proceed on a faulty logic to the detriment of communities and the environment. The expectation is that the findings would sharpen the preparedness of decision makers and schemes of cities to better anticipate and mitigate eventual threats. It will be vital in interpreting and responding to the eventual signs of tsunami threats in a proactive way. This would help minimize the impacts on an already fragile ecosystem on the verge of being pushed beyond its limits by recurrent seismic events. Furthermore, the applications of mix scale methodology as an investigative device did stand out. Utilising a mix-scale approach of descriptive statistics and GIS mapping and images as operational tools added further insights to the regional assessment of tsunami hazards. Since result oriented management of tsunami hazard demands a multidimensional framework such as the mixscale ––as shown herein in the study, the model was quite effective in defining the study area and identifying the sites of eventual hazards, the epicentres of tsunami, the projected risk levels, the populations and cities at risk, the physical, ecological and economic impacts and damages. It also unveiled the frequency of seismic events, the vulnerability of infrastructure, and the geographic dispersion of social and environmental parameters in space to be impacted in the region. This method remains very essential in serving the needs of scholars assessing the impacts of tremors in a geologically turbulent terrain like the PNW coast. Regarding the spatial dispersion of the eventual risks, the GIS mapping and spatial images as a management tool emerged quite valuable in showcasing the nature of eventual hazards, the pace of their diffusion and the prevailing factors. This benefit represents a significant stride towards effective planning and mitigation of eventual tsunami impacts. Pinpointing these risks enhances the capability of decision makers and agencies in prioritizing mitigation in vulnerable areas on the brink of exposure to impending destruction. The model offers operational thresholds for evaluating the perilous circumstances of communities on the path of uncertainties in the region. The practical applications involving spatial mapping along with seismic data, as investigative tools increases cognizance of tsunami challenges encountered in the PNW region in the literature. Considering its relevance, such capability allows the development of policy expertise needed in containing any eventual fallout from impending upheavals in the coastal areas at risk. Presenting the mounting dangers faced in the form of flooding, ground liquefaction and landslides, water and environmental pollution and erosion of natural habitats is quite timely and on target. The same can be said of the identification of other risks including ecosystem destruction, infrastructure damages involving roads, major high ways, obliteration of dams, power and utility lines, and telecommunication lines, loss of electricity and the likelihood of human casualties. Identifying all these as the study indicates is of great importance. In that way, the study injects an environmental protection dimension which is crucial in detecting dangers and keeping people and the fragile ecosystem out of the stress from probable hazards on coastal communities in a turbulent seismic zone. The other way to look at this finding stems from the importance of identifying the risks from multiplicity of tsunami impacts inherent in the region and the dangers posed to the environment. Keeping communities abreast of these facts provides them the much needed understanding of the epicentres of tsunami hazards in their midst and the need to avoid such places for their wellbeing given the propensity to the impending seismic fallout. Seeing that the research noted the probability of ecosystem degradation and infrastructure damages in the region reaffirms that the impacts transcend all facets of human nature interface debate that must be taken seriously in every quarter. With the little experience in any major real life seismic event and the unfounded sense of security in the face of weak mitigation schemes and the importance of river ecosystem and infrastructure as a life blood of the communities. The compilation of economic and physical costs of probable tsunami havoc in this study involving the damage to agriculture, highways, bridges and marine habitats and the loss of dams crucial in the daily lives of the communities not only reiterated the catastrophic vulnerability of the region’s environment, but also it does indicate the ease at which essential life support systems could grind to a standstill to the detriment of citizens. Emphasizing the impending dangers to the PNW environment and seeing how prior works overlooked such issues, the framework herein helps bring a major issue into the forefront of ongoing planning and research agenda. In the absence of such comprehensive assessment in this study bordering on human-nature inter-linkage, there would have been little knowledge about the impacts of projected seismic upheaval on the region’s ecology. Given the focus on risk assessment, this study will influence how regions respond to under water seismic hazards in coastal areas. Documenting the ecological indices highlighting tsunami events herein are not only critical tools tailored to sustain policy, but they are also a novelty indispensible in improving current measures for safeguarding the at risk states in the region during a major tremor. In that light, reiterating the impending risks exemplifies the right way to confront seismic hazards of higher magnitude upfront before it is too late.In seeing the factors likely to limit readiness of the region in surmounting the impending challenges, the research therefore created a road map for tracking these elements as conduits for strengthening response mechanisms. To a great extent, managers have enormous chance to appraise the characteristics by assessing the impacts with readiness and assessment of dangers to the surrounding ecology of the region. Being a step toward protection, the listing of these factors, improves the ability of policy makers in tracking the state of tsunami threats and the role of limiting elements in impeding ecosystem stability. This would allow states and communities design the right measures for minimizing the effects of tremors in a turbulent setting. The fact that the risks attributed to these factors will trigger impacts of monumental proportions makes the assessment herein an emerging vision for managing tsunami threats in different areas. At the same time, the research offers decision makers an improved understanding of unknown dangers that may occur in the region that are too serious to be underestimated. Considering the propensity of the region to under water seismic hazards and having come this far, policy makers and planners in the region and the neighbouring states would be hard pressed in the coming years to find answers to many essential questions. These include which other seismic dangers would surface in the PNW environment? What would the scale of impacts be like? Which form will the geographic dimensions of the hazards take? What other factors will influence the impending seismic catastrophe in the region? In light of these questions, there are great opportunities in all these for the research community and decision makers to refocus the plan on tsunami hazard management with policy interventions that emphasize mitigation alongside proactive response in order to safeguard the communities and the surrounding ecosystem in the coming years. There is no doubt, the Pacific Northwest area is a zone under catastrophic tsunami threats. Accordingly, the past and present history and geology of the region, point to the recurrent threats tsunami pose to the environment of the area. These risks could be minimized with research, education, team work, regional cooperation and innovative mapping of tsunami hazards in the years ahead. See Appendix B for more on the recommendations.
Appendix - A
3.6. The Evaluation of Current Efforts
3.6.1. Flooding Information and Assessment
In the five states, some coastal areas currently do not have two dimensional tsunami inundation maps. Even in coastal areas that have inundation maps, they predate recent modeling standards with no reliability. To effectively prepare for a tsunami, states need to assess potential impacts on people and infrastructure. This has been compounded by the different approaches in all hazard plans and the lack of uniform tsunami loss estimations in the plans. Some at risk states have produced assessments that do not provide complete tsunami loss information for all areas. Consequently, emergency managers in at risk states do not have comprehensive information on how many and what type of structures would be exposed and damaged and the causality figures as well [9].
3.6.2. Plan Development Goals and Objectives
In the past years, the city of Portland developed the Natural Hazard Mitigation Plan in an effort to reduce future loss of lives and property resulting from natural disasters. The plan’s goals described the overall direction that the city of Portland’s agencies, organizations, and citizens can take towards the mitigation of natural hazards. The goals of Portland plan’ were developed with significant input from the city’s project steering committee with a mission to reducing risk and expedient recovery [23]. Just as the same can be said of the Portland Metro Regional Mitigation Policy and Planning of 1999 [24]. The 2004 multi-hazard mitigation Plan for San Diego County is quite comprehensive, but it did not have generic objectives and goals for the entire region. These objectives were contained in the portion of the document dedicated to 16 individual cities [25].
3.6.3. Policies, Strategies and Tools
With the risks associated with tsunami threats, the Oregon Department of Geology and Mineral Industries as part of its policy initiated public enlightenment measures for safety purposes. This involved raising awareness through numerous safety bulletins to guide citizens [26]. Additionally, some of the cities elsewhere have also been successful in implementing a land use strategy to address future tsunami induced losses. Amongst them the city of Hilo, Hawaii, developed an urban renewal plan – based on the devastation from the 1960 tsunami. In the plan, the city sets aside certain open areas for limited use in order to minimize the loss of lives. Even though the uniform building code contains design requirements and standards for fire, wind, floods, and earthquakes, it did not include requirements for tsunami resilient design. The exception is the state of Washington where legislation establishing tax incentives for such construction is pending [9].
3.6.4. Inter-governmental Collaboration
The city of Portland realized that with collaboration among public agencies, private sector entities, and citizens within the community, it is possible to minimize losses from natural disaster. In the process, the city of Portland in preparing its Natural Hazard Mitigation plan drew heavily from the Hazard Mitigation Grant, (HMGP) and the Flood Mitigation Assistance Program both Federal Emergency Management Agency (FEMA) grant programs. The city of Portland also provided additional funds for the plan’s development from its general funds. Other evidence of intergovernmental cooperation includes the coordination of the planning process with the Disaster Policy Council (DPC). The plan for San Diego was prepared with input from county residents, responsible officials, with the support of California office of emergency Services and Security (COESS) and FEMA [23]. While the city of Seattle followed a similar path, most of the collaborations were often localized which is also a weakness [27].
3.6.5. Implementation
Communities longing for safety have taken actions to ensure more effective communications between emergency officials and first responders in their plans. Some have acquired satellite phones and digital communication systems which ensures the ability of first responders to talk to each other should telephone lines be disrupted. In the region where most states made efforts to check their evacuation plans and warning systems, only few comprehensive drills remained in place. As a result, only seaside Oregon has conducted comprehensive tsunami exercises involving multiple agencies and full public participation. While these efforts are useful, their limited scope may not adequately identify all of the issues that would emerge in an actual event. Of the 5 at risk states, only two (Oregon and Washington) have developed tsunami specific curricula in schools [9].
3.6.6. Mitigation Measures
Every development in coastal areas is subject to federal, state and local policies and regulations. Understanding the regulatory context is critical to the successful implementation of a tsunami mitigation program. In that light, all the five states require local land use planning with the exception of Alaska which has statewide planning guidelines for coastal districts. Of these states, California, Oregon and Washington, require hazard mitigation as part of their general land use planning process while Alaska requires it for coastal resource district plans only. Due to eventual threats, the 1972 Coastal Zone Management Act (CZMA) established a voluntary partnership among the federal government, coastal states, and local governments to develop individual state programs for managing coastal resources. The states’ component consists of federally approved Coastal Management Programs (CMPs) in 32 coastal states and territories, including the five Pacific states for orderly development and protection of the country’s coastal resources [1, 9].
Appendix - B
4.1. Recommendations
To address the issues identified in the study area, the paper offered the following suggestions to ensure safe and resilient environment.
4.1.1. Encourage the spirit of Team Building in Plans
Perhaps, the most challenging part of preparing a community for tsunamis is organizing activities that people will listen to and learn from, despite many other priorities and concerns for their lives. To do this, cities will need a good team approach in their plans. The most effective thing cities can do to make people listen to tsunami preparedness and the life saving measures is the involvement of energetic and influential people in the programs. Tsunami safety programs need to affect everyone in a community. This includes people who represent the most vulnerable sectors of society, women, children and the poor and the disabled people, all of whom are neglected in disaster planning efforts and often face the highest risks.
4.1.2. Design Flood Hazard Maps
Most communities find that making tsunami hazard mitigation and evacuation maps is the best way to begin mitigation efforts. Tsunami hazard maps show areas that tsunami waters could flood. Evacuation maps show hazard prone areas and provide information on how to evacuate those areas with access to safe places. Because hazard maps serve viable purposes, they not only educate and prepare the public, they can assist emergency responders to plan evacuation and involve the public to prepare for tsunamis. With the capacity to showcase areas vulnerable to inundation, most tsunami hazard maps do show a worst case scenario, meaning that they identify areas that will flood if a large tsunami occurs. Evacuation maps showing additional information that includes recommended routes to safety and local land marks can help people identify exit routes to safe locations during disasters.
4.1.3. Educate the Community about Tsunami Preparedness
Tsunami preparedness education programs are an important way to save lives in future events. In that light, education programs can provide a gateway to making sure community members know how to evacuate when they observe natural signals implying a tsunami encroachment. The first signals that a tsunami could be approaching ashore, may be a natural phenomenon, such as strong earthquake shaking or the sea withdrawing to abnormally low levels. The many different ways in which people can be warned about a tsunami remains quite confusing to officials and the public alike. In these circumstances, educational outreach programs can give people in the community the knowledge and confidence to make good choices about when to evacuate. Considering the benefits, public education should be customized for every community based on size, population diversity, level of preparedness and their circumstances.
4.1.4. Support the Learning of Tsunami Behavior and Research
To be able to plan for tsunami safety, cities need to indicate in their plans the basics of what tsunamis are, how they are caused, and the dangers to communities. Additionally, the physical characteristics of tsunamis have profound implications on how the public and the government should plan for evacuations. Learning about the devastating consequences of tsunamis can be a powerful motivation to prepare for them in the planning process. While those associated with planning in the high risk areas of the PNW should continue to encourage the learning of tsunamis. Recognizing tsunami risks during plan making would go a long way in aiding mitigation.
4.1.5. Adopt a Regional Approach
Aside from a slight regional theme with emphasis on multi-jurisdictional cooperation in containing the threats of tsunami, much of the maps and the plans that were reviewed, had local flavor with little emphasis on the tsunami threats outside of their planning jurisdictions. With local tsunami mitigation measures in the PNW shaped by both long distance and local impacts. Planning agencies, in the area should factor the experiences of other areas beyond their boundaries, so that they can better adapt to any eventualities that may originate from these areas. It also provides opportunities to share information and data on the impending risks. With the exception of Sand Diego, none of the places surveyed looked at nearby areas. In light of that, the paper recommends a regional approach that highlights local experience and geology of nearby places in community plans.
References
| [1] | National Oceanic Atmospheric Administration (NOAA). (2001 March). Designing For Tsunamis: Seven Principles For Planning and Designing For Tsunamis. Washington, DC: NOAA, pp 1-59. |
| [2] | Samant, L. (2008 February). A Guidebook For Local Advocates Working Draft Version 2.2 Preparing Your Community For Tsunamis, Geo-hazards International. 1-34. |
| [3] | Government Accountability Office (GAO). (2006 June). US Tsunami Preparedness Federal and State Partners Collaborate to Help Communities Reduce Potential Impacts, Significant Challenges Remain, Highlights. Washington, DC: GAO, 06:519:1-16. |
| [4] | National Tsunami Hazard Mitigation Federal/ State Working Group Program. (1996 April). National Tsunami Hazard Mitigation Implementation Plan: A Report to the Senate Appropriations Committee. Seattle, Washington: Office of Emergency Management. 1-22. |
| [5] | National Tsunami Hazard Mitigation Program (NTHMP) Strategic Plan (2011). Washington, DC: FEMA. pp 1-33. |
| [6] | Thompson, J. (2012 March). The Giant, Underestimated Earthquake Threat to North America: Discover Magazine. 1-6. |
| [7] | Thompson, J. (2012 March). The Giant, Underestimated Earthquake Threat to North America: Discover Magazine. 1-6. |
| [8] | Folger, T. (2012 February). Tsunami Science The Calm Before the Wave When and Where Will the Next Tsunami Hit. National geographic Magazine. 1-2. |
| [9] | Merem, E.C. (2011 February). Regional Assessment of Tsunami Hazard Management Plans: The Case of US Pacific North West. Proceedings of The Disaster Resistant Workshop, University of New Orleans, New Orleans, Louisiana: February 16-18 2011. |
| [10] | Svoboda, E. (2015). Americas 50 Greenest Cities. Popular Science. Retrieved November 22nd 2015 From http://www.popsci.com/environment/article/2008-02/americas-50-greenest-cities?page=1. |
| [11] | U. S. Bureau of the Census. (2014). Census Quick Facts. Washington, DC: US Bureau of the Census 11-13. |
| [12] | Eisner, R (2005). Planning For Tsunami: Reducing Future Losses. Through Mitigation. Natural Hazards 35:155-162. |
| [13] | Dunbar, P. (2008 August) US States and Territories National Tsunami Hazard Assessment Historical Record and Sources For Waves. Seattle, Washington: USGS, pp 1-13. |
| [14] | Government of Oregon. (2013 February). The Oregon Resilience Plan: Report to the 77th Legislative Assembly. Salem, Oregon: Oregon Seismic Safety Policy Advisory Commission. |
| [15] | Cascadian Region Earthquake Workgroup (CREW). (2013). Cascadian Sub-duction Earth Quakes: A Magnitude 9.0 Scenario Update 2013. Seattle, Washington: CREWW 1-23. |
| [16] | Wikipedia The Free Encyclopedia. (2015) The Columbia River. Retrieved on November5th 2015 From https://en.wikipedia.org/wiki/Columbia_River. |
| [17] | United States Geological Survey (USGS). (2000). Reducing The Risk From Coastal Geologic Hazards: Helping Coastal Communities at Risk From Tsunamis-The Role of US Geologic Survey Research. Menio Park, CA: USGS. |
| [18] | United States Bureau of the Census. (2011). Census Quick Facts. Washington, D.C: US Bureau of Census. |
| [19] | United States Bureau of the Census. (2014). Census Quick Facts. Washington, D.C: US Bureau of Census. |
| [20] | United States Bureau of the Census. (2010). Census Quick Facts. Washington, D.C: US Bureau of Census. |
| [21] | United States Bureau of the Census. (2008). American Community Survey. Washington, D.C: US Bureau of Census. |
| [22] | Pacific Northwest Seismic Network (PNSN). (2002). Earthquake Sources Overview. Washington, Seattle: University of Washington. |
| [23] | The City of Portland. (2004 December). Natural Hazard Plan Mitigation, City of Portland, Oregon: Office of Emergency Management, 1-7. |
| [24] | Metro Portland. (1999 June). Regional Hazard Mitigation Policy and Planning Guide: Reducing Disaster Losses. Sacramento, California: Robert Olson Consultants, 1-38. |
| [25] | San Diego County. (2004 March). Multijurisdictional Hazard Mitigation Plan. San Diego, California: United Disaster Council: 1-301. |
| [26] | Oregon Department of Geology and Mineral Industries (DOGAMI). (2008). Tsunami Hazards in Oregon. Portland, Oregon: DOGAMI, Oregon Geology Fact Sheet, 1-4. |
| [27] | City of Seattle. (2009 July). Seattle All- Hazards Mitigation Plan. The City of Seattle, Washington: Seattle Office of Emergency Management, 1-105. |

 Abstract
 Reference
 Full-Text PDF
 Full-text HTML