-
Paper Information
- Paper Submission
-
Journal Information
- About This Journal
- Editorial Board
- Current Issue
- Archive
- Author Guidelines
- Contact Us
American Journal of Environmental Engineering
p-ISSN: 2166-4633 e-ISSN: 2166-465X
2015; 5(4): 106-119
doi:10.5923/j.ajee.20150504.03
Quantification of Air Pollution in Kigali City and Its Environmental and Socio-Economic Impact in Rwanda
 Abstract
 Reference
 Full-Text PDF
 Full-text HTML
Jean Baptiste Nduwayezu1, 2, Theoneste Ishimwe1, Ananie Niyibizi1, Benjamin Ngirabakunzi1
1Institute of Scientific and Technological Research (IRST), Butare, Rwanda
2African Forest Forum (AFF), Nairobi, Kenya
Correspondence to: Jean Baptiste Nduwayezu, Institute of Scientific and Technological Research (IRST), Butare, Rwanda.
| Email: |  |
Copyright © 2015 Scientific & Academic Publishing. All Rights Reserved.
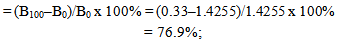
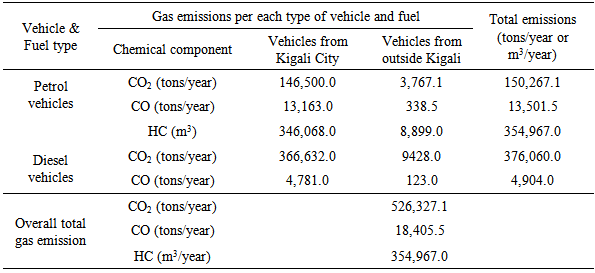
This 9-months study was conducted in Kigali City and Nyamagabe District during the 2012-2013 period with the overall aim of raising awareness about the benefits of cleaner energies (biodiesel) and human health risks and negative environmental and socio-economic impact of fossil fuels (petrol and petro diesel) that are commonly used in Rwanda. MAHA MGT 5 Emission Tester and MAHA MDO 2 LON Emission Tester/Opacimeter were used to measure gas emissions (CO2, CO, Unburned Hydrocarbons and Opacity) from gasoline or petrol and diesel vehicles respectively. Air composition (HCl, NO2, NO3, SO2, H2S, TVOC, O3, CO, CO2) in the study sites was measured using Gray Wolf-Advanced Sense HVAC Environmental Test Meter while water quality was analyzed at the Water Laboratory of the National University of Rwanda. Annually, a total of 526,327.1 tons of carbon dioxide (CO2), 18,405.5 tons of carbon monoxide (CO) and 354,967.0 m3 of unburned hydrocarbons (HC) are released into the atmosphere of Kigali City by both petrol and diesel vehicles. Using 100% Biodiesel reduced emission of CO by 50% and Opacity by 76.9% while using a Biodiesel-blend or Biodiesel-Diesel mixture (B50) reduced CO and Opacity by 35.2% and 71% respectively. In the Kitabi area surrounded by Nyungwe Forest Reserve air contaminants HCl, NO2, TVOC and O3 were reduced by 76.6%, 54.6%, 74.8% and 72.7% while NO3, SO2 and CO were reduced by 100% as compared with Kigali City respectively. Water contaminants were also higher in Kigali City than forested areas of Nyamagabe. It is concluded that continuous use of expensive fossil fuels may result in increased human health deterioration, environmental degradation, lowered human work productivity and slow economic growth in Rwanda. Using cleaner energies (i.e. biodiesel), however, results in improved human health, living environment and socio-economic development. Planting suitable tree species, frequent monitoring of imported fuel quality and establishment of new fuel quality regulations and guidelines, national ambient air quality standards and national air quality emission standards are very crucial if we are to assure our future generations of a quality life and living environment. However, more studies on pollution by all types of motor-vehicles, industries and other machinery are needed in Rwanda. Detailed studies on mathematical modeling of air pollutants in major cities of Rwanda are also urgently required to evaluate air pollution dispersion and assist in forecasting the air quality.
Keywords: Petrol, Petro diesel, Biodiesel, Pollution, Environment, Health, Economic development
Cite this paper: Jean Baptiste Nduwayezu, Theoneste Ishimwe, Ananie Niyibizi, Benjamin Ngirabakunzi, Quantification of Air Pollution in Kigali City and Its Environmental and Socio-Economic Impact in Rwanda, American Journal of Environmental Engineering, Vol. 5 No. 4, 2015, pp. 106-119. doi: 10.5923/j.ajee.20150504.03.
Article Outline
1. Introduction
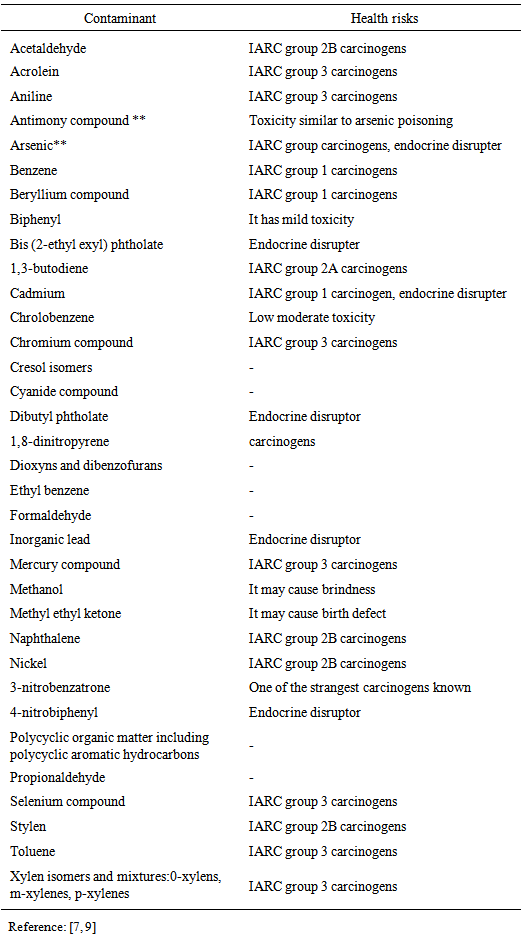
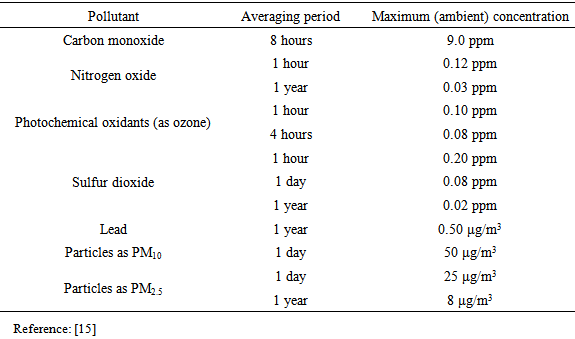
- Rising costs of fossil fuels and their associated pollution problems are among other serious threats to the economic development of Rwanda. Pollution is the undesirable change in the physical, chemical or biological characteristics of air, land and water that may be harmful to the human life, living conditions and cultural assets or that may waste or deteriorate raw natural resources [1].Petro diesel and gasoline/petrol are two types of fuels that are commonly used as major sources of energy and vehicle fuel in Rwanda. Fossil diesel also known as Petroleum diesel or Petro diesel is a liquid fuel (density: 0.832 kg/l) produced from the fractional distillation of crude oil between 200°C (392oF) and 350oC (662oF) at atmospheric pressure, resulting in a mixture of carbon chains that typically contain between 8 and 21 carbon atoms per molecule and hydrocarbons (75% saturated hydrocarbons and 25% aromatic hydrocarbons- naphthalenes and alkylbenzenes) having a high boiling point in the range of 180-360°C (360-680°F) (i.e. The average chemical formula for common diesel fuel is C12H23, ranging approximately from C10H20 to C15H28) [2, 3].Gasoline or petrol is a mixture of various hydrocarbons dominated by octane (C8H18) or a combination of heptanes, octane, a handful of other alkanes, plus additives including detergents, and possibly oxygenators such as methyl tert-butyl ether or ethanol/methanol (density: 0.745 kg/l) [4].Indoor and outdoor air pollution associated with the use of fossil fuels is a major environmental health problem affecting everyone in developed and developing countries like Rwanda. The indoor air pollution is estimated to cause approximately 2 million premature deaths mostly in developing countries with almost half of these deaths being attributable to pneumonia in children under 5 years of age, while the outdoor air pollution is estimated to cause 1.3 million deaths worldwide per year [5, 6]. Poor indoor air quality may pose a risk to the health of over half of the world’s population [6]. In developing countries, exposure to pollutants from indoor combustion of solid fuels on open fires or traditional stoves increases the risk of acute lower respiratory infections and associated mortality among young children [6]. Indoor air pollution from solid fuel use is also a major risk of factor for chronic obstructive pulmonary diseases and lung cancer among adults [6]. Even relatively low concentrations of air or exhaust pollutants (eg. Hydrocarbons, nitrogen oxides- NOx, carbon monoxide-CO, and carbon dioxide - CO2) have been related to a range of adverse health effects [6]. Approximately 1.5% of annual lung cancer deaths are attributable to exposure to carcinogens form indoor air pollution. Small particulate matter and other pollutants in indoor smoke inflame the airways and lungs, impairing immune response and reducing the oxygen-carrying capacity of the blood. Indoor air pollution was also reported to be closely linked with low birth weight, TB, ischaemic heart disease, nasopharyngeal and laryngeal cancers [5].Particulate matter (PM) composed mainly by sulfate, nitrates, ammonia, sodium chloride, carbon, mineral dust and water or consisting of a complex mixture of solid and liquid particles of organic and inorganic substances suspended in the air affects more people than other pollutant (Max. PM2.5: 10μg/m3 annual mean and 25 μg/m3 24-hour mean and Max. PM10: 20 μg/m3annual mean and 50 μg/m3 24-hour mean) [7-9, 6, 10]. Particles with an aerodynamic diameter smaller than 2.5 μm or PM2.5 are more dangerous since, when inhaled, they may reach the peripheral regions of the bronchioles, and interfere with gas exchange inside the lungs [6]. Chronic exposure to particles contributes to the risk of developing cardiovascular and respiratory diseases as well as lung cancer [6, 10]. In cities with high levels of pollution, the mortality exceeds that observed in relatively cleaner cities by 15-20% [6].Ozone at ground level (not to be confused with the ozone layer in the upper atmosphere) formed by the reaction with sunlight (photochemical reaction) of pollutants such as nitrogen oxides (NOx) from vehicles and industry emissions and volatile organic compounds emitted by vehicles, solvents and industry, is one of the major constituents of photochemical smog (Max. O3: 100 μg/m3 8-hour mean). Excessive ozone in the air can have a marked effect on human health by causing breathing problems, triggering asthma, reducing lung function and causing lung diseases. Several studies in Europe reported that the daily mortality rises by 0.3% and that increase in ozone exposure by 10 μg/m3 results in increased heart diseases by 0.4% [6].Nitrogen dioxide (NO2) is the main source of nitrate aerosols, which form an important fraction of particulate matter (PM2.5) and of ozone in the presence of ultraviolet light (Max. NO2: 40 μg/m3 annual mean and 200 μg/m3 1-hour mean). Epidemiological studies have shown that long-term exposure to NO2 resulted in increased symptoms of bronchitis in asthmatic children and reduced lung function [6, 10]. Sulfur dioxide (SO2) is a colourless gas with a sharp odour which is produced from the burning of sulfur-containing fossil fuels and the smelting of mineral ores that contain sulfur (Max. SO2: 20 μg/m3 24-hour mean and 500 μg/m3 10-minute mean) [6, 10]. Sulfur dioxide can affect the respiratory system and the functions of the lungs, and cause irritation of the eyes. Studies indicate that a proportion of people with asthma experience changes in pulmonary function and respiratory symptoms after periods of exposure to SO2 as short as 10 minutes. Inflammation of the respiratory tract causes coughing, mucus secretion, aggravation of asthma and chronic bronchitis and makes people more prone to infections of the respiratory tract. Hospital admissions for cardiac diseases and mortality increase on days with higher SO2 levels. When SO2 combines with water, it forms sulfuric acid (H2SO4) which is the main component of acid rain [6].Carbon monoxide (CO) is a product of incomplete combustion and occurs when carbon in the fuel is partially oxidized rather than being fully oxidized to carbon dioxide (CO2) [11, 12]. Carbon monoxide reduces the flow of oxygen in the bloodstream and is particularly dangerous to people with heart disease. Emission of carbon dioxide (CO2) can contribute to climate change which is a serious national and trans-national socio-economic complex problem caused by air pollution and the build-up of greenhouse gases into the atmosphere. Other chemical components found in the diesel exhaust and their health risks are given in Table 1 [7, 9].
|
|
2. Materials and Methods
2.1. Study Site Description
- This 9-months study was carried out in Kigali City (Latitude: 1° 57’ 13” S; Longitude: 30° 3’ 38” E; Altitude: 1567 m a.s.l; Average temperature: 20.5°C; Average humidity: 39%; Pressure: 1021 mbar; Rainfall: 1007 mm) and Nyamagabe District (Latitude: 2° 24’ 29” S; Longitude: 29° 28’ 5” E; Altitude: 2237 m a.s.l; Average temperature: 18°C; Rainfall range: 1300-1450 mm; humid tropical climate moderated by the effect of high altitude) during the 2012-2013 period (November 2012 - July, 2013). a) The sub-study on gas emissions by vehicles residing in Kigali City and those entering the city from outside was conducted at the Rwanda National Police Motor-vehicle Inspection Centre and 4 axes of Nyacyonga, Giticyinyoni, Gahanga and Regende which allow entrance in Kigali City. b) The sub-study on irrigation water quality was carried out at Rwintare water stream, Kinamba 2 water stream also known as Car-wash and Gitega Meteorology Station in Kigali and Kitabi Tea Factory Meteorology Station, Mwumba water stream in Kitabi (Latitude: 2°33’16” S; Longitude: 29°24’41” E; Average humidity: 38%; Pressure: 1009.26 mbar) and Nyamagabe Meteorology Station.c) A comparative sub-study on air composition was also carried out in Kigali City and Kitabi Tea Factory.
2.2. Experimental Procedures
2.2.1. Data Collection and Vehicle Sampling
- (i) Gas emissions from a representative sample of 1002 vehicles were measured at the Rwanda National Police Motor-vehicle Inspection Centre using MAHA MGT 5 Emission Tester for gasoline vehicles and MAHA MDO 2 LON Emission Tester/Opacimeter for diesel vehicles. The emission measurement probe CAR (10 mm) with 1.5 m hose was placed as far downstream in a section of the exhaust pipe where the distribution of smoke is approximately uniform. At the same period of gas emissions measurement at the Rwanda National Police Motor-vehicle Inspection Centre, 1535 vehicles entering Kigali City via Gahanga, Rugende, Giticyinyoni and Nyacyonga axes were also recorded.(ii) The air composition at Kitabi Tea Factory and the Rwanda National Police Motor-vehicle Inspection Centre working place at below ground and above ground levels was measured using Gray Wolf-Advanced Sense HVAC Environmental Test Meter.(iii) Samples for irrigation water quality determination were collected from Kitabi Tea Factory Meteorology Station, Mwumba water stream -Kitabi, Nyamagabe Meteorology Station, and Kigali (i.e. Rwintare water stream, Kinamba-2 water stream and Gitega Meteorology Station).
2.2.2. Calculation of Gas Emissions
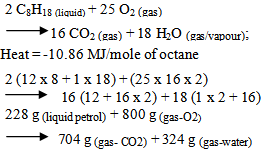
- (i) The combustion chemistry equation followed in the present study is shown below [16]:
 | (1) |
 | (2) |
 | (3) |
 | (4) |
 1 m3 of air; implying that 14.7 kg of air equals: 1m3 of air x 14.7/1.2875 = 11.42 m3 of air; every 1 kg of gasoline requires 11.42 m3 of air. Theoretical CO2 requirement:(i) 228 g of C8H18 gasoline produce 704 g of CO2; 1g of C8H18 produces: 704 g of CO2/228 = 3.09 g of CO2 or 1 kg of gasoline produces 3.09 kg of CO2(ii) Moles of CO2 in exhaust pipe = 3.09 g/44 g per mole = 0.07 moles of CO2(iii) Moles of N2 in exhaust pipe = 14.7 x 79/100 x 28 = 0.415 moles of N2(iv) Total moles of CO2 + moles of N2 = 0.07 + 0.415 = 0.485 moles of exhaust gases (CO2 + N2)(v) Theoretical CO2 % by volume = moles of CO2 x 100/total moles = 0.07 x 100/0.485 = 14.44% CO2 vol. Actual CO2:(i) Now that we know the theoretical air requirements and theoretical CO2 content of the exhaust pipe, the next step is to determine the actual CO2 % in the exhaust pipe gases.(ii) The % excess air will be calculated as follows:
 | (5) |
 | (6) |
 | (7) |
 | (8) |
 | (9) |
2.2.3. Water Quality Analysis
- Water quality was analyzed using standard methods at the Kigali Water Laboratory of the National University of Rwanda, Faculty of Science-Department of Chemistry. Conductivity, pH, total dissolved solids, turbidity, total alkalinity, chemical oxygen demand, biochemical oxygen demand, dissolved oxygen, organic matter, sulfates, sulfides, iron, manganese, aluminum, copper, cadmium, chromium, lead, zinc, sodium, oil and greases are among the water parameters measured.
2.2.4. Statistical Analysis
- Regression analysis following a linear regression model below was carried out to determine the pattern of correlation between age of the vehicle (manufacturing year) and concentrations of both CO, CO2 and unburned hydrocarbons:
 | (10) |
3. Results and Discussions
3.1. Quantity of Gas Emissions in Kigali City
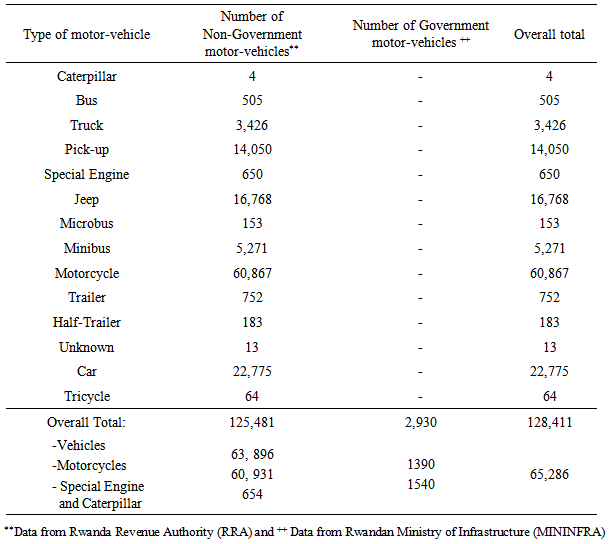
- Based on both the estimates by Kigali City indicating that 70% of vehicles in the country were in the city of Kigali and available records showing that 33% of the national fleet are diesel vehicles, it can be noted from Table 3 that in the country there are 42,376 diesel vehicles and 22,910 petrol vehicles with Kigali City having 29,663 diesel vehicles and 16,037 petrol vehicles. Petrol vehicles represent 54.1% of diesel vehicles.
|
|
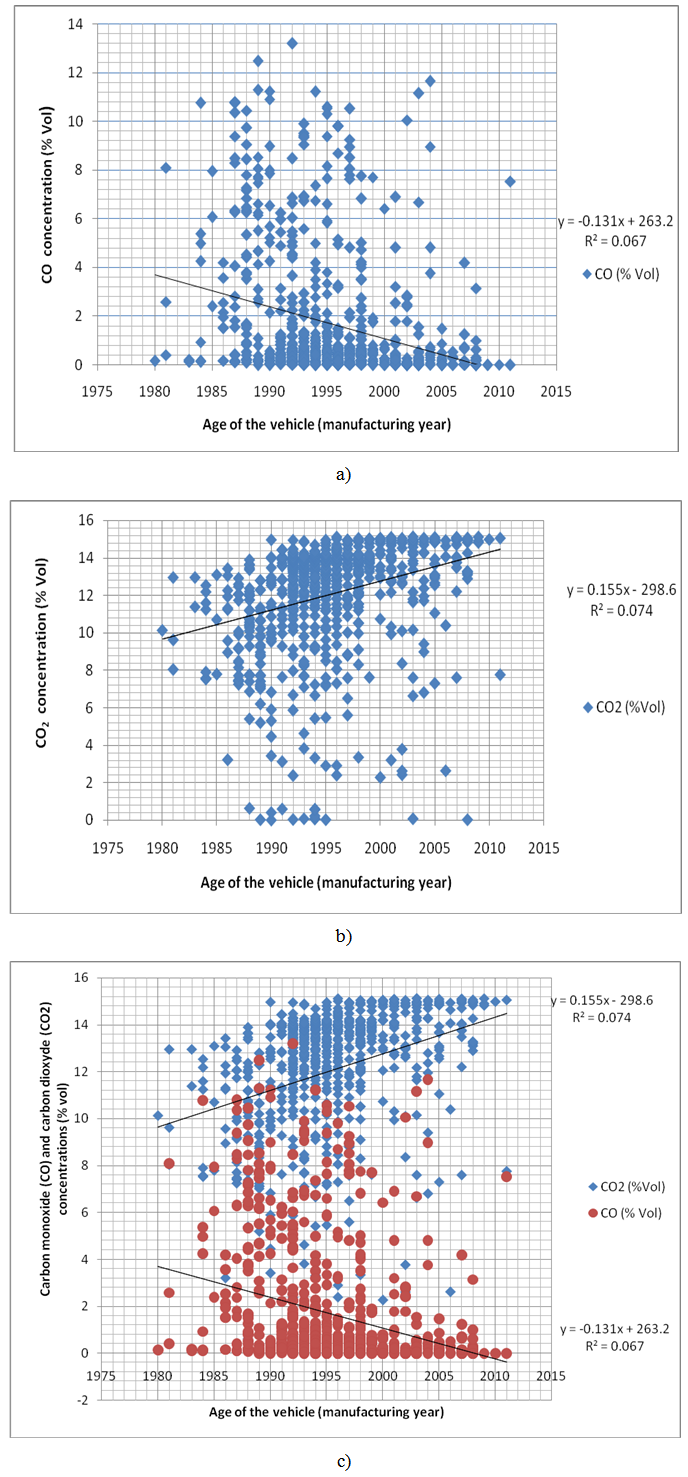 | Figure 1. Relationship between vehicle age and emission of both carbon monoxide (CO) and carbon dioxide (CO2) during the 2012-2013 testing period |
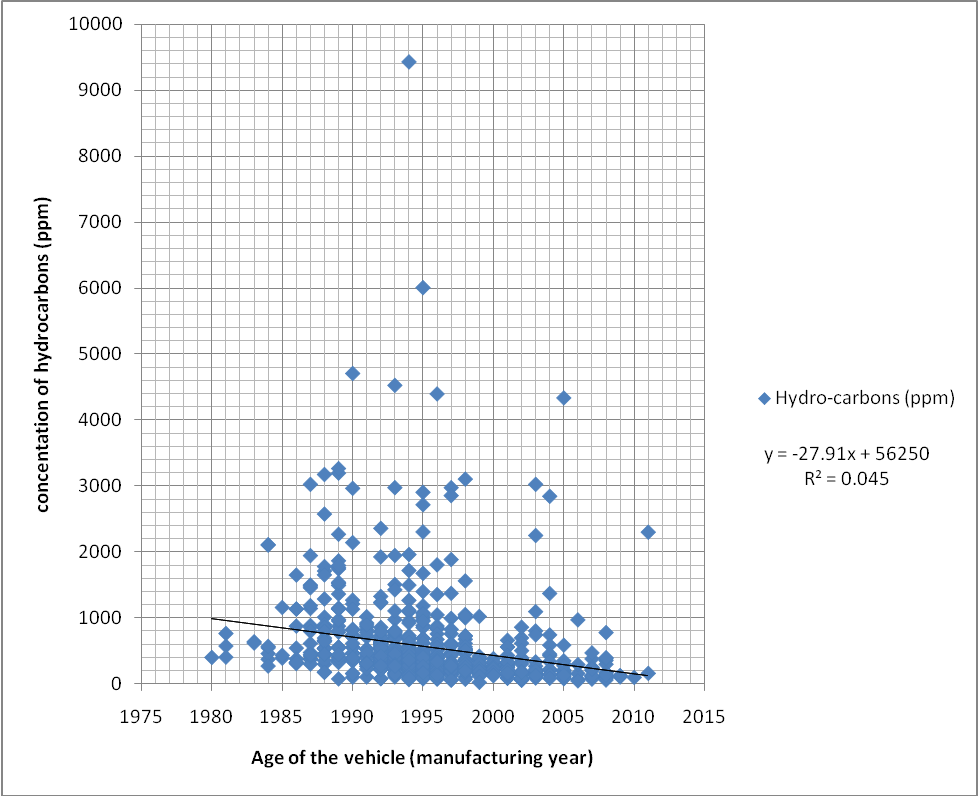 | Figure 2. Relationship between vehicle age and unburned hydro-carbons (HC) during the 2012-2013 testing period |
3.2. Air Contaminants and Irrigation Water Quality in Both Kigali City and Kitabi Area (Nyamagabe District)
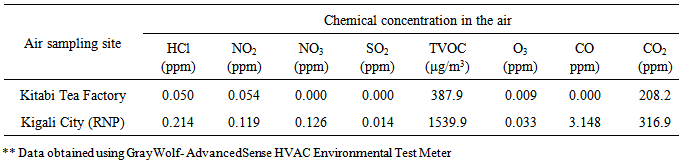
- As summarized in Table 5, the Kitabi area surrounded by Nyungwe Forest Reserve showed the lowest air contaminants as compared with Kigali City. In Kitabi area, HCl, NO2, TVOC and O3 were reduced by 76.6% (from 0.214 to 0.05 ppm), 54.6% (from 0.119 to 0.054 ppm), 74.8% (from 1539.9 to 387.9 μg/m3) and 72.7% (from 0.033 to 0.009 ppm) while NO3, SO2 and CO were reduced by 100% as compared with Kigali City respectively. These lowered levels of air pollutants in Kitabi area can probably be caused by high efficiency of photosynthetic process attributable to high and varied vegetation cover which is in conformity with other findings suggesting that trees and shrubs play an important role in the improvement of our living environment, climatic amelioration and carbon sequestration [19].
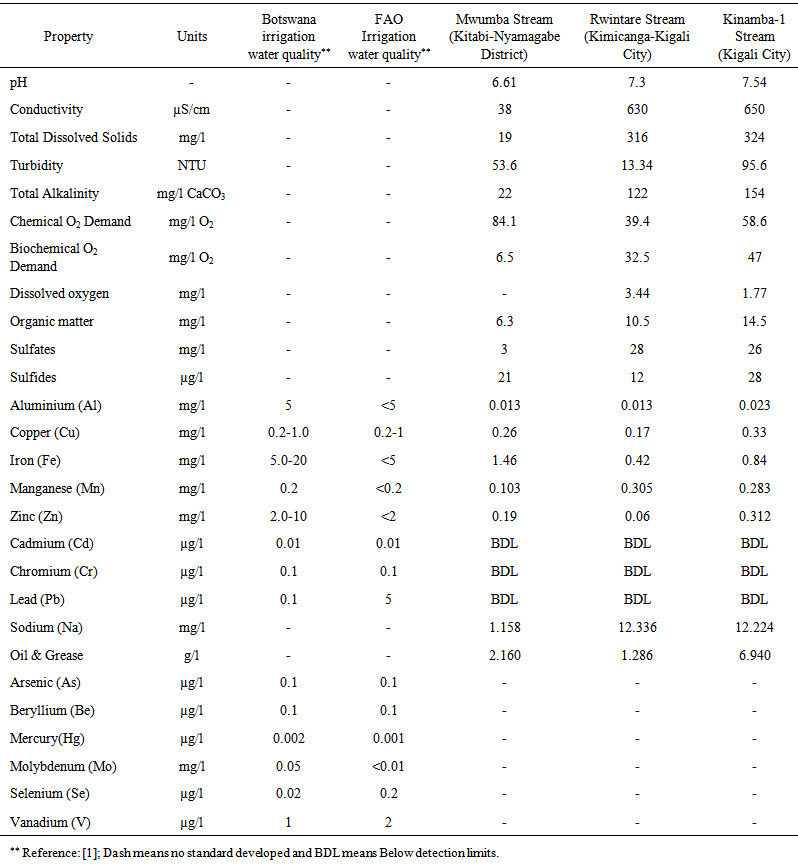 | Table 6. Heavy metal and trace element content of water collected from water streams in Kigali City, Kitabi and Nyamagabe areas during 2013 compared with irrigation water quality/standard of both Botswana and FAO |
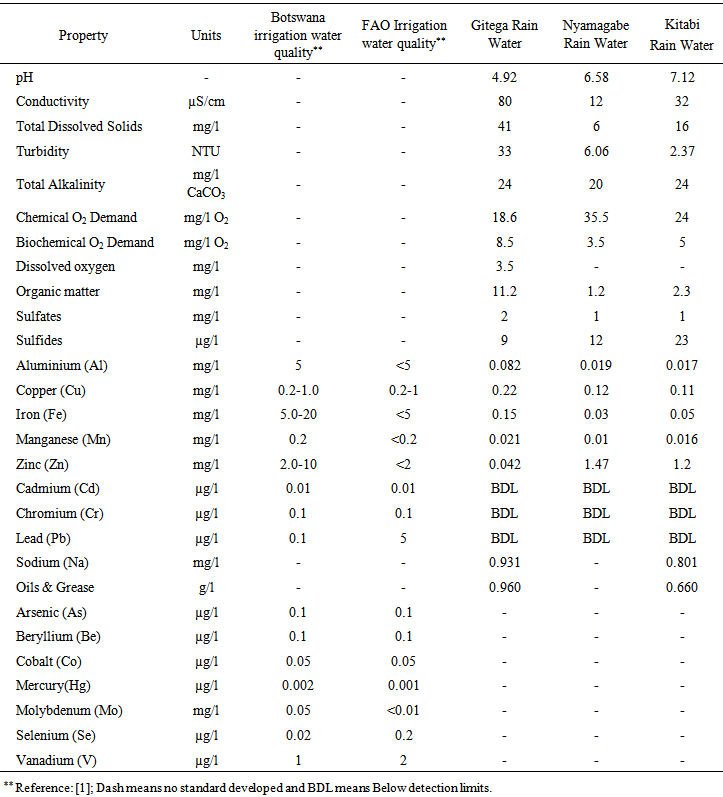 | Table 7. Heavy metal and trace element content of rain water collected from Meteorological Stations in Kigali City, Kitabi and Nyamagabe areas during 2013 compared with irrigation water quality/standard of both Botswana and FAO |
3.3. Health Risks of Fossil Fuels and Benefits of Biodiesel
- The lowered water pH levels (i.e. acid rain) and higher concentrations of air pollutants in Kigali City as compared with Kitabi area (Table 5) can lead to serious health and environmental problems in Rwanda. The findings from this study are in line with a wide range of studies on pollution [7, 10, 9, 18, 5-6] confirming that exposure to even relatively low concentrations of air pollutants results in increased incidence of premature mortality or morbidity and diseases such as cardiovascular and respiratory diseases, lung cancer, bladder cancer, aggravation of asthma, acute and chronic bronchitis, TB, chronic obstructive pulmonary disease, chronic inflammation and irreversible structural changes in the lungs, brain damage, impaired cognitive skills and difficulty in speaking and hearing. Studies in the United States [10] have also clearly demonstrated that the human health and environmental impacts of emissions include impaired air quality, damage to public health, degradation of visibility, acidification of lakes and streams, harm to sensitive and aquatic ecosystems and accelerated decay of materials, paints and cultural artifacts such as buildings, statues and sculptures which may also happen in Rwanda if no adequate measures are taken to effectively control pollution. SO2 and NOx emissions react to form acidic compounds that harm lakes and streams. Acidification (low pH) and the associated high aluminium levels make it difficult for some fish and other aquatic species to survive, grow and reproduce. Acid deposition can affect forest ecosystems directly by damaging plant tissues and indirectly by changing the chemistry of forest soils (eg. plant nutrients leaching from both plant parts and soils) and elevating levels of aluminium which can be directly toxic to plant roots. Acid particles and deposition also increased the rate of weathering for properties of aesthetic and historical value in the United States [10]. The results from the present study clearly demonstrated that biodiesel reduces health risks and environmental problems associated with petroleum diesel. As shown by the results from this study, using 100% Biodiesel in Rwanda, reduced emission of CO by 50% and Opacity by 76.9% while using a Biodiesel-blend or Biodiesel-Diesel mixture (B50) reduced CO and Opacity by 35.2% and 71% respectively which is a clear testimony that Biodiesel is, indeed a cleaner environmental-friendly energy for the future. These results are also in agreement with those from other studies showing that use of biodiesel reduced the exhaust emissions of sulfur by 100%, CO by 48%, CO2 by 78.5%, particulate matter by 30-47%, total hydrocarbons by 93%, polycyclic aromatic hydrocarbon compounds by 75-85%, 1-nitropyrene by 90% and the ozone (smog) forming potential of biodiesel by hydrocarbons by 50% as compared with petroleum diesel [11, 13, 8, 12, 14, 20]. Other studies also showed that on average the biodiesel blend (B20) caused particulate matter (PM), CO and unburned hydrocarbons emissions to be reduced by 16%, 17% and 12% relative to petroleum diesel respectively [21]. Lowering the concentrations of air pollutants will reduce greenhouse gases and contribute to the mitigation of climate change and global warming. The lower the levels of air pollution in a city, the better respiratory and cardiovascular health of the population will be [5], and the higher will be the work productivity and increased economic growth in the country.
4. Conclusions and Recommendations
- From this study, it is concluded and recommended that:● The continuous use of expensive fossil fuels may result in increased human health deterioration, environmental degradation, lowered human work productivity and slow economic growth in a highly populated and landlocked country like Rwanda● Using cleaner energies like biodiesel, however, results in improved human health, living environment and socio-economic development● Introducing a pollution tax and using this tax in tree planting program may result in increased vegetation cover and reduced gas emissions to the atmosphere● Beautification of cities, towns, settlements and avenues using suitable mixed ornamental tree species with high potential of increasing photosynthetic efficiency is advisable● Frequent monitoring of imported fuel quality and establishment of new fuel quality regulations and guidelines (eg. Ultra-low-sulfur diesel standard), national ambient air quality standards and national air quality emission standards are very crucial if we are to assure our present and future generations of a quality life and living environment● Since old vehicles showed the highest gas emissions as compared with new modern vehicles, the current tax policy needs to be revised to take into consideration of environmental concerns by reducing importation of highly-polluting motor- vehicles● Most staff at the Rwanda National Police Motor- vehicle Inspection Centre does not use the available protection equipment and materials. The use of these materials, therefore, need to be re-enforced. ● To minimize health risks, staff at the Motor- vehicle Inspection Centre also need to be rotated frequently implying that training of more operators is imperative. ● However, more studies on pollution by all types of motor-vehicles, industries and other machinery are needed in this country● Also assessment of the current health status of people exposed in highly polluted environments is required● Frequency of vehicle entrance in Kigali City also requires further investigations● Detailed studies on mathematical modeling of air pollutants in major cities of Rwanda are also urgently required to evaluate air pollution dispersion and assist in forecasting the air quality.
ACKNOWLEDGEMENTS
- The authors are very thankful to the Government of Rwanda for financing this study and the Institute of Scientific and Technological Research for providing technical and administrative support to this endeavour. Authors would also like to acknowledge the following institutions and individuals who kindly helped them during the preparation of this paper: Rwanda National Police (RNP) for not only providing the Emission Testers but also for her assistance in data collection at the RNP Motor-vehicle Inspection Centre, Kigali Institute of Science and Technology (KIST), Rwanda Environment Management Authority (REMA) and some IRST Staff members for their assistance in data collection. Authors are, similarly, indebted to Kigali City and Ministry of Infrastructure (MININFRA) for providing data on both Government and private motor-vehicles in Kigali City.
References
| [1] | Emongor, V.E., Ramolemana, G.M., Machacha, S., Khonga, E.B., and Marumo, K., 2005, The heavy metal content of Gaborone secondary sewage effluent in Botswana, Botswana Journal of Agriculture and Applied Sciences, 1 (1), 57-62. |
| [2] | Agency for Toxic Substances and Diseases Registry (ATSDR), 1995, Toxicological profile for fuel oils, Atlanta, GA: US Department of Health and Human Services, Public Health Service. |
| [3] | Collins, C.D., 2007, Implementing phytoremediation of petroleum hydrocarbons, Methods in Biotechnology, 23, 99-108. |
| [4] | Hillier, V.A.W., and Pittuck, F.W., 1966, "Sub-section 3.2", Fundamentals of motor vehicle technology, London: Hutchinson Educational, http://en.wikipedia.org/wiki /Air-fuel-ratio, Retrieved on October 30, 2013. |
| [5] | World Health Organization (WHO), 2011a, Indoor air pollution, Fact sheet No 292,www.who.int/mediacentre/factsheets/fs292/en/index.html, Retrieved on July 16, 2013. |
| [6] | World Health Organization (WHO), 2011b, Air quality and health, Fact sheet No313,www.who.int/mediacentre/factsheets/fs313/en/index.html, Retrieved on July 16, 2013. |
| [7] | United States Environmental Protection Agency (USEPA), 2002a, Health assessment document for diesel engine exhaust, Prepared by the National Centre for Environmental Assessment, Washington DC, for the Office of Transportation and Air Quality, EPA/600/8-90/057F May 2002, Available from: National Technical Information Service, Springfield, VA; PB 2002-107661 and |
| [8] | United States Environmental Protection Agency (USEPA), 2013a, Human health and environmental effects of emissions from power generation: Focus on sulfur dioxide (SO2), nitrogen oxides (NOx) and mercury (Hg),www.epa.gov/ airmarkets, Retrieved on July 17, 2013. |
| [9] | Lippmann, M., 2009, Environmental toxicants: Human exposures and their health effects, 2nd ed., John Willey & Sons, Inc., 981p. |
| [10] | United States Environmental Protection Agency (USEPA), 2002b, Human health and environmental effects of emissions from power generation, www.epa.gov/ airmarkets, Retrieved on July 17, 2013. |
| [11] | Thompson Mike, 2005, Carbon monoxide (H,C,V,J,M) - the poisonous gas from car exhausts. Winchester College, UK. |
| [12] | Institute of Scientific and Technological Research (IRST), 2008, Business plan for the Rwandan integrated biodiesel production project, IRST final report, 138 p. |
| [13] | Wikipedia, 2013, Diesel exhaust – occupational health effects, particulate health effects and chemical components, http://en.wikipedia.org/wiki/Diesel-exhaust, Retrieved on October 29, 2013. |
| [14] | Institute of Scientific and Technological Research (IRST), 2012, A feasibility study report for Rwanda biodiesel development project, IRST, 70 p. |
| [15] | National Environment Protection Council (NEPC), 2012, Ambient air quality standards, emission standards and air toxics, National Environment Protection Council- Australian Government - Department of Sustainability, Environment, Water, Population and communities,www.environment.gov.au/atmosphere/airquality/standards. html, Updated on December 6, 2012. |
| [16] | Toyota-USA, 2013, Emission analysis, Toyota motor sales, USA. Inc. |
| [17] | Uwingabire, B., 2009, Avantage comparative de la production du biodiesel et sa contribution à la réduction des dépenses en devise pour le Rwanda, BSc Dissertation, Independent University of Kigali (ULK). |
| [18] | Xing Wang, Dane Westerdahl, Ye Wu, Xiaochuan Pan, and Max Zhang, K., 2011, On-road emission factor distributions of individual diesel vehicles in and around Beijing, China, Atmospheric Environment Journal, (45), 503-513. |
| [19] | Nduwayezu, J.B., Ruffo, C.K., Minani, V., Munyaneza, E., and Nshutiyayesu, S., 2009, Know some useful trees and shrubs for agricultural and pastoral communities of Rwanda, Institute of Scientific and Technological Research, 264p. |
| [20] | United States Environmental Protection Agency (USEPA), 2013b, Biodiesel emissions, EPA Clean Air Act Section 211 (b) - National Biodiesel Board, USA, www.biodiesel.org and EPA’s Report: A comprehensive analysis of biodiesel impacts on exhaust emissions, www.epa.gov/ofag/models/ analysis/biodsl/p02001, Retrieved on July 17,2013. |
| [21] | McConnick, R.L., Williams, A., Ireland, J. Brimhall, M., and Hayes, R.R., 2006, Effects of biodiesel blends on vehicle emissions, National Renewable Energy Laboratory (NREL): A national laboratory of the U.S Department of Energy, Office of Energy Efficiency and Renewable Energy. Milestone Report NREL/MP-540-40554, October 2006. |