American Journal of Environmental Engineering

p-ISSN: 2166-4633    e-ISSN: 2166-465X

2015;  5(1): 21-31

doi:10.5923/j.ajee.20150501.02

Different Methods of Redistributing Bike among the Station: A Mathematical Solution in Order to Find Critical Stations

Siavash Shahsavaripour

School of Civil and Environmental Engineering, University of New South Wales (UNSW), Sydney, Australia

Correspondence to: Siavash Shahsavaripour , School of Civil and Environmental Engineering, University of New South Wales (UNSW), Sydney, Australia.

Email:

Copyright © 2015 Scientific & Academic Publishing. All Rights Reserved.

Abstract

One of the main encountered issues for transport engineers in order to develop a bike sharing system is redistribution of bikes among the stations. In order to understand the issue, assume that you want to hire a bike from bike sharing system and go to the bike stations which your trip will start from that station but you face that there is not any bike in bike station. Or assume that you used bike sharing system for your trip and want to give it back to the station in your destination but you face with a station with no empty place for your bike. The above mentioned situations should be solved by a transport engineer who is responsible for developing such a system. Different companies around the world suggested and implemented different solutions for this purpose. In this study, different solutions will be explained and defined with their real world implemented examples.

Keywords: Redistributing Bike, Critical Stations, Transport Engineers, Sharing System, Bike Sharing, Destination, Public Transportation, Civil Engineering, Environmental Engineering

Cite this paper: Siavash Shahsavaripour , Different Methods of Redistributing Bike among the Station: A Mathematical Solution in Order to Find Critical Stations, American Journal of Environmental Engineering, Vol. 5 No. 1, 2015, pp. 21-31. doi: 10.5923/j.ajee.20150501.02.

1. Introduction

One the most famous and successful solutions is given and implemented by Velib System, a famous bike sharing system in Paris, France, which told If a user arrives with a rented bicycle at a station without open spots, the terminal grants another fifteen minutes of free rental time [1-5]. The rental terminals also display information about neighboring Vélib’ stations, including location, number of available bicycles and open stands [6, 7]. Also, a special kind of vehicle is used to redistribute bikes among the stations over the night [8].
Some countries such as France, Spain, and Sweden use the same method as mentioned in 3, with a little difference [9]. These countries used specialized vans to redistribute bicycles between the stations [10]. It was useful for short time but by increasing the number of commuters, the number and frequency of vans was not sufficient for appropriate handling during the peak hours, making it very difficult to find critical stations at which to return the bike [11, 12].
Another method is suggested by Germany and Austria is that commuter should return the bike to the rental point [13]. This method is unfriendly for the users since the user prefers to back it to another place where he wants to stay more time than usual [14, 17, 23]. No redistribution is required in this method [14-24].
Netherland introduce another method which users were able to reserve a parking or bikes at any stations that they want for their destinations. By using such a system, the operator of bike system is able to redistribute the bikes between the stations by knowing the exact number of demands between the stations [25]. Unfortunately, this system failed because of high rate of theft [26-29].
Buffalo Blue Bicycle Program (Buffalo, NY) is another bike sharing system with new method for redistributing bicycles [30]. The program relies on its membership. All members must either pay a US$25 seasonal fee for use, or agree to work as volunteer for minimum of six hours of week to help run Buffalo Blue Bicycle [31-50]. Volunteers can also carry out other duties to improve the program, such as: help for maintaining and developing the website and redistributing bicycles between stations [51, 52].

2. Green Transport System

The performances of transportation system and its components are measured based on effectiveness and efficiency. However, the standardizing of environmental impacts of the transportation system should be considered for traffic participants, roads, and infrastructure from planning to operation, due to special attention of the concept of sustainability to this issue. As about 75% of the world’s total carbon dioxide emissions from fossil fuel combustion and more than 20% of world energy consumption are related to the road transport and the transportation systems, respectively, solving such environmental problems and the methods for balancing the energy saving and the demand of mobility are significantly under consideration. Today, there is a high attention to the green traffic and green transportation system as sustainable approaches [53].
It is confirmed that green vehicles, smart road, C-2-X communications for green intelligent transportation systems control, and green urban traffic are of significant effectiveness. It believes that green vehicles are more environmentally friendly than conventional internal combustion engine vehicles due to their critical characteristic which is using new alternative energy instead of gasoline or diesel. Various energy types are used in green vehicles such as electricity, hybrid electricity, compressed air/natural gas, biofuel, solar power, and so on. By fast developing of green vehicles in recent years, it is expected that various challenges will be raised in the manufacture, use of vehicles and the service provided by traffic system [54].
The traffic information network is founded by smart road; C-2-X communications including communications between/among vehicles, roadways, roadside, backend infrastructure, and so on; and the assistance systems based on driver-vehicle unit. Its consequence is a smooth, efficient, and accident-free traffic. It hopes that the ongoing information system in ITS and driver assistance systems will be able to not only guide the road users and, but also contribute to the emission control and safety [55].
High traffic demands and deteriorating environment adversely affect densely populated cities. By increasing the value of public transportation for controlling CO2, air pollution, and noise, walking and cycling traffics are critically motivated. The green urban traffic will be very useful for improving the traffic conditions and in turn, the productivity of cities as it mitigates overcrowded traffic and delay. Moreover, vulnerable road users will have more safety when a user-oriented urban traffic is under operation [56].
The green transportation system (GTSS) is intended to be a key objective for acquiring eco-friendly transportation systems and safety [57].
Figure 1. Redistribution of bikes by truck

3. A Mathematical Solution in Order to Find Critical Stations

3.1. Problem

The below map, which contains situation of a part of bike sharing stations, is given to find critical stations. This map belongs to bike sharing system of Washington DC. The Smart Bike system was originally opened to the public in August 2008, with 60 bikes distributed among seven fixed stations. As the system grew, a total of 1100 bikes were distributed among 110 stations in 2011. This map belongs to area where is next to Ronald Reagan international airport.
Figure 2. Special vehicle using to redistribute the bicycle
Figure 3. A user redistribute bikes among the station as volunteer

3.2. Methodology

A way for handling this problem is using HITCHHIKER method which is so famous among engineers. This method is using two matrixes: first probabilistic matrix which tells us the probability of destination of bicycle and another one is bicycle matrix which tells us the number of bicycles in each station. Then, this method continues to work by multiplying these matrixes together and using the result of this function as the new entry of the next iteration. Finally, by repeating this iteration for at least 10 times, the critical stations will be appeared.

3.3. Solution

At first, the below network is extracted from Figure 4. There are 14 stations and each node represented the bicycle station:
Then, distances between each node and the closest node are determined by using Google Earth: (distances are in Km). Although the line is shown by direct line, the numbers are actual distances not direct ones.
Since the real probability between each node is unknown, the above network (distance network) is used to estimate the probability. It means: the shorter the distance, the more probability the link. By using the mentioned method or using the below formula each probability can be extracted:
The below probabilities are not from above distribution. These are arbitrary assumed values because the above method gave fraction not easy to comprehend as an example application.
Figure 4. Washington network of bike sharing system
From above network, the below matrix can be extracted:
(1)
The number of bicycles at each station is determined by searching the operation website. So, the below matrix is derived from the website:
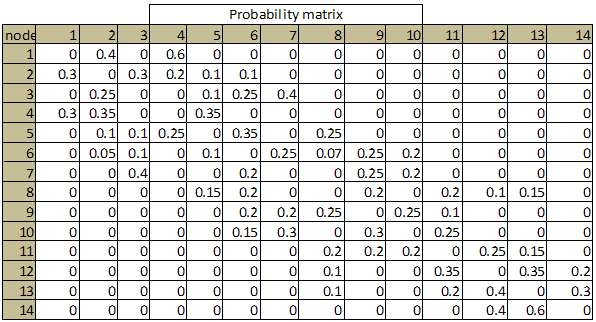
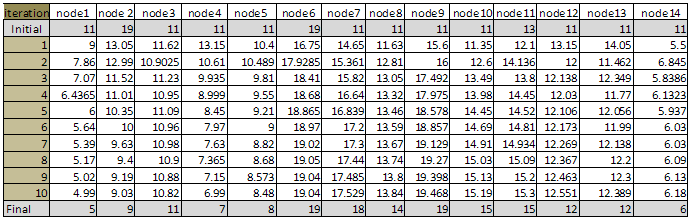
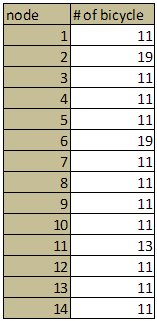
By applying the HITCHHIKER method, which is mentioned earlier, the below table is derived after ten times:
Table 1. Hitchhiker results after each iteration
     
By comparing the initial number of bicycles with the final result, which derived from more than 20 times of above iteration, the following results are derived:
Table 2. Initial number of bicycle at each station and final result of hitchhiker method
     
Figure 5. Washington bike sharing network
Figure 6. Distances between each stations
Figure 7. Probability of each links of network

4. Results and Discussion

By looking at Table 2, it is derived that the very big differences are located at stations 2, 7, and 9. In order to solve the problem of these stations, using the truck is suggested to redistribute bikes since these big differences between the initial number of bikes and final number of bikes shows that other methods cannot handle this problem. Therefore, the truck is the best choice for these stations. It means that after seven iterations, the truck should go to stations number 7 and 9, picks up the bikes and then go to station number 2 to put those there.
On the other hand, there are small differences between the initial number of bicycles and the final number of bikes in other stations. So, by applying the encouraging solution which tell If a user arrives with a rented bicycle at a station without open spots, the terminal grants another Fifteen minutes of free rental time or if the user deliver this bike to another station the system will give him 15 minutes free rental time in next time of using bike sharing system.
Also, there are more different solutions for handling of the mentioned problem. The method which is used to handle this problem is also depending on our community which this system is designed for it.
Finally, technical situation, social situation, and many different factors should be mentioned to handle such a problem.
Since 1960s, many bike sharing systems have been installed which can be used as useful references for case study examination. Not only all bike sharing systems do not have the same operational model, but also they didn’t face the same problem or they were not successful as the same level. . In order to find an appropriate case study and useful example, some standards should be defined. The chosen standards developed priorities that can be listed as below:
• They installed in appropriate area which has the acceptable level of population or the population density should be in acceptable range in an area which this system was installed.
• These systems implemented in cities that have the same social and economical context with the city which the new system aimed to install.
• Bike sharing system which wants to mention should have enough history or available data for analysis.
• Bike share systems were generally considered to be “successful”. For the purposes of this study, “successful” systems were those that continue to be operational at the time of writing, and had received a significant amount of international attention through media reports, academic studies and technical analysis. Other measures of success are the extent to which a system was used, shifted travel from auto trips to cycling, created a cycling culture and/or improvements to cycling infrastructure, raised the profile of cycling, resulted in the avoidance of greenhouse gas and air contaminant emissions, and supported other sustainable transport modes including transit.
In general, European people not only have more psychology of cycling but also have more culture of cycling than other parts of the world. On the other hand, we have some successful practice of bike sharing system in other parts of the world such as north of America. So, the examples are written by corresponding to above filters. All of the examples below are belong to the third generation of bike sharing systems.
Washington’s government implemented a bike sharing program, called SmartBike, which inspired from success of bike sharing program in Europe (Bike share Program investigation, 2009). The District Department of Transportation signed a contract to Clear Channel, a US-based media/advertising company that also operates public bike systems in Barcelona, Milan and ten other cities in Europe. Washington has total population of 5.3 million in metro area and population density of 3700 people/km2. Bike sharing system started to work with 60 bikes which distributed among seven stations in 2008 and with growing of the system, the total 1100 bikes distributed among 110 stations.
Each station consists of a rental kiosk and some docking places which the number of bikes in each station depends on the demand for bike on that particular point of the city. The rental kiosk is a vertical pillar, identifying the station, and the docking points are located on a horizontal bar, which includes locking mechanism. Users can collect and drop off bicycles by using credit card or other magnetic strip, known as the smart cart system. Users can rent bicycle from 6 AM to 10 PM and can return it any time they want.
Users should have at least 18 years old and buy $40 annual membership in order to become a bike sharing system member as a user.
The membership allows users an unlimited number of rentals, with a maximum rental time of three hours without any additional charge. After three hours, penalties, such as suspension of rental privileges, may apply. Also if a user did not return the bike during the past 24 hours, the system will fine him $550 as a price of bicycle (Bike share Program investigation, 2009).
Any potential need for redistribution of the bikes among the stations is handled by the service team. Locations for the bike share system terminals were decided upon based on: nearby transit stops, area jobs, population density and proximity to desirable destinations. Survey results also helped direct the choice of bike share system station locations.
The most important aspect of Smartbike system is automatic feature of it since each station is in connection with all other stations to help not only the user to find next station, but also analyze the number of bikes in each station.
The main challenges of setting up the SmartBike DC program to date were: selecting terminal locations; construction and installation of bike share system stops; and installing electronic infrastructure required to power the docking racks.
In contrast to these challenges, the SmartBike DC program appears to be growing in popularity; in October 2008, less than three months after SmartBike DC’s launch, the system had 930 registered users and an average of 150 daily users. Because of the steady growth of the user base, an expansion of the system is currently being planned (Bike share Program investigation, 2009).
Velib’ is a bike sharing system that operating in Paris, France. This system started to work in 2007 with 450 stations and 12250 bikes. As it grows, the number of stations reached to 1450 with 20600 bikes in less than one year. It was one of the most successful systems around the world since the rate of success was extremely high in compare with other bike sharing systems. Also, the annual members of bike sharing system became 100,000 with the average of ten times per bike per day usage in less than one year. . Now, the system in Paris is well-known over the world as an example of how bike share systems can be introduced to a major urban centre in the twenty-first century.
Recently Paris had chance to complete street furniture including the provision of bike sharing system. After Paris, Lyon, another important city of France, implemented the same bike sharing system around itself.
In both cases, a public-private partnership (PPP) was chosen, and the French advertising Company JC Decaux S.A. was selected since bike sharing system is not profitable by itself.
According to evident usage which is available through a customer survey conducted by the City and performed in early 2008, it has been recognized that on average, users have the following profile:
• Mean Age: 35 years old;
• Gender: More than half of the annual subscribers are men (58%), while the majority of occasional users (weekly and daily subscriptions) are women (65%); and;
• Usage: 71% are using Velib’ for professional and other utilitarian purposes (Commuting-to-work, to-school, business appointments and shopping) (Bike Sharing/ Public Bikes, 2009).
Within the first year of implementation, when the system wasn’t complete as much as today, the bike usage increased by 70% and it is extremely high among all other bike sharing system affections.
Favorable climate and good cycling conditions, organizational factors (the presence of a local champion) , financial factors, the existence of a suitable urban density, accessibility to service (in terms of price as well as physical proximity of the target market to the infrastructure), and ease of usage are other key components of this successful bike share system.
Bicing is the name of bike sharing program which implemented in Barcelona, Spain, since 2007. This system is so similar to velib’ bike sharing program in Paris since all of these programs use the same system as their bike sharing program. Bicing program purpose is to cover the small and medium daily routes within the city in a climate friendly way, almost without pollution (especially the emission of finest particulate matter), roadway noise, traffic congestion, and to reclaim the urban streets with non-polluting vehicles.
User should buy annual membership card if he/she wants to use this system. This system currently consists of 400 stations with 3000 bicycles which distributed among them. All of the stations are situated among the flat area of the city with the maximum distance of 400 meters between each station. The user can borrow the bike from any station and return it to any station that want as his/her destination.
Each station has between 15 and 30 parking slots to fix and lock the bicycle. To rent a bike, one simply swipes the contactless membership card at a service station to be personally identified by the system, and then unlocks a bike from the support frame.
Bicycles can use for first 30 minutes free and after that the user will charge 0.50€ for the next two hours. Use of a bicycle for more than 2 hours at a time is discouraged with a penalty rate of 3 € per hour, but also with the possibility of having your membership cancelled after a certain number of uses in excess of 2 hours.
More than 95% of users return the bike in less than 30 minutes but if a user wants to use bike sharing system again, freely, he/she should wait for 10 minutes to use the bike sharing system for another 30 minutes free. Although there are over 90,000 registered users as of September 2007, only 1/3 of them are using the system on a regular basis.
By the end of the year, Bicing program planned to offer 3000 bicycles at 200 stations and by spring 2008 quadrupling to 6000 bikes at 400 stations to cover approximately 70% of the city area, except areas with slopes of more than 4% and the hilly area of Montjuic and Tibidabo (Students Today, Citizens Tomorrow, 2009).
Stockholm City Bike is the name of bike sharing program which implemented in Sweden. Public and private company are became partner to operate this program. This bike sharing program allows users to hire bike for maximum 3 hours per each day from 6 am to 10 pm.
The membership card is necessary to hire or return a bike. These are obtained by buying a seasonal card (for 250 Swedish kronor SEK) or 3-days card (for 125 Swedish kronor SEK).
The private partner in this program is able to advertise by using the body of bicycle or station. The season card entitles the buyer to receive a free bicycle helmet that is decorated with advertising. The entire system is financed by advertising sold and managed by Clear Channel Communications (private partner).
Figure 8. Washington bike sharing system
Figure 9. Washington smartbike
Figure 10. Paris bike sharing system (velib’)
Figure 11. Paris bike sharing system (velib’)
Figure 12. Bike sharing system in Barcelona
Figure 13. Bicing program in Barcelona
Figure 14. Bike sharing program in Sweden
Figure 15. Bike sharing program in Stockholm
This system is a little unfriendly since it is hard for foreigners to use this system since the user should know Swedish language to able use the system; if the user doesn’t know Swedish language, it became hard for him/her to use this system.
One of the biggest problems of this system is vandalism and theft, since the operator stated that if the vandalism or theft doesn’t stop the program is going to become so expensive and then it will be cancelled.

5. Conclusions

One of the main issues that advanced countries are faced these days is green transport systems which don’t have any bad effect for our environment. Bike sharing system is one of the green transport systems that attract a lot of attention. The aim of this research was to provide a good help for transport engineers who want to develop such a system for their cities. It is derived that there isn’t any complete research in this area by reading different journals and papers. The above aim is achieved by defining all steps that involve in developing a transport system and then, all the steps are linked to the current problem (developing bike share system) and each step is defined in details. Finally, four international outlooks are explained, in details, to make a good resource for reader as successful samples to compare with their own situation and help them to make a best decision. After reading this research, it hopes that reader be able to define bike sharing system, and understand the process of developing bike sharing system. Also the reader will be able to handle redistribution, cost, and partnership problems as explained above.

References

[1]  Simon Feeny, Lachlan McDonald, Alberto Posso, Are Poor People Less Happy? Findings from Melanesia, World Development, Volume 64, December 2014, Pages 448-459.
[2]  Ana Beatriz Pereira Segadilha, Suely da Penha Sanches, Identification of Factors that Influence Cyclistś Route Choice, Procedia - Social and Behavioral Sciences, Volume 160, 19 December 2014, Pages 372-380.
[3]  Mazen Danaf, Maya Abou-Zeid, Isam Kaysi, Modeling travel choices of students at a private, urban university: Insights and policy implications, Case Studies on Transport Policy, Volume 2, Issue 3, December 2014, Pages 142-152.
[4]  David Lorenzi, Jaideep Vaidya, Soon Chun, Basit Shafiq, Vijayalakshmi Atluri, Enhancing the government service experience through QR codes on mobile platforms, Government Information Quarterly, Volume 31, Issue 1, January 2014, Pages 6-16.
[5]  George L. Boggs, Listening to 21st century literacies: Prehistory of writing in an academic discipline, Linguistics and Education, Volume 29, April 2015, Pages 15-31.
[6]  Araz Taeihagh, René Bañares-Alcántara, Moshe Givoni, A virtual environment for the formulation of policy packages, Transportation Research Part A: Policy and Practice, Volume 60, February 2014, Pages 53-68.
[7]  Matthew T. Carlson, Morgan Sonderegger, Max Bane, How children explore the phonological network in child-directed speech: A survival analysis of children’s first word productions, Journal of Memory and Language, Volume 75, August 2014, Pages 159-180.
[8]  Dario Hidalgo, Robin King, Public transport integration in Bogotá and Cali, Colombia – Facing transition from semi-deregulated services to full regulation citywide, Research in Transportation Economics, Volume 48, December 2014, Pages 166-175.
[9]  Staci M. Zavattaro, Joshua J. Daspit, Frank G. Adams, Assessing managerial methods for evaluating place brand equity: A qualitative investigation, Tourism Management, Volume 47, April 2015, Pages 11-21.
[10]  Karen Vitak, Chapter 14 - Organ Transplantation, In Acute Care Handbook for Physical Therapists (Fourth Edition), edited by Jaime C. PazMichele P. West, W.B. Saunders, St. Louis, 2014, Pages 335-356.
[11]  Manisha Anantharaman, Networked ecological citizenship, the new middle classes and the provisioning of sustainable waste management in Bangalore, India, Journal of Cleaner Production, Volume 63, 15 January 2014, Pages 173-183.
[12]  Jennifer L. Kent, Carsharing as active transport: What are the potential health benefits?, Journal of Transport & Health, Volume 1, Issue 1, March 2014, Pages 54-62.
[13]  Jörg Firnkorn, Martin Müller, Free-floating electric carsharing-fleets in smart cities: The dawning of a post-private car era in urban environments?, Environmental Science & Policy, Volume 45, January 2015, Pages 30-40.
[14]  Shailesh Chandra, Safety-based path finding in urban areas for older drivers and bicyclists, Transportation Research Part C: Emerging Technologies, Volume 48, November 2014, Pages 143-157.
[15]  Maike Puhe, Integrated Urban E-ticketing Schemes – Conflicting Objectives of Corresponding Stakeholders, Transportation Research Procedia, Volume 4, 2014, Pages 494-504.
[16]  Luc Belling, Julia de Bres, Digital superdiversity in Luxembourg: The role of Luxembourgish in a multilingual Facebook group, Discourse, Context & Media, Volumes 4–5, June–September 2014, Pages 74-86.
[17]  Julia Leventon, Felix K. Kalaba, Jen C. Dyer, Lindsay C. Stringer, Andrew J. Dougill, Delivering community benefits through REDD: Lessons from Joint Forest Management in Zambia, Forest Policy and Economics, Volume 44, July 2014, Pages 10-17.
[18]  Belkacem Chikhaoui, Shengrui Wang, Tengke Xiong, Hélène Pigot, Pattern-based causal relationships discovery from event sequences for modeling behavioral user profile in ubiquitous environments, Information Sciences, Volume 285, 20 November 2014, Pages 204-222.
[19]  Pierfrancesco Bellini, Monica Benigni, Riccardo Billero, Paolo Nesi, Nadia Rauch, Km4City ontology building vs data harvesting and cleaning for smart-city services, Journal of Visual Languages & Computing, Volume 25, Issue 6, December 2014, Pages 827-839.
[20]  Juliette Seban, Josselin Thuilliez, Vincent Herbreteau, Possession of bed nets in Haut-Katanga (DRC): Prevalence-elastic behaviour or performance of health care system delivery?, Health & Place, Volume 24, November 2013, Pages 275-285.
[21]  Philip J. Vergragt, Halina Szejnwald Brown, Sustainable mobility: from technological innovation to societal learning, Journal of Cleaner Production, Volume 15, Issues 11–12, 2007, Pages 1104-1115.
[22]  Pekka Jäppinen, Renata Guarneri, Luis M. Correia, An applications perspective into the Future Internet, Journal of Network and Computer Applications, Volume 36, Issue 1, January 2013, Pages 249-254.
[23]  Yuri Queiroz Abreu Torres, Lucia Maria Sá Antunes Costa, Digital Narratives: Mapping Contemporary Use of Urban Open Spaces through Geo-social Data, Procedia Environmental Sciences, Volume 22, 2014, Pages 1-11.
[24]  Anna Kramers, Mattias Höjer, Nina Lövehagen, Josefin Wangel, Smart sustainable cities – Exploring ICT solutions for reduced energy use in cities, Environmental Modelling & Software, Volume 56, June 2014, Pages 52-62.
[25]  Jan Aidemark, Linda Askenäs, Jan Mårtensson, Anna Strömberg, Challenges for Heart Failure Patients’ Self-Care Systems – Analysis of Patients’ Needs, Procedia Technology, Volume 16, 2014, Pages 1256-1264.
[26]  Sigal Kaplan, Konstantinos Vavatsoulas, Carlo Giacomo Prato, Aggravating and mitigating factors associated with cyclist injury severity in Denmark, Journal of Safety Research, Volume 50, September 2014, Pages 75-82.
[27]  Matthias Barth, Maik Adomßent, Daniel Fischer, Sonja Richter, Marco Rieckmann, Learning to change universities from within: a service-learning perspective on promoting sustainable consumption in higher education, Journal of Cleaner Production, Volume 62, 1 January 2014, Pages 72-81.
[28]  Sigrun Birna Sigurdardottir, Sigal Kaplan, Mette Møller, The motivation underlying adolescents׳ intended time-frame for driving licensure and car ownership: A socio-ecological approach, Transport Policy, Volume 36, November 2014, Pages 19-25.
[29]  Jennifer D. Wood, Laura Beierschmitt, Beyond police crisis intervention: Moving “upstream” to manage cases and places of behavioral health vulnerability, International Journal of Law and Psychiatry, Volume 37, Issue 5, September–October 2014, Pages 439-447.
[30]  Chorng-Shiuh Koong, Tzu-I Yang, Chao-Chin Wu, Han-Tai Li, Chien-Chao Tseng, An investigation into effectiveness of different reflective learning strategies for learning operational software, Computers & Education, Volume 72, March 2014, Pages 167-186.
[31]  Christian M.I.M. Matthiessen, Abhishek Kumar Kashyap, The construal of space in different registers: an exploratory study, Language Sciences, Volume 45, September 2014, Pages 1-27.
[32]  Levi Vermote, Cathy Macharis, Joachim Hollevoet, Koen Putman, Participatory evaluation of regional light rail scenarios: A Flemish case on sustainable mobility and land-use, Environmental Science & Policy, Volume 37, March 2014, Pages 101-120.
[33]  Manish Shirgaokar, Employment centers and travel behavior: exploring the work commute of Mumbai’s rapidly motorizing middle class, Journal of Transport Geography, Volume 41, December 2014, Pages 249-258.
[34]  Sally Cairns, Clare Harmer, Jean Hopkin, Stephen Skippon, Sociological perspectives on travel and mobilities: A review, Transportation Research Part A: Policy and Practice, Volume 63, May 2014, Pages 107-117.
[35]  J. Andrew Kelly, Miao Fu, Sustainable school commuting – understanding choices and identifying opportunities: A case study in Dublin, Ireland, Journal of Transport Geography, Volume 34, January 2014, Pages 221-230.
[36]  Jiangping Zhou, Enda Murphy, Ying Long, Commuting efficiency in the Beijing metropolitan area: an exploration combining smartcard and travel survey data, Journal of Transport Geography, Volume 41, December 2014, Pages 175-183.
[37]  Francois Sprumont, Francesco Viti, Geoffrey Caruso, Ariane König, Workplace Relocation and Mobility Changes in a Transnational Metropolitan Area: The Case of the University of Luxembourg, Transportation Research Procedia, Volume 4, 2014, Pages 286-299.
[38]  Markus Mailer, Gebhard Wulfhorst, Klaus Bogenberger, Sven Kesselring, Martin Keil, Michael Reiter, Mobility 2050. Region of Munich – Creating a Common Vision for Sustainable Development in an Unique Public Private Cooperation, Transportation Research Procedia, Volume 4, 2014, Pages 557-565.
[39]  Ronald M. Dell, Patrick T. Moseley and David A.J. Rand, Chapter 1 - The Evolution of Unsustainable Road Transport, In Towards Sustainable Road Transport, edited by Ronald M. DellPatrick T. MoseleyDavid A.J. Rand, Academic Press, Boston, 2014, Pages 1-64.
[40]  Jacqueline L. Kirk, Abigail L. Bristow, Alberto M. Zanni, Exploring the market for Compressed Natural Gas light commercial vehicles in the United Kingdom, Transportation Research Part D: Transport and Environment, Volume 29, June 2014, Pages 22-31.
[41]  Lara Johannsdottir, Brynhildur Davidsdottir, Michael E. Goodsite, Snjolfur Olafsson, What is the potential and demonstrated role of non-life insurers in fulfilling climate commitments? A case study of Nordic insurers, Environmental Science & Policy, Volume 38, April 2014, Pages 87-106.
[42]  Lekelia Danielle Jenkins, From conflict to collaboration: The role of expertise in fisheries management, Ocean & Coastal Management, Volume 103, January 2015, Pages 123-133.
[43]  Andrew Bell, Jessica Bunning, Pan Genxing, Natarajan Ishwaran, Warwick Manfrinato, Zhijun Yi, Low carbon land development: Is there a future for integration across sectors?, Environmental Development, Volume 11, July 2014, Pages 175-189.
[44]  Julie Bergeron, Sylvain Paquette, Philippe Poullaouec-Gonidec, Uncovering landscape values and micro-geographies of meanings with the go-along method, Landscape and Urban Planning, Volume 122, February 2014, Pages 108-121.
[45]  Lacey M. Raak, Chapter 9 - Think Globally, Act Locally, and Plan Nationally An Evaluation of Sustainable Development in Indonesia at National, Regional, and Local Levels, In Global Sustainable Communities Handbook, edited by Woodrow W. Clark, Butterworth-Heinemann, Boston, 2014, Pages 125-215.
[46]  Ayelet Gal-Tzur, Susan M. Grant-Muller, Tsvi Kuflik, Einat Minkov, Silvio Nocera, Itay Shoor, The potential of social media in delivering transport policy goals, Transport Policy, Volume 32, March 2014, Pages 115-123.
[47]  Didier van de Velde, Katrin Augustin, Workshop 4 Report: Governance, ownership and competition in deregulated public transport markets, Research in Transportation Economics, Volume 48, December 2014, Pages 237-244.
[48]  Thomas Hilde, Robert Paterson, Integrating ecosystem services analysis into scenario planning practice: Accounting for street tree benefits with i-Tree valuation in Central Texas, Journal of Environmental Management, Volume 146, 15 December 2014, Pages 524-534.
[49]  Carlos W. Pratt, Kenneth J. Gill, Nora M. Barrett and Melissa M. Roberts, 1 - The Experience of Mental Illness: An Introduction to Psychiatric Rehabilitation, In Psychiatric Rehabilitation (Third Edition), edited by Carlos W. Pratt, Kenneth J. Gill, Nora M. Barrett and Melissa M. Roberts, Academic Press, San Diego, 2014, Pages 3-31.
[50]  Lawrence J. Fennelly and Marianna A. Perry, Chapter 26 - Operational Issues, Specific Threats, and Solutions, In The Handbook for School Safety and Security, edited by Lawrence J. FennellyMarianna A. Perry, Butterworth- Heinemann, Boston, 2014, Pages 281-326.
[51]  S. Shahsavaripour, A Model to Evaluate the Capacity of Public Road Transportation System: A Centenary Review of Transport Planning and Focus on Implementation in Australia, Progress in Planning, International Journal of Scientific and Engineering Research, Volume 6, Issue 1, January 2015, Pages 1-6.
[52]  S. Shahsavaripour, Determining the Direction for Rapid Transportation by Maximum Cover Method: Case Study in Sydney, Australia, International Journal of Scientific and Engineering Research, Volume 6, Issue 1, January 2015, Pages 15-22.
[53]  S. K. Piaralal, S. R. Nair, N. Yahya, J. A. Karim, An Integrated Model of the Likelihood and Extent of Adoption of Green Practices in Small and Medium Sized Logistics Firms, American Journal of Economics, Volume 5, Issue 2, 2015, Pages 251-258.
[54]  M. N. Postorino, M. Versaci, A Fuzzy Approach to Reduce Delays at Signalized Road Intersections, International Journal of Traffic and Transportation Engineering, Volume 1, Issue 4, 2012, Pages 52-59.
[55]  A. Abdelfatah, A. Ramadan, G. Darwish, Utilizing Vissim to Evaluate Ramp Metering Performance, International Journal of Traffic and Transportation Engineering, Volume 1, Issue 1, 2012, Pages 1-6.
[56]  Sopingi, Soemarno, B. Yanuwiadi, A. Suman, The Implementation of Green Industry in Small Industries of Tiles and Brick in Nganjuk District, East Java, Indonesia, Resources and Environment, Volume 5, Issue 1, 2015, Pages 1-8.
[57]  A. A. M. Ahmed, J. B. Alam, Simulation of NOx Concentration of Dhaka City by Regional Air Model, American Journal of Environmental Engineering, Volume 2, Issue 2, 2012, Pages 39-44.