E. C. Merem 1, J. Wesley 1, E. Nwagboso 2, S. Fageir 1, S. Nichols 1, T. Thomas 1, P. Isokpehi 1, M. Crisler 1, C. Romorno 1
1Department of Urban and Regional Planning, Jackson State University, Jackson MS, USA
2Department of Political Science, Jackson State University, Jackson MS, USA
Correspondence to: E. C. Merem , Department of Urban and Regional Planning, Jackson State University, Jackson MS, USA.
| Email: |  |
Copyright © 2015 Scientific & Academic Publishing. All Rights Reserved.
Abstract
This research analyzes environmental change in the Lower Savannah watershed along the Georgia and South Carolina boundary based on mix scale method of descriptive statistics and GIS. Assessing the status of the Lower Savannah involved temporal spatial and environmental analysis, identification of the factors and restoration efforts. The results point to changes in the form of gains and declines in land use elements of farmland and others between 1992 through 2007. The GIS mapping shows a gradual dispersion of farm land and other elements coupled with a spreading of fertilizer use in the region. Accordingly, the study area experienced widespread pollution as shown with the vast presence of toxics in the watershed along with high pumpage of water and environmental declines triggered by many stressors including socio-economic elements. Notwithstanding ongoing initiatives among agencies to protect the watershed, the ability of GIS to track patterns of change in that setting reaffirmed its relevance as a decision support tool for managing stressed environments. To remedy the issues, the paper suggests the need for education and the design of a regional environmental information system.
Keywords:
Lower Savannah, GIS, Environmental change, Watershed, Region, Pollution, Georgia, South Carolina
Cite this paper: E. C. Merem , J. Wesley , E. Nwagboso , S. Fageir , S. Nichols , T. Thomas , P. Isokpehi , M. Crisler , C. Romorno , Analyzing Environmental Issues in the Lower Savannah Watershed, in Georgia and South Carolina, American Journal of Environmental Engineering, Vol. 5 No. 1, 2015, pp. 1-20. doi: 10.5923/j.ajee.20150501.01.
1. Introduction
Watersheds are nature’s boundaries made up of land areas that catch rain and drain into specific water bodies [1]. Over the years, state agencies have been adopting watershed approach to restore water quality and to comply with federal policies. The continuous analysis of watershed trends in that setting using geospatial technologies remains indispensable in the conservation of water bodies [2]. In the Georgia and South Carolina boundary line, the Lower Savannah river supports a variety of wildlife, biodiversity and agricultural activities [3]. Many stressors from land use in the area such as toxins, pollutants and drought continue to degrade the ecological integrity of the watershed. Notwithstanding these problems, very little has been done to analyse these trends. This has resulted in altered hydrology, the concentration of contaminants along surface water environments coupled with habitat disturbance. In light of these issues, there is an urgent need for a geo-spatial analysis of these trends.In the context of the study area, geo-information system can track competing land uses threatening watersheds [4]. Such a tool is indispensable in the design of frameworks suited for the efficient management of water resources in stressed environments [5]. While ecological restoration initiatives targeting water basins are abound in the literature [6], efforts in that direction in the Lower Savannah river basin has been reechoed in various studies [7, 8]. In the south east states of South Carolina and Georgia where agriculture and others rank as leading industries and major users of land and water, environmental stressors from these sectors continue to pose major problems [9]. As a result, the Lower Savannah watershed and other river systems in the states are threatened by various stressors [10]. Notwithstanding the threats of fertilizer runoffs as one of the leading causes of water quality decline [11], there is a large presence of cancer causing chemicals and toxic waste dumps sites in the watershed [12-14]. The growing presence of these stressors poses enormous danger to the local communities and the surrounding environment. With many studies highlighting river pollution threats in the region, chemical residues are not only found all through the Lower Savannah watershed, but they exceed the allowable levels under current water quality standards. In the area where agriculture stands as a key source of stream pollution through pesticide use, the constant discharge of nutrients into the basin constitutes a major hazard to the surrounding ecology. Other issues include the extensive usage of water, the loss and fragmentation of natural habitats, declining agricultural land base and changes in other factors [15]. Consequently, the Lower Savannah watershed as a sub-basin continues to experience degradation prompted by human activities. While others have analysed these environmental issues including pollution and the elements fuelling change in the larger basin on the Georgia side in the past. Environmental and zoning law perceptive was used to illustrate the impacts of coastal resource use in Georgia including the study area in a related study. To deal with these problems in the sub basin of Lower Savannah river watershed, the US Natural Resource Conservation Services (NRCS) [15] and the South Carolina Department of Health and Environmental Control [16] carried out separate assessments aimed at tracking impairment predictors and ecological declines with mitigation strategies. Considering the essence of such efforts in the assessment of watershed issues, agencies are resorting to Geographic Information Systems (GIS) to manage various land uses in a watershed.In realizing these benefits, numerous scholars have been directing their GIS expertise towards the design of watershed and water quality models for the past several years. Accordingly, many studies exist in the literature with focus on watershed protection using GIS. Notwithstanding the gravity of the issue, very little has been done to track the problems using GIS in the lower Savannah region. Having said that, GIS has found widespread appeal in other studies on watershed degradation and landscape change based on the works of Merem and Twumasi [17-21]. Similar studies along those lines by Bisaws [22], Prakash [23]; Usery [24]; Khawlie [25] and Lovejoy [26] reinforced the essence of these themes.The problems are further compounded by the role of several socio-economic factors in prompting change and the lack of access to spatially referenced information showing the mounting threats to stressed environments such as the Lower Savanah basin. This can be evidenced by looking at the way different variables such as the prevailing land use types and other elements largely associated with the problem in various locations are rarely captured spatially. Notwithstanding efforts in dealing with the issues, knowledge of the dangers posed by environmental declines demands an assessment of current practices within the Lower Savannah basin. For sustainable use of the resources an environmental assessment of the lower Savannah region of South Carolina and Georgia, using GIS is necessary. Such a system has the potential to provide managers spatially referenced data with opportunities to track stressors and the changes threatening the Lower Savannah basin. When used suitably, GIS has the capability as a decision support tool to incorporate and assess spatial data so as to generate efficient pathways for improving policy making. This paper uses a mix scale approach of GIS and descriptive statistics to assess the ecological status of lower Savannah watershed. This paper contains five sections. Section 1 offers a description of the introduction with the issues and a review of the literature, while Section 2 presents the methods and materials and the delineation of the study area. Section 3 outlines the results based on the temporal-spatial, environmental data analysis, an outline of the factors fuelling the problems and the efforts. The fourth section consists of a discussion of the findings. The fifth section highlights the recommendations with future lines of action and the conclusions of the research. The paper has five objectives. The first aim is to contribute to the literature, while the second objective is to device a support tool for decision makers. The third one focuses on the development of novel method for identifying environmental stressors. The fourth objective is to provide a framework for environmental management. The fifth objective is to analyse environmental trends in the study area.
2. Methods and Materials
2.1. The Study Area
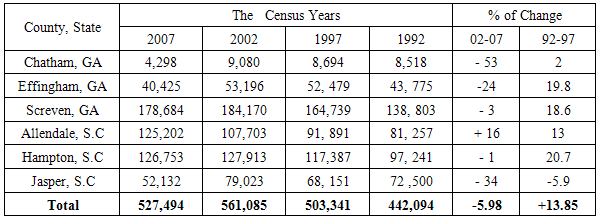
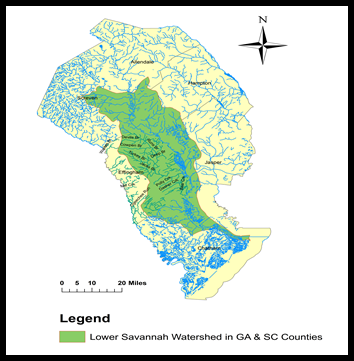
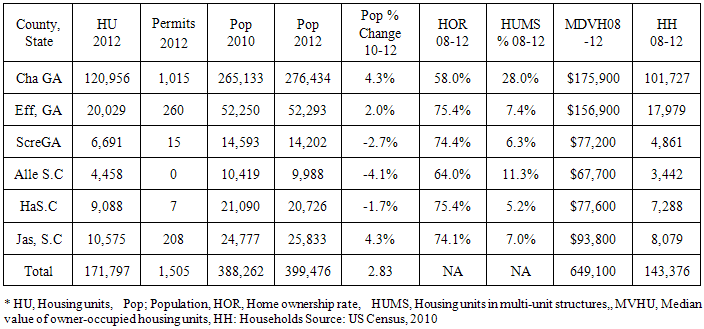
The study area (Figure 1) measuring 3,172 Km2 miles consists of 6 counties in the Lower Savanah region of Georgia and South Carolina in the south east region of the US. It contained a sizable population of 388,262 to 399,262 from 2010 to 2012 at a growth rate of 2.83% [27]. The area is endowed with rich environmental features including wildlife, forested areas, agricultural lands, cropland, adjacent streams and watersheds. 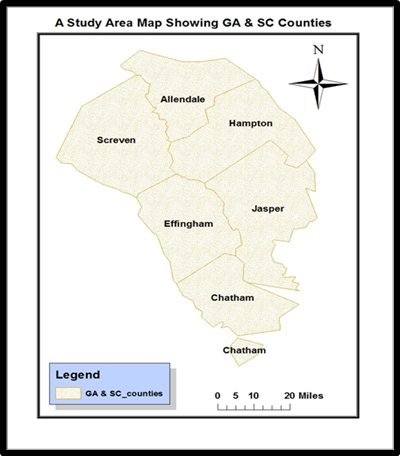 | Figure 1. The Study Area Counties |
The Lower Savanah basin in Figure 1.2 furnishes water for vast urban areas in Georgia and three other fast growing coastal counties in South Carolina most notably Jasper, Hampton, and Beaufort counties [28]. Being fully enriched with biodiversity, the lower Savannah River basin also provides habitat for at least 9 threatened and endangered species. Similarly significant, the area has 10 candidate species presently being reviewed for probable inclusion to the endangered species list in line with the Endangered Species Act of 1973. An assessment of the basin carried out by the national resources conservation service puts the number of species listed on a potential endangered inventory at 38 plants and 36 animals. Additionally, during the 2007 period, the study area contained 527,494 acres of farm land along with 1244 farms. With an abundance of freshwater habitats of lakes and intense farming, industrial activities and the proliferation of human settlements, the region continues to experience ecological degradations attributed to human activities. Some of the common threats include the presence of leaky and obsolete septic tanks in the area. Considering the influence of agriculture in the Lower Savannah basin, chemical run offs from large acreages of farm operations in the region empty into adjoining estuaries with threats to biodiversity. This is compounded by urbanization and farming practices and other activities impeding natural habitats, the environment and water quality. With the vulnerability of biodiversity in the region, habitat loss and fragmentation has emerged as major threats to many of the species listed as threatened and endangered in South Carolina. In the process, coastal resources are under a growing threat from unprecedented urban and rural development across the vast watersheds of coastal rivers, which carry associated pollution hundreds of miles downstream to Georgia’s estuaries. In addition, groundwater quality is also being threatened by saltwater intrusion due to heavy water usage in the coastal counties of the state such as the Lower Savanah. 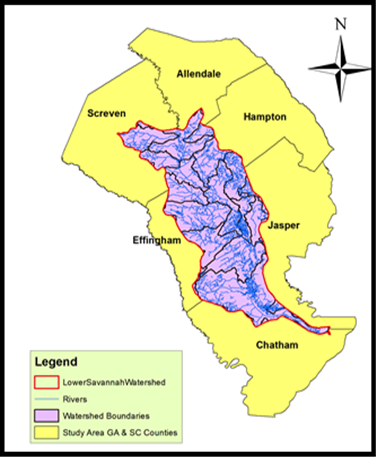 | Figure 1.2. The Lower Savannah Watershed |
Apart from widespread overuse, the pollution of current water supplies constitutes a growing risk to public health, communities, wildlife, and nature based business. Given the array of ecological disturbances in the area, it has been estimated that 60% of Georgia’s waterways are so highly contaminated that they do not meet the prescribed federal criteria for fishing or swimming. In fact, 3 rivers on coastal Georgia, comprising Savannah River, are ranked among the nation’s most polluted when it comes to the concentration of carcinogenic chemicals. Considering the more than 80% increase in permitted release of toxins into Georgia’s waterways from 1989 through 1998. It comes as no surprise that 50% of Georgia’s fish consumption advisories occur in coastal areas, even though the coast covers just 1/5 of the state. With very little understanding of the gravity of accrued impacts and the handful of issues in the study area herein presented, GIS analysis offers opportunity for a deeper understanding of the spatial patterns of change and the emerging environmental issues in the Lower Savannah region.
2.2. Methods Used
The paper uses temporal-spatial data, agricultural census information and related data based on descriptive statistics and Geographic Information Systems (GIS) to display the trends spatially. This was made possible by the retrieval of spatial data sets of shape and grid files from the Georgia Statistics’ Natural Resource and Agricultural Information Systems (GSNRAIS) in digital form using ARCVIEW GIS. The statistical output of the variables from the spatial units were mapped and compared across time (1992 to 2007) in ARCVIEW GIS. Other sources include the US Geological Survey, The South Carolina Bureau of Water, The Natural Resources Conservation Services (NRCS), The South Carolina Department of Health and Environmental Control, and the US Environmental Protection Agency (EPA). While the United States Department of Agriculture (USDA) provided farm data for the periods of 1992-2010. Federal geographic identifier codes for the counties were used to geo-code the information contained in the data sets. With this information analysed with basic descriptive statistics, and GIS, particular attention was paid to the temporal-spatial trends at the county and watershed level. The relevant procedures consist of two stages.
2.3. Stage 1: Identification of Variables, Data Gathering and Study Design
The first step involves the identification of variables needed to assess change and degradation in the study area. The variables consist of number of farms, size of farm land, impaired water bodies, categories of pollutants, and percentages of change. Others are harvested and irrigated cropland, land treated with fertilizer, population, housing elements, market value of building, and goods sold, water use, toxic sites’ releases, water withdrawals and government transfer payments. Additionally, access to databases that are available within the Federal and state archives in Georgia and South Carolina quickened the search process (See Tables 1-4). The process continued with the design of data matrices for socio-economic and land use (environmental) variables covering the periods from 1992, 1997, 2002, 2005, 2007, 2009 to 2012. The design of spatial data for the GIS analysis also required the delineation of county boundary lines. With boundary lines unchanged, a common geographic identifier code was assigned to each of the units to ensure analytical coherency.Table 1. The Land in Farms
 |
| |
|
Table 2. The Number of Farms
 |
| |
|
Table 3. Harvested Cropland
 |
| |
|
Table 4. Irrigated Cropland
 |
| |
|
2.4. Stage 2: Step 2: Data Analysis and GIS Mapping
In the second stage, descriptive statistics and spatial analysis were employed to transform the original socio-economic and land-use data into relative measures (percentages/ratios). This process generated the parameters for establishing degradation and change on the areas experiencing change. This was facilitated by measurements and comparisons of the trends over time. While this approach allows for change detection, the tables highlight stressors, indicators of degradation, land use patterns and extensive use of resources. The remaining steps involve spatial analysis and output (maps-tables-text) covering the study period, using ARCVIEW 9. The spatial units of analysis consist of the six counties of the two states. The geographic data for the study area which covered its watersheds and counties also includes pollution and ecological data of land cover files of wetlands, watersheds, paper and digital maps from 1992-2004.
3. Results
This section covers the results of the descriptive statistics on temporal trends and spatial analysis of environmental change with GIS. There is an opening focus on the analysis of environmental variables of land use, the percentage of change and the spatial analysis. This is followed by a synopsis of the environmental impact analysis and the socio-economic factors influencing change and the current efforts by institutions to mitigate degradation in the study area.
3.1. Environmental and Temporal Analysis
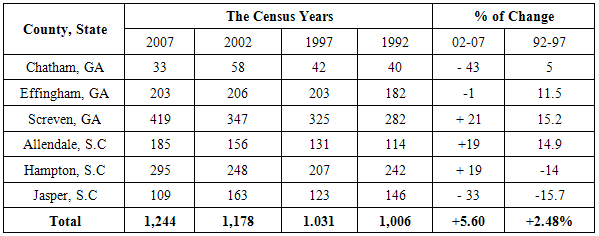
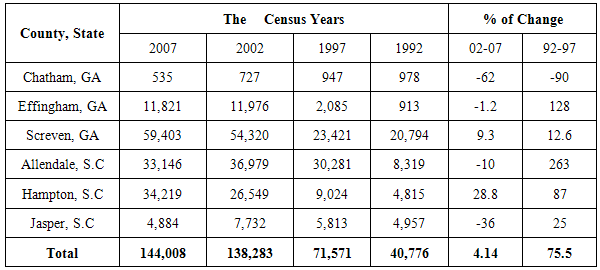
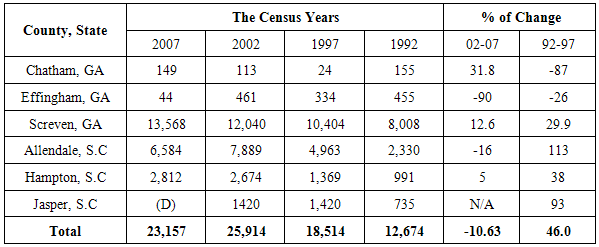
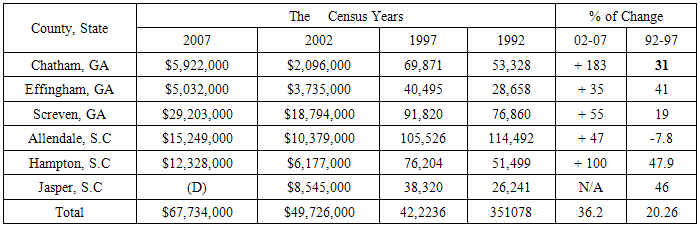
Turning to land in farms, the Lower savannah watershed opened with a drop in farm land area estimated at 442,094 to 503,341 acres in 1992 through 1992 only to rebound by 561,085 to 527,494 in the census periods of 2002-2007. Among the counties, the largest acreages of agricultural land were concentrated in three places (Screven, Allendale, and Hampton). These places ranked higher in land areas in each of the census periods. As the most heavily farmed areas, the acreages for Screven rose from 138,803 to 164,739 in 1992-1997 until a skid of 184,170 to 178,684 acres in the ensuing five years of 2002-2007. For Allendale and Hampton counties, the acreages of farm land in the respective areas were in the order of 81,257, 91,891 and 97,241 to 117,387 in 1992-1997. Just as Allendale’s farmland size soared from 107,703-125,202 acres by the next five years, Hampton County experienced a slight decline estimated at 127,913 to 126,753 acres. In the same periods of 1992 to 2007, the downward slide continued at Jasper where the land acreage showed further drops of 72,500-68, 68,151 and 79,023 to 52,132 acres respectively (Table 1). With a total of 1,006 and 1,031 farms in the study area during 1992, three individual counties Screven, Hampton and Effingham each contained more farms at levels that surpassed the others. The breakdown of the data shows the number of farms at 282 to 325 for Screven, 242 and 207 for Hampton while Effingham followed up with 182 to 203. In the other counties, the available number of farms was in the order of 114-131 for Allendale and 146 to 123 in Jasper. During this period, Chatham had only 40 to 42 farms. In the ensuing census years of 2002-2007, the counties of Screven, Hampton and Effingham maintained sizable number of farms estimated at 347 to 419, 248-295, and 206 to 203 respectively. Note also that just as Allendale farm numbers jumped from 156 to 185, Jasper and Chatham saw their farms drop (from 163 to 109 and 58 -33) in the 2002 to 2007 period (Table 2). At the same time, harvested cropland total of the region grew much of the time with 40,776 to 71,571 acreages between 1992 and 1997. In the 2002 to 2007 period, the number jumped from 138,283 to 144,008 acres. As usual the acreages for Screven, Allendale and Hampton surpassed those of Japer, Effingham and Chatham between 1992 through 2007. In these counties, harvested cropland at Screven rose (by 20,794 to 23,421 acres) in 1992 to 1997 and continued at 54,320 and 59,403 in the ensuing periods of 2002-2007 (Table 3). At the Allendale area, cropland areas showed the upward surge (8,319 to 30,281) until a sudden change in acreages of 36,979 to 33,146 emerged in 2002 through 2007. Elsewhere in Hampton County, cropland acreage stood firm over the years with solid numbers of 4,815 to 9,024 and 26,549 to 34,219 acres compared to other counties. Just as Chatham emerged as the county with the lowest cropland area, the acreages for Jasper and Effingham stood below those of the leading counties herein mentioned (Table 3). On the size of land devoted to irrigation for the region, the numbers ranged from 12,674 to 18,514 and continued in the period of 2002 and 2007 at 25,914 to 23,157. With 8,008-10,404 acres and additional 12,040 to 13,568 in irrigated cropland, the county of Screven outpaced all areas during the periods in question. In a similar fashion, Allendale County, Hampton and Jasper irrigated more cropland during the period in question. The temporal distribution consists of somewhat sizable acreages (estimated at 2,330 to 4,963, 7,889-6,584 and 991-1369, and 2,674 to 2,812) between 1992 through 2007. Aside from the inactivity of the last census period, Jasper county had more irrigated areas (735, 1420, 1420 acres) at levels much different from Chatham and Effingham (Table 4).
3.2. The Percentages of Change
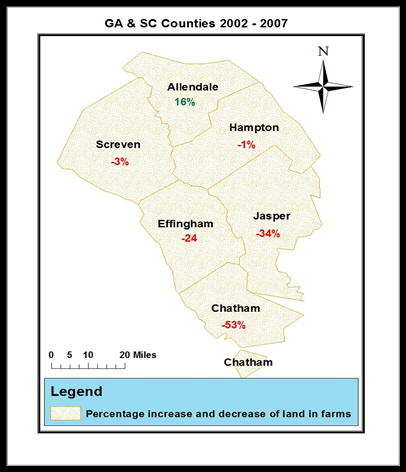
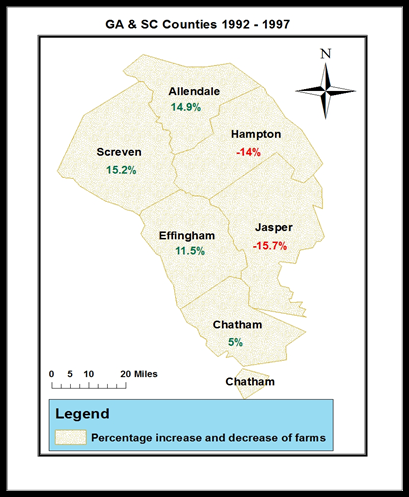
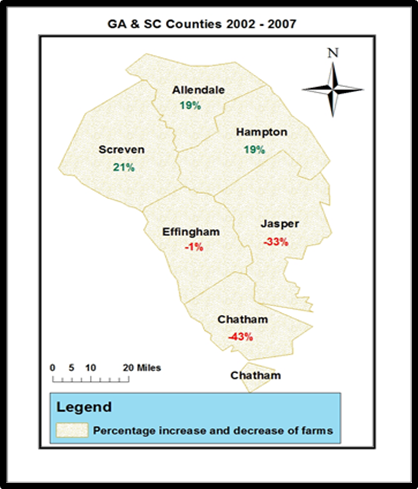
The percentage of change for farmland points to a mix of gains and declines in the periods of 1992-1997 and 2002 to 2007 for the entire study area and the individual counties. Comparing both units, one notices that all counties experienced mostly double digit gains in land acreages in 1992-1997 with the exception of the 2% increase in Chatham coupled with the -5.9% declines in Jasper. Regarding across the board declines in 2002 to 2007, Chatham, Effingham and Jasper county outpaced the other areas by -53%, -24% and -34% in a way similar to the study area while Allendale accounted for the only gain of +16%. Interestingly, the level of gains for farms were slightly more in 1992-1997 when only 4 counties experienced gains compared to 3 in 2002-2007. During that period, gains were evident in Chatham, Effingham, Screven, and Allendale at a rate of 5%, 11.5%, 15.2% and 14.9% while Jasper and Hampton posted identical level of declines of -15.7 to -14 percentage points. Further along the years, the percentage of change between 2002 through 2007 points to a split in gains and declines in three counties. Of those areas, Screven, Allendale and Hampton posted major gains of 19% to 20% respectively. From the data, Chatham and Jasper on the one hand both accounted for the highest increases of 43 and 33%, Effingham on the other experienced a 1% decline. Overall, it is worth mentioning that the gains or rates of change (5.60-2.48%) of the study area in both periods of 2002-2007 and 1992-1997 were below the level of gains experienced in the counties. For harvested cropland, the 1992-1997 rates of change were consistent with gains in the study area and most counties, but in 2002-2007, a different scenario emerges with declines in 4 of the counties. The percentage of change in land devoted to irrigation indicates a gain of 46 percentage points in 1992-1997 and -10.63% rate of decline for the study area. In the counties, the rates of change seemed slightly identical (Tables 1-4).
3.3. Environmental Impact Analysis
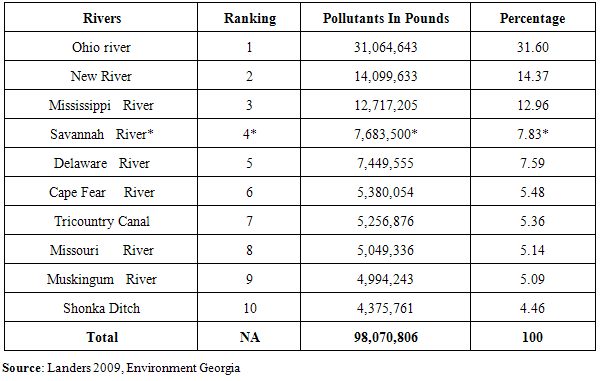
The environmental impact analysis centers on the extent to which toxic releases oozed into water ways, watershed pollution, fertilizer use impacts, and water use in the region. From the information on the table, of the total of 98,070,806 pounds of toxics discharged into major rivers across the country, more than 7.6 million of those toxic chemicals found their way into the waters of the Savannah basin in 2007. With 7.83% of the overall toxic releases, such concentration of pollutants in the Savannah River outpaced those in the other 6 major waterways in the country that experienced degradation. From the table, note also that the Savannah River watershed has the fourth highest toxic discharge level in the country in terms of ranking. Further look on the table shows elevated levels of toxic chemicals only in the Ohio, New and Mississippi rivers when compared to the others (Table 5). Just as low oxygen is a problem, the largest toxic releases were nitrate compounds responsible for oxygen depleted dead zones in the waterways. The trend is further compounded by the 30,000 pounds of cancer causing chemicals discharged into the Savannah River by international papers during the 2007 period. The severity of deteriorations faced by the watershed resulted in a reclassification of the status and quality of the river from most threatened in 1992 to the most endangered in 2007 by the American Rivers Association. Table 5. Top 10 US Water Ways Threatened By Toxic Discharges
 |
| |
|
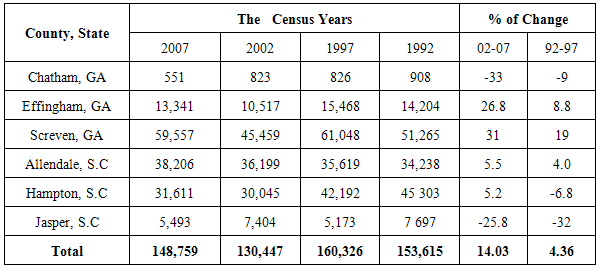
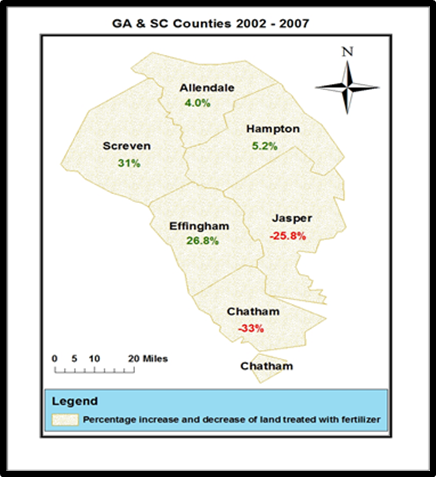
Considering the known impacts of chemical run offs on the surrounding environment, the frequency of land treatment with fertilizer soared from 153,615 to160,326 and 130,447 to 148,759 acres in the entire Savannah River watershed among the counties during the four censuses. Consider the trends among the three most heavily farmed counties (Screven, Allendale and Hampton). The breakdown points to extensive treatment of land with fertilizer in Screven at a level that surpassed the others. Just as the acreages under treatment rose (from 51,265 to 61,048 and 45,459 to 59,557 acres) in Screven county, fertilizer applications grew further (34,238, 35,619, 36,199, 38,206) during 1992, 1997, 2002 to 2007 period in the Allendale area. The vast use of fertilizer continued at Hampton with 45,303 to 42,192 acres under treatment coupled with additional acreages estimated at 30,045 to 31,611 between 1992 through 2007. The other group of counties; Effingham and Jasper devoted thousands of acreages to fertilizer applications until a sudden drop in the Chatham area during the same periods. With increased rates of application (4.36 to 14.03%) in the study area during the 1992-1997 and 2002 -2007 period, the use of fertilizer stayed on the rise much of the time with the exception of back to back declines in Chatham and Jasper counties (Table 6). The continual use of fertilizer in counties situated along a fragile coastal environment poses enormous threat to the surrounding ecology, hence the vulnerability of the coastal areas.Table 6. Land Treated With Fertilizer
 |
| |
|
 | Figure 1.3. The Lower Savannah Watershed |
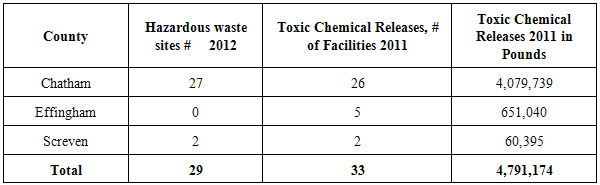
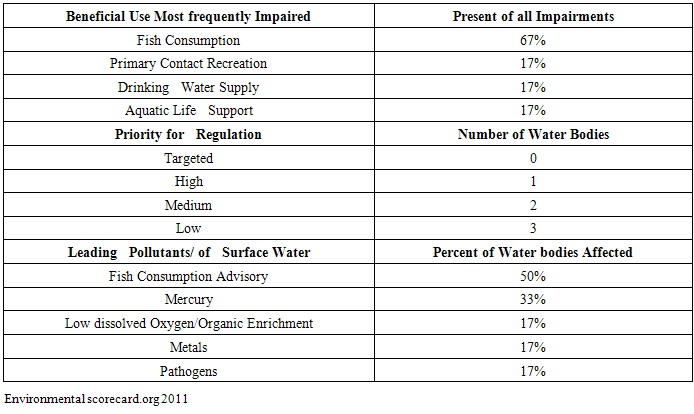
The other aspects of the problem pertaining to the vulnerability of fragile coastal ecosystem stems from the large concentration of 29 hazardous waste sites in 2012 with much of that in Chatham county. The same can be said of the number of toxic release facilities and the toxic compounds discharged in the 2011 period. Chatham county not only had 26 of the 33 sites known for toxic releases, but it accounted for 4,079,739 pounds of 4,791,174 (85.15%) of toxics discharged into the environment during that period. Effingham and Screven on other hand followed with 651,040 to 60,395 pounds as well (Table 7). Considering the intense level of pollution in the watershed, several beneficial uses from fishing, recreation and drinking have been frequently impaired in recent years. Of these uses, areas devoted to fishing including fishing grounds and habitats estimated at 67% emerged as the mostly severely degraded when compared to 17% of the impairment to drinking water sources, recreation and habitats for marine life. With these levels of pollution resulting in fish consumption advisory in 50% of the water bodies, the presence of mercury, metals, pathogens and organic enrichment remains a threat in the water bodies (Table 8). Another twist to the problems is that human activity has diminished the size of the watershed with growing threats to the species therein. To that effect, all through the Savannah River there is a recurrent unease about leaky septic tanks and faulty drain fields. Septic systems, particularly, outdated types that have been in use for several decades and those under completely deteriorating condition can impede the quality of groundwater and surface water sources. Given the stresses of growth and development, green spaces including forested land areas and riparian zones in cities are being diminished and destroyed. These habitats provide essential life support necessary for the preservation of fresh air, water resources and liveable community. Table 7. Toxic Sites and Releases Among Selected Counties In 2011-2012
 |
| |
|
Table 8. Summary of Water Impairments In The Basin In 2011
 |
| |
|
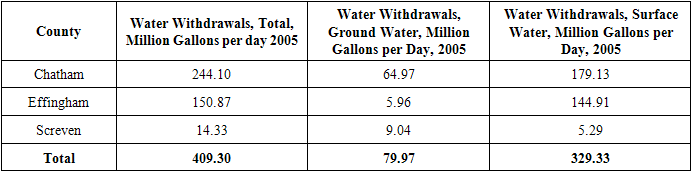
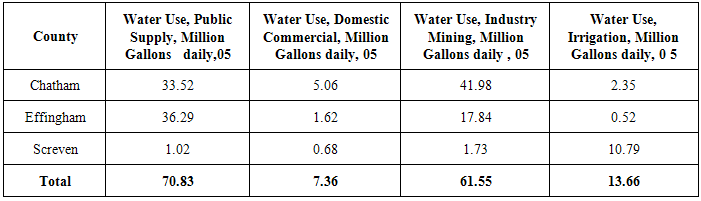
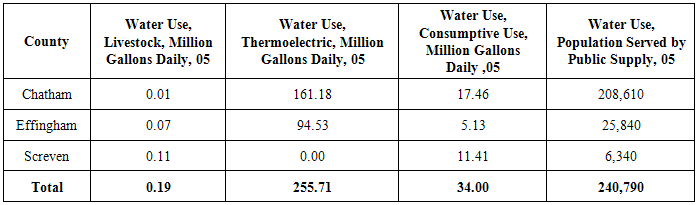
Aside from the threats of degradation ravaging the area, extensive withdrawal and use of water is quite rampant and a common problem. In the 2005 period, the total daily withdrawal in million gallons per day (MGD) stood at 409.30 while ground and surface water pumpage reached 79.97 to 329.33 mgd (Table 9). Here again, Chatham pumped more water than three other counties (Table 9). Of the categories of water use in the Georgia side of the watershed, comprising of 70.83-7.63, and 65.55-13.66 mgd, note that the public water supply system, domestic and commercial, industry and mining and irrigation were quite active (Table 10.1). With a meagre use by the livestock sector, the thermo electric sector with a total of 255.71 mgd stood out as the largest user of water considering the large population being served (Table 10.2). Elsewhere, the intense level of pumpage in south eastern Georgia triggered fluctuations to the water depletion level of the major aquifer. Such intense pumpage has pushed the Floridian aquifer to lower levels that allowed salt water intrusion into freshwater sources in the Savannah area. Under those circumstances, the pressure and the risks associated with intense pumpage comes as no surprise knowing that coastal Georgia obtains much of its water, such as drinking water from the Floridian aquifer. The effect of this intrusion is substantial and prevalent. Considering this trend, water over use and rate of use are still significant enough to impede the ecosystem through subsidence and salt water intrusion. Other evidence of water use comes from the Georgia side of the Lower Savannah watershed where 28 ground water permits were obtained for farming purposes at a pumpage level of 14,390 gallons for each minute. This was followed by additional 15 surface water permits distributed across the area for water extraction at a rate of 12,325 gallons per minute. All in all, the issuance of agricultural ground water and surface water permits in the lower savannah allowed for total freshwater extractions estimated at 26,715 gallons at every minute in the area [29]. Table 9. Distribution of Water Withdrawals Among Counties In 2005
 |
| |
|
Table 10.1. Water Use By Category
 |
| |
|
Table 10.2. Water use By Category
 |
| |
|
3.4. Spatial Analysis
This section describes the spatial dimensions of change amongst the various variables from land use to economic elements in the study area between 1992 through 2007. The extensive use of farm land in the region resulted in a gradual spread of land use elements in terms of gains and declines in the counties under analysis. This is evident from the geographic distribution of the trends based on the GIS mappings. Accordingly the information on the maps point to a continual dispersion of gains and declines in land use elements across space. During the census periods, farmland land distribution showed substantial gains in the initial periods of 1992 to 1997 census in all counties with the exception of the declines in the Jasper area. In the ensuing period of 2002 through 2007 when most counties showed signs of drastic declines, the Allendale area in the upper north of the study area stood firm as the only county with gains (Figure 2.0-2.1). With the emerging presence of farm declines along the north west counties of Hampton and Jasper in the 1992-1997 coupled with notable gains in the other areas, then came an even split among northern and southern counties classified as either increasing or decreasing in the 2002 -2007 period (Figure 3.0-3.1).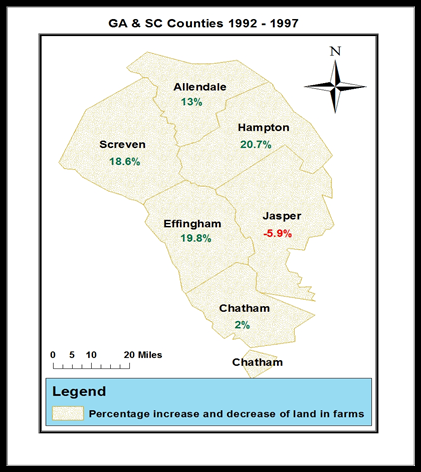 | Figure 2. Percentage change in farmland 1992-1997 |
 | Figure 2.1. Percentage of change in farmland 2002-2007 |
 | Figure 3. Percentage change in farms 1992-1997 |
 | Figure 3.1. Percentage change in farms 2002-2007 |
While land sprayed with fertilizer showed notable declines in the lower or south east edge of the study area at Jasper and Chatham, much of the growing treatment of land with fertilizers held steady in the north east and the north west of the region between 1992-1997 and 2002 through 2007 (Figure 4.0-4.1). In the 1992 and 1997 period, the use of irrigation showed more prominence in space in the study area with more activities in the northeast and northwest, but it faded gradually as one moves towards the south west counties of Effingham and Chatham. Additionally a slightly different type of spatial patterns emerged in 2002 through 2007 with Allendale County loosing irrigated land percentage points while Chatham rebounded with gains in the 2002 to 2007 periods (5.0-5.1). The same can be said of harvested cropland in 1992-1997 which maintained a robust presence in space in 1992 -1997 except in Chatham where it declined. In the ensuing periods of 2002 through 2007, counties that experienced decreases appeared more in the south east corner of the watershed while increased use of harvested cropland seemed more evident in the north east (Figure 6.0-6.1).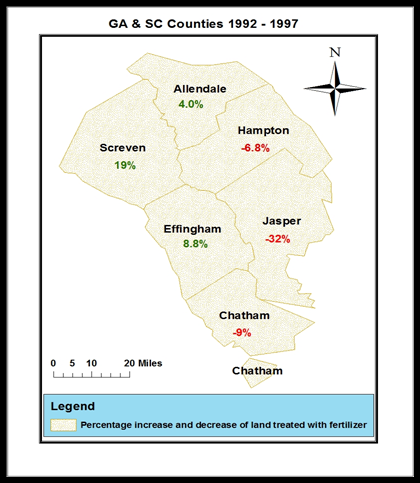 | Figure 4. Percentage change in fertilized land 1992-1997 |
 | Figure 4.1. Percentage change in fertilized land 2002-2007 |
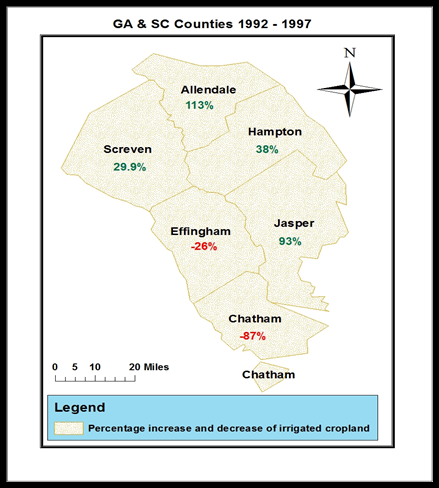 | Figure 5. Percentage change in Irrigated land 1992-1997 |
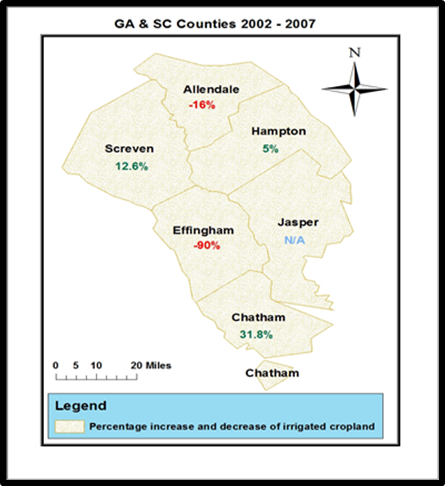 | Figure 5.1. Percentage change in Irrigated land 2002-2007 |
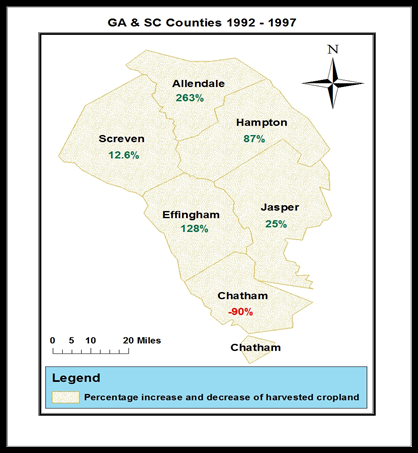 | Figure 6. Percentage change in harvested land 1992-1997 |
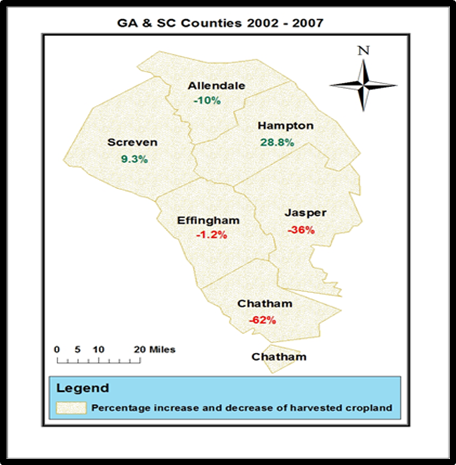 | Figure 6.1. Percentage change in harvested land 2002-2007 |
The economic elements of market value of goods sold and the value of land buildings based on the map rose much of time with notable presence and increased sales across space between 1992 to 1997 and 2002 through 2007. In other words, the spatial patterns held steady much of the time compared to the other variables herein analyzed (Figure 7.0-Figure 8.1). On government transfer payments, one notices notable declines in space along the north east and northwest portions of the region in the areas of Screven, Allendale, Hampton, and Jasper in the 1992-1997 censuses. During the next periods of 2002-2007, decreases in transfer payments faded drastically with solid gains across the counties with the exception of Jasper which showed signs of declines just as in the previous census (Figure 9.0-9.1). 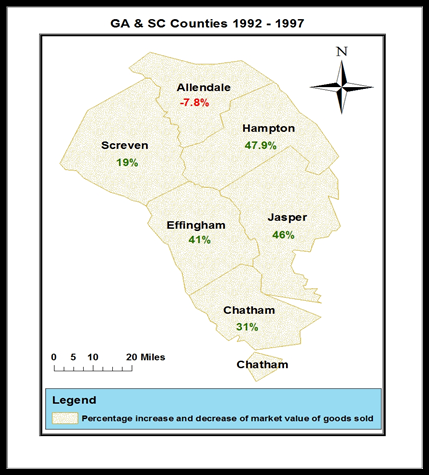 | Figure 7. Percentage change in Goods sold 1992-1997 |
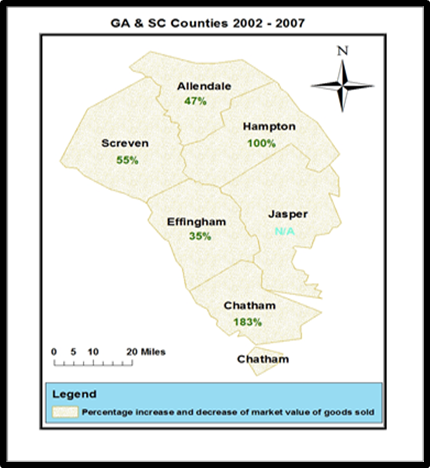 | Figure 7.1. Percentage change in Goods sold 2002-2007 |
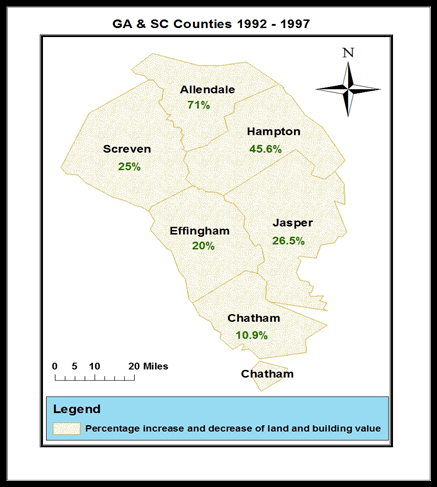 | Figure 8. Percentage change in value of buildings 1992-1997 |
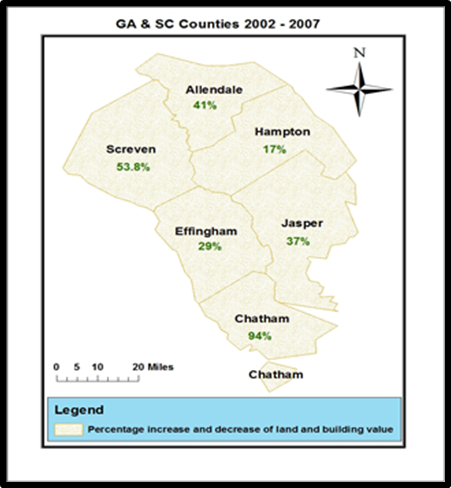 | Figure 8.1. Percentage change in value of buildings 2002-2007 |
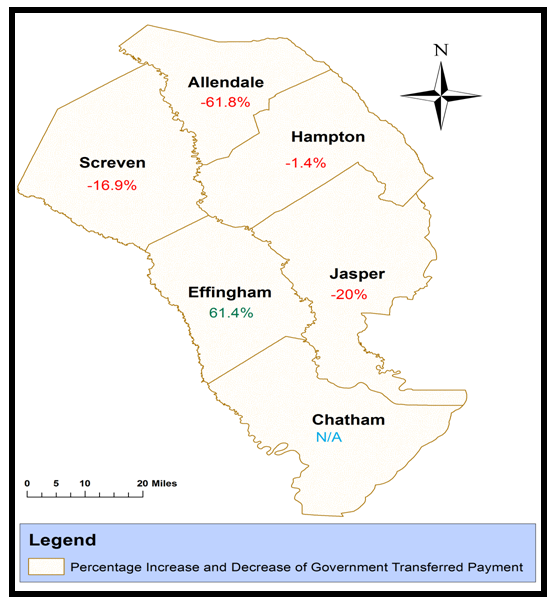 | Figure 9. Percentage change in Transfer payment 1992-1997 |
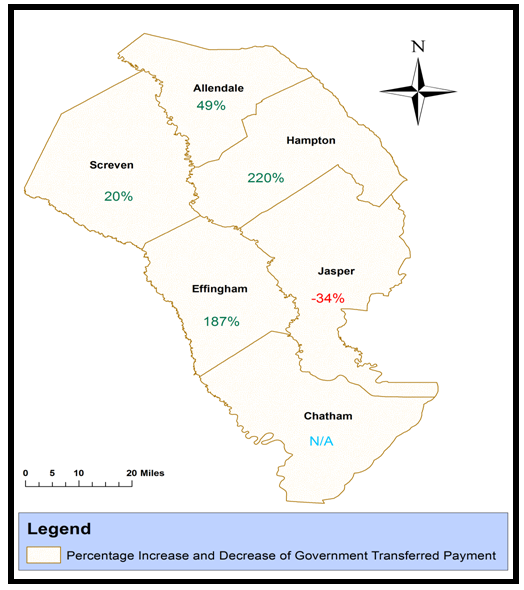 | Figure 9.1. Percentage change in Transfer payment 2002-2007 |
3.5. Factors of Change and Efforts
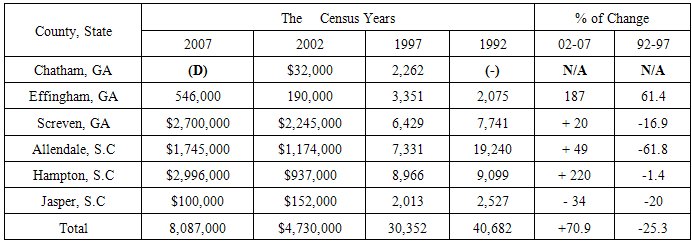
In terms of factors responsible for change, it is evident that they do not operate in a vacuum. They are linked to several socio-economic elements including government transfer payments, the market value of goods sold and the market value of building and housing variables and the unsustainable use of resources. While the transfer of government payments was quite pronounced over the years with more of that evident in the 2002-2007 periods than the 1992-1997 censuses. The entire region received 40,682-30,352 in 1992-1997 and 2002 through 2007 the amount grew further from $4,730,000 to 8,087,000. With more payments to the three major farm counties during the first two censuses, Screven got $7,741 to $6,429 and in 2002 to 2007, the amount jumped from $2,245,000 to $2,700,000. Notwithstanding the $19,240 and $7,331 in government spending for Allendale in 1992 and 1997 census, by the next periods, transfer payments exceeded the million dollar mark with $1,174,000 and $1,745,000. In Hampton, after a soft start in government support ($9,099-$8,966), the numbers rose significantly from $937,000 to $2,996,000) (Table 11). The point worth noting is that such government subsidies in the heavily farmed areas exceeded the numbers in the rest of the counties during the censuses of 1992, 1997, 2002, and 2007. Considering the sizable declines evident in transfer payments, between 1992-1997 government assistance not only rebounded, but it grew geometrically by 2002 through 2007. The same can also be said of market value of land and buildings and market value of goods which grew much of the time with robust numbers (Table 12-13).Table 11. Government Transfer Payment average per farm
 |
| |
|
Table 12. Market Value of Land and Buildings $ average per farm
 |
| |
|
Table 13. Market Value of Goods Sold average per farm $
 |
| |
|
The abundant infusion of government funds and the stimulus injected into the agricultural economy of the counties along the watershed has a tendency to enhance productivity and investments likely to drive up the use of agrochemicals. The request for more services and infrastructure in these settings were at levels capable of impeding the carrying capacity of the surrounding environment of the basin. The significance of changes in these economic indicators is that their continual fluctuations do impact the rent that accrues land resources in the study area. With the inherent volatility of market forces and government policies in the process, farm operations with bigger economic values are likely to be drawn into large scale production with intense use of fertilizers to boost yield at the expense of the watershed ecology. Considering that economy of scale favors the activities of bigger farms, smaller farm operations unable to thrive under the volatility of the market place ended up selling their land to speculators. This resulted in the conversion of available farm land to competing land uses at the expense of the environment. The role of housing variables can be seen with the vast number of housing units which totaled 171,977 along with permits. This comes with the notable rise in home ownership rate and housing units and other elements. Added to that is the total of 1,505 building permits issued in the area with much of that in Chatham, Effingham and Jasper. All these are sizable and overly challenging to the attainment of a sustainable watershed environment. The same can also be said of the pressure mounted by population growth numbers and the overall totals. Being coastal counties in an important watershed, local planning authorities are often pressed to provide infrastructure for the population at large. In that setting, the authorities may have been forced into allocating more permits for new settlements which in turn resulted in more conversion of arable land for the design of housing units. The other attraction likely to influence change stems from the average price of homes which toped hundreds of thousands in Chatham and Effingham and in the high nineties in Jasper (Table 14). Given the pressures often mounted from human activities in built environments including growth in home ownership rates, number of households and what transpired in the study area during the years in question, it is evident that the proliferation of housing indicators partly influenced environmental change in the study area. Table 14. Housing Variables and Factors
 |
| |
|
In addition to domestic consumption, industrial and agricultural usage of water remains solidly high in the Georgia side known for water metering system to gauge usage among farmers. Being a place where farmers are allowed to pump as much water as they can without any know policy repercussion. There are no motivations for the farm sector to be more efficient. More so, current infatuation with golf has led to numerous golf courses and country clubs, most of which are well trimmed with glittery green lawns where regular watering remains indispensable. Additionally, power generation has been cited as the single chief water consumer in the state at levels, even bigger than agriculture and industry. There are also concerns about the pace at which 10 to 50% of water in municipal and industrial systems is being wasted due to defective machines and unsustainable uses such as irrigation. While in metro Atlanta, per capita water pumpage stands at 158 gallons a day, shockingly, somewhere else in the state, water demand has risen in the coast than the densely populated Atlanta metro. This may be attributed to the vast presence of pulp and paper mills and big water dependent industries in coastal Georgia that averages a stunning 623 gallons of water per capita on a daily basis. Having said all these, one need not overlook also the impacts of the 4 year drought in dipping water to critical levels and the fact that citizens of Georgia consume more water at 10% per capita than the US average. Regarding ongoing efforts to stem the tide of degradation and change, measures are being taken by several agencies in Georgia and South Carolina along with federal entities to address the insidious dimensions of environmental declines in the Lower Savannah. The measures include numerous initiatives ranging from congressional oversight towards restoration, the development of simplified guides for watershed planning, cooperative and joint management of the basin and multi-stakeholder panel and participation. For more on these efforts, see Appendix A.
4. Discussion
Going by the discussions, the study area is endowed with an abundance of freshwater habitats of lakes and intense farming, industrial activities coupled with the proliferation of human settlements. Over the years, the region has faced ecological threats often manifested by widespread degradations attributed to human activities and environmental pollution. Given the influence of agriculture in the Lower Savannah basin, farming operations therein remain quite active in the six coastal counties along with chemical run offs into the adjoining estuaries. This is compounded by urbanization and other activities that are impeding natural habitats, the environment and water quality of the region. Mix scale analysis of the issues showed changes in the form of gains and declines in the agricultural land areas of the Lower Savanah region between 1992 through 2007. Accordingly, the Lower Savannah watershed experienced a drop in farm land area estimated at 442,094 to 503,341 acres in 1992 through 1992 only to rebound by 561,085 to 527,494 in the census periods of 2002-2007. At the county level, three places most notably (Screven, Allendale, and Hampton contained notable acreages of agricultural land. The temporal analysis also indicated changes in other land use elements from irrigated land, cropland and others. Environmental impact analysis points to the use of agrichemicals and the risks of chemical run offs from large acreages of farm operations in the region into adjoining estuaries with threats to biodiversity. Note also the presence of toxic chemicals in the waters of the Savannah basin in 2007. Of the total of 98,070,806 pounds of toxics discharged into main rivers nationwide, about 7.6 million of those toxic chemicals (7.83% of the overall) found their way into the waters of the Savannah basin in 2007. This represents 7.83% of the overall toxic release which exceeds the loads of pollutants in the rest of the other 6 major waterways in the country experiencing water degradation in the past years. Notwithstanding the presence of mostly nitrates and carcinogenic elements in the basin, widespread pumpage of water at levels higher than the national average has become a common problem. During the 2005 period, the total daily withdrawal in million gallons per day ended in the public water supply, domestic and commercial, industry and mining and irrigation systems. Aside from hazardous waste sites, chemical release facilities and a total of 4,791,174 pounds of toxics generated in the Georgia side of the river between 2011 through 2012, water quality impairment emerged as a common issue with the presence of mercury, other metals, and pathogens.Based on the GIS mapping, the extensive use of farm land in the region, resulted in a gradual spread of land use elements in the form of gains and declines in the counties under analysis. This is evident from the geographic distribution of the trends. Accordingly the information on the maps point to a continual dispersion of gains and declines in land use elements across space. During the census periods, farmland land distribution showed substantial gains in the initial periods of 1992 to 1997 census in all counties with the exception of the declines in the Jasper area. In terms of factors responsible for change, it is evident that they do not operate in a vacuum. They are linked to several socio-economic elements including government transfer payments, the market value of goods sold and the market value of building and housing variables and the unsustainable use of resources. In addition to domestic consumption, industrial and agricultural use of water remains solidly high in the Georgia area.Clearly, the pressures from built environments and incompatible land uses in the region and the resulting change driven by stressors threaten the adjoining marine ecosystem of the Lower Savanah watershed. More so, the mix scale analysis involving temporal-spatial techniques of descriptive statistics and GIS, showed the presence of locally induced stressors of population growth and farm land loss. While additional impact involves the conversion of farm land to incompatible uses and water pollution. One need not overlook the pace at which activities involving land use, subsidies, water pumpage, rising population and other socioeconomic factors influence degradation of the region. Additionally, the implications of population growth in some counties and the study area stems from the fact that it is associated with the proliferation of stressors known to impact the hydrology and stability of the adjoining ecosystem. Evidently, the vast capital at the disposal of the farm sector in the form of the monetary value of farm products sold in markets, Federal transfer payments, and other benefits shaped by fiscal policy do influence the emergence of ecological stressors as well. The larger the gains in market values of farm merchandise sold, the bigger the use of agrochemicals to enhance yield. This trend not only threatens the carrying capacity of an already fragile coastal streams and ecosystem in the Lower Savannah basin, but it creates a very tedious task for both environmental planners and decision makers. The incidence of change which is attributed to pressures from population, economic activities and housing development resulted in more loss of farm land, declines in irrigated land, harvested cropland land loss, intense use of water, salt water intrusion and increased use of fertilizers to boost farm yield in the counties.To map stressors influencing degradation and environmental change and the factors, the paper used a mix scale method of temporal spatial analysis consisting of simple descriptive statistics analysis connected to GIS. The design of spatial data needed for the GIS analysis required the identification of the digital county boundary lines covering the study periods of 1992 -2007. With the emergence of GIS and its ability to spot areas at risk across time and space, analysing the spatial diffusion of ecological stressors and factors known to influence ecosystem disturbance in the Lower Savannah basin serves a meaningful rationale. This capability was quite critical during the design of data sets deemed ideal for environmental change analysis. Accordingly, GIS technique as used here provides a decision support mechanism for planners in analysing environmental trends in the 6 coastal counties. Consequently, the results of environmental analysis of the trends in the region using a set of ecological, socioeconomic and physical indicators anchored in temporal spatial tools of GIS techniques and descriptive statistics analysis found the Lower savannah watershed to be an ecosystem under stress as a result of many factors. Notwithstanding the aforementioned stressors, policy institutions with jurisdiction in both states of the Lower Savannah River have come up with efforts to mitigate the environmental issues.
5. Conclusions
This paper has analysed the changing environments of the Lower Savannah watershed in Georgia and South Carolina with many findings worthy of significance: a) there were changes in agricultural land areas; b) mix scale methods emerged as a major analytic tool; c) there is a growing presence of pollutants in the area; d) widespread pumpage of water by many sectors in the area; e) the changing environment linked to several elements. Going by the magnitude of change generally, the results provided the basis for strengthening the management of shared environments by two states with better ways for understanding the complex issues in the basin. By indicating the extent of county level changes involving vast acreages of agricultural land and others from irrigated to cropland which many depend on for their livelihood, the directions of future plans often predicated on such pressing issues in a place will tilt towards solutions to emerging problems as identified here. The findings herein thus ushered in templates from which the authorities could draw upon when designing future plans for managing the basin. In the Lower Savannah watershed, where variations in agricultural land is a major indicator of the state of the resource and the regional economy, without estimating the evolving patterns of such a change as local plans demand in the face of competition for investors from neighbours, environmental managers run the risk of offering improper blueprints and solutions for the preservation of farmlands. In that light, the analysis of the watershed was effective in raising an awareness which managers can use for better planning in the future.The emergence of mix scale methodology (built on GIS and descriptive statistics) as analytic tool was quite clear. Using the techniques of mix-scale anchored in descriptive statistics and GIS mapping as methodological tools injected another dimension to the analysis of watershed issues. Because effective management of watershed resources requires integrated approach like the mixscale ––as applied in the research, the approach has been useful in delineating the study area and pinpointing the locations of watershed stress, the over use of resources, and the spatial distribution of environmental externalities of degradation and pollution points in the surrounding areas. This approach is highly effective in helping researchers undertake spatial monitoring of the impacts of human activities on trans-boundary water resources in areas adjacent to pollution threats. In the case of spatial diffusion of contamination risks in some areas of the Lower Savannah, GIS mapping as a management tool proved quite useful in unveiling the occurrences, the levels and challenges across space. Such application reflects a major step in ensuring sustainable watershed management. The provision of such information strengthens the ability of policy makers in identifying areas likely to be exposed to stress, and potential depletion and pollution. It also provides effective benchmarks for assessing the critical conditions of counties in the Lower Savannah region. The practical applications of a mix scale approach involving spatial mapping along with census data, as analytical tools raises awareness of the issues faced in the Lower Savannah in the literature. Given its significance, this ability remains crucial in the design of data infrastructure best suited for environmental restoration in affected counties. Showcasing the growing presence of pollutants across the basin like significant traces of cancer causing chemicals as well as PCBs, mercury and other pollutants including pathogens in fresh water as the study indicates is of great importance. In so doing, the result assumes an environmental health significance that is essential in unveiling threats and protecting citizens from the dangers posed by the presence of toxic and chemical waste sites in areas adjacent to fresh water ecosystem. Another dimension to such disclosure comes with the acknowledgement of the Savanah river basin as one of the nation’s waterways most threatened by pollutants, a finding which other studies rarely delve into. Providing citizens such information offers them a common knowledge of high risk areas from pollution and where to avoid during recreational activities on coastal waters for their own safety in the face of continual impairment of quality as indicated in the results. The fact that the study identified the rising pumpage of ground water by many sectors in the basin is not isolated but rather a testament to the present state of water use and a changing hydrology which merits the attention of all. In a part of the country dominated by a false perception of water abundance, the inventorying of water use in this research, coupled with the stress and resultant pressures mounted on it from agriculture, industries and other sections of the economy not only reaffirmed the critical nature of water as a resource, but also it shows how our common daily habits and practices can impede availability to the detriment of sustainable future. With such emphasis on the state of water use in the basin and the fact that previous mitigation initiatives did little to resolve these concerns, the approach in this study helps elevate a major issue into the policy and research arena. Without broad analysis herein, little would have been known about the susceptibility of counties to water issues. Since this study revolved around environmental management, such findings will shape in some ways how communities and policy makers plan for water use. The presentation of water use matrix as presented here is not only vital for effective policy, but it is essential in arriving at responses that serve the needs of the region. In that setting, re-echoing the state of water use augments the visions of best management practices (BMPs) for the area.In having identified the factors fuelling change, the study thus generated insights for tracking these indicators as ways for improving conservation efforts. There is an immense opportunity for planners to gauge their attributes across time and appraise the risks to environmental quality of the basin. Being a step forward for conservation, the identification of these factors, quickens the preparedness of policy makers in tracking the state of the environment and the role of competing elements in impeding ecosystem quality. This would enable counties craft BMPs in critical situations. The fact that the occurrence of degradation associated with the factors were at levels large enough to impact the environment makes the analysis herein an additional insight for improving the current approach to managing shared resources in different areas especially the Lower Savannah basin. Accordingly, the study provides policy makers with a better grasp of the threats posed by cancer causing chemicals to the basin they would not have known that are too costly to ignore by communities. Considering what transpired in the basin and having come this far, managers of the basin in the neighboring states would be hard pressed in the coming years in the region to answer some critical questions. These include what new risks would emerge in the Lower Savannah environment? Will natural resources be impacted? How will the spatial aspects of change be manifested? What new elements will drive change in the basin? In light of these questions, there are great opportunities in all these for the research community and decision makers to refocus the agenda on watershed management with policy efforts that place high premium on quality and wise use on a sound footing within the policy arena in order to improve standards, BMPs and good stewardship in natural resource use within shared watersheds in the years ahead.
Appendix- A
3.5. Efforts
3.5.1. Congressional Oversight towards Restoration
In the past, the United State Congress authorized an Army Corp of Engineers study on the Lower Savannah in the early 1990s to find a way to restore the watershed. Considering the recurrent threat from human activities over the years in the region, such restoration initiative resulted in species recovery and a boost to biodiversity. While the recovery plan in the basin involves the reintroduction of species such as the Arctic peregrine falcon, bald eagle and the brown pelican, one thing to bear in mind stems from the emergence of other species like the red knot as candidates for listing under the endangered group. The purpose of the army corps of Engineers scheme was to devise novel methods to revive the breeding of important fisheries and reestablish flow to wetlands and the ecological quality of the whole watershed. This was to be attained without disturbing navigation along the river.
3.5.2. The Development of Simplified Guides for Watershed Planning
Another dimension to the efforts to contain the degradation of the watershed centers on the active involvement of state entities with jurisdiction over the South Carolina side of the basin. Considering the growing demand for mitigating the declining quality of the environment, the South Carolina Department of Health and Environmental Control (DHEC) designed the state’s basic road map to crafting watershed plans. It offered an abridged synopsis of EPA’s nine important components of watershed planning. As part of the efforts, the DHEC also produced documents to support participants and communities all through the various stages of the watershed action plans. The watershed based worksheet therein can assist during the planning process in order to ensure that all essential ingredients have been factored.
3.5.3. Cooperative and Joint Management of the Basin
In current years, agencies, groups, and businesses from both South Carolina and Georgia commenced an initiative to jointly protect the resources of the Savanah River basin so as to conserve and rehabilitate, its ecosystems in a way that sustains several uses. In that light, the Savannah River Basin Watershed Project was introduced in 1993 to initiate a process for joint and comprehensive management of the basin. Just as interested parties have been highlighting ecological issues in the watershed, there is a framework to rectify emerging concerns. Under that setting, organizations involved in the project use existing structures to address their own concerns. Such an approach not only offers basin stakeholders a platform for expressing their opinions on the emerging issues for their agency, but it reinforces the importance of Savannah River Basin watershed project for addressing the existing problems. Aside from team efforts involving the South Carolina DHEC and the Savannah District Corps of Engineers in the areas of dredging and monitoring along the Savannah Harbor, the state of Georgia and the EPA have been working to get Lake Hartwell classified as a no-discharge area regarding marine sanitation equipment on boats. Added to that are programs for dealing with water quality monitoring, water quality standards, and non-point source pollution.
3.5.4. Multi-stakeholder Panel and Participation
In the past several years, various dialogues have been held regarding water management in the Savannah River basin. As a result of these discussions, major efforts were made to address the wide-ranging benefits pertaining to the ecosystem health of the basin. These efforts include water quality and management studies being conducted by Georgia and South Carolina, and the US Environmental Protection Agency’s Savannah River Watershed Project and the US Army Corps of Engineers Savannah River Basin Comprehensive Study. In a similar vein, the water Resources Management Branch of the Georgia Environmental Protection Division (EPD) is in agreement with suggestions put forward by the six resource Commissions of the Savannah River Basin Watershed Project (SRBWP). While the cardinal issues under consideration delved on the need for sufficient water access for the people of Georgia. The panel upheld assessment procedures based on participation of all stakeholders linked to Savannah River basin recovery program. The expectation is that opinions of different groups with common interest on the stability of the basin’s ecosystem remained indispensable in understanding the path towards recovery.
Appendix- B
5.1. Recommendations
5.2.1. Institute Environmental Education
The extent and nature of environmental stress from land use activities to the concentration of pollutants in the region transcends different areas, jurisdictions and stakeholders in the built environments across the basin. Being an area known for frequent land loss with widespread use of fertilizer and pollution, the inherent impediment to the ecosystem in these settings and to the livelihood of the adjoining communities remains a major concern that requires urgent attention. Dealing with the problem calls for a comprehensive environmental education especially for those whose daily activities impede the environmental quality of the watershed. Such an educational approach has the potential to assist land owners, policy makers, and developers and the private sector in coming to terms with how their actions can make a difference in the search for solutions. In that light, the paper recommends the need for environmental education towards the restoration of the Lower Savannah basin watershed.
5.2.2. Initiate Watershed Planning Among Transboundary Counties
Coastal environments rely heavily on the stability of surrounding areas. In the case of the Lower Savannah watershed which runs through many counties in different states, restoration measures built on transboundary planning along common physiographic units is indispensable in the remediation. Notwithstanding the fact that the counties of the watershed spread across different states are in a similar ecozone with common ecological parameters, very little has been done in the region to embrace watershed planning. Considering the gravity of transboundary pollution associated with fertilizer run offs and the persistent load of nitrates, mercury and other carcinogenic chemicals floating in the Savannah River basin, the research suggests the adoption of watershed planning among the six coastal counties along the South Carolina and Georgia boundaries. Being a plan that helps communities address water quality issues, it encompasses multi community participation, evaluation of exact causes of water quality glitches, and the implementation of mitigation measures. Such an approach has the potential to enhance coordinated clean up and restoration so as to elevate the quality of the watershed in line with common standards pertinent to coastal areas.
5.2.3. Strengthen Planning Institutions and Land use Policy
Every pristine ecosystem whether coastal or inland is a testament to functional institutions where the land use regulations are regularly in observance. The weaker the institutions, the more ineffective the laws intended to protect the environment become. With conflicting land uses and their impacts obvious on the watershed environment over the years, strengthening institutions with powers to sanction policy violators would go a long way in charting the right path towards a solution to the recurrent problems being felt in the basin. Additionally, most institutions in city management are required by state laws to review and approve and enforce comprehensive plans that include nature protection. In that setting, land use regulations are used in putting plans into action. While this includes the tendency to separate conflicting land uses from industrial, residential, agricultural and green spaces to low impact development, the Savannah River basin remains overly stressed despite the police powers vested in the cities to preserve ecosystems. Given the inability of institutions to address these problems the paper calls for the strengthening of institutions and their policy so that they can become more effective in monitoring and enforcement.
5.2.4. Design Regional Environmental Information System
The current conditions of the study area; the lower Savannah River watersheds along the six coastal counties require an unrestricted access by policy makers and managers to a regional geospatial environmental information system. Such an integrated geographic based devise should be designed under a comprehensive framework in order to ensure the development and analysis of spatially referenced data on different socio-economic and ecological indicators (linked with water quality and quantity decline and farming, the discharge and location of toxic waste and pollutants) under different timeframes. Designing spatial data infrastructure of that magnitude for appraising the scale of environment-human interface on watersheds will help quicken current capability of resource managers in predicting the carrying capacity thresholds of the environment and areas along the water bodies under critical conditions. It will also be an indispensable tool for tracking the threats posed by run-offs and nutrient flow from agriculture and land use activities, the concentration of heavy toxic loads, and the location of toxic materials in the Lower Savannah watershed.
References
| [1] | Merem, E.C., & Twumasi, Y.A. (2011). The Applications of GIS in the Analysis of the Impacts of Human Activities on South Texas Watersheds. International Journal of Environmental Research and Public Health, 8:2418-2446. |
| [2] | Merem, E.C., & Twumasi, Y.A. (2008 December). Using Spatial Information Technologies as Monitoring Devices in International Watershed Conservation along the Senegal River Basin of West Africa. International Journal of Environmental Research and Health, 5: 5:464-76. |
| [3] | Farquhar, J. (2014). Threatened and Endangered Species of The Lower Savannah River Basin. Retrieved 29thJanuary Fromhttp://www.ehow.com/info¬_8591423-threatened-lower-savannah-river-basin.html. |
| [4] | Merem,E.C.,&Twumasi,Y.A. (2010). Using Geo-information Systems In Assessing Water Quality in The Mid -Atlantic Region Agricultural Watershed of Maryland. International Journal of Ecology. |
| [5] | Merem, E.C., & Twumasi, Y.A. (2008 March). Geospatial Information Systems Analysis of Regional Environmental Change Along The Savannah River Basin of Georgia; International Journal of Environmental Research and Public Health, 5: 1:281-294. |
| [6] | Russell, G. (2007). The Role of GIS In Selecting Site For Riparian Restoration Based On Hydrology and Land Use. Restoration Ecology, 56-68. |
| [7] | Dodd, M.S (1993). Lower Savannah River Environmental Restoration Study. Proceedings of The 1993 Georgia Water Resources Conference. Athens: the University of Georgia, Georgia. April 1993. |
| [8] | Meredith, A. C. (1997). Emerging Water Resources Management Issues In The Savannah River basin. Proceedings of The 1997 Georgia Water Resources Conference, Athens: the University of Georgia, Georgia. March 1997. |
| [9] | Stack, D. (2014). The Interplay of Environmental Land Use and Zoning Laws For The Protection of Georgia Coastal Resources. Atlanta, GA: Stack and Associates PC. 1-42. |
| [10] | Scorecard. (2014). Savannah Watershed: Clean Water Act Status Report. Retrieved 1st 29th January From http://scorecard.goodguide.com/env-release/cwa-watershed.tcl?huc8.=03060109 1/29/2104. 1-4. |
| [11] | United States Department of Agriculture. (2014), NAAS Census of Agriculture Historical Highlights for South Carolina and Georgia, Census of Agriculture Data 1992-2007. Washington, D.C: USDA, NASS. |
| [12] | Landers, M.( 2009). Savannah River Fourth Most Polluted In Nation. Savannah Morning News. Retrieved 29th January 2014 From http://savannah.com/news/2009-10-22/savannah-river-fourth-most-polluted-nation. 1-2. |
| [13] | United States Environmental Protection Agency. (1989). South Carolina Superfund Site: Savannah River Site. Retrieved 29th January 2014 Fromhttp://www.weitzlux.com/environmentalawsuit/soutcarolina/savannahreiversi_14675.html. 1-3. |
| [14] | Georgia Statistics System. (2014). The Georgia County Guide, Athens: University of Georgia. |
| [15] | Natural Resources Conservation Services (NRCS) (2010). An Assessment of the Lower Savannah Subbasin. Washington , D.C: USDA, NRCS. |
| [16] | South Carolina Department of Health and Environmental Control, Bureau of Water. 2014. Retrieved 29th January 2014Fromwww.schec.gov. http://www.scdhec.gov/environmental/water/shed/planning.htm . 1-1. |
| [17] | Merem, E.C. (2012 October). The Applications of Geo-Info Systems To gauge The Susceptibility of Coastal Areas In Louisiana and Mississippi. The American Journal of Geographic Information Systems. (AGIS). 1:3:46-65. |
| [18] | Merem, E.C., & Twumasi, Y.A. (2012 March). Using GIS and Climate Risk Information Systems to Analyze the Vulnerability of Coastal Counties in Louisiana and Mississippi. Resources and Environment. 1-1-1-18. |
| [19] | Merem, E. C. Using Geospatial Information Systems in Analyzing Urbanization Impacts on Stream Southern Habitats in Mississippi Coastal Ecosystem.(2011 December). Journal of Environmental Science and Engineering. 5:12-1624-1641. |
| [20] | Merem, E.C., & Twumasi, Y.A. (2007). Using GIS and Remote Sensing In The Analysis of Ecosystem Decline Along The River Niger Basin: The Case of Mali and Niger.The International Journal of Environmental Health and Public Health. 4: 2: 278-289. |
| [21] | Merem, E.C., & Twumasi, YA. (2006b). GIS and Remote Sensing applications in the assessment of change within a coastal environment in the Niger Delta region of Nigeria. International Journal of Environmental Health and Public Health, 98-106. |
| [22] | Biswass, S. (2002), Remote Sensing and GIS Based Approach For Watershed Conservation. Journal of Survey Engineering. 3:108-124. |
| [23] | Prakash, A.K. (2007). Deciding Alternative Land Use Options In a Watershed Using GIS. Journal of Irrigation Drainage Engineering. 133:162-174. |
| [24] | Usery, E.L. (2004). Geophysical Data Resampling and Resolution Effects On Watershed Modelling: A Case study Using Agricultural Non-Point Source Pollution Model. Journal of Geophysical Systems, 6:289-306. |
| [25] | Kwalie, M. (2005). Watershed Characristics, and Fabrics. The Application of Remote Sensing and Geographic Informations Systems. Lakes and Reserviors Resource Management. 10:85-92. |
| [26] | Lovejoy, S. (1997). Watershed Management for Water quality Protection: Are GIS and Simulation Models the Answer? Journal of Soil and Water Conservation. 103. |
| [27] | United States Bureau of Census. (2010). United States Census Quick Facts. State and County Highlights, Washington, DC: US Department of Commerce. |
| [28] | Wrona, A. (2007). Restoring Ecological Flows to The Lower Savannah River: A Collaborative Scientific Approach to Adaptive Management. Proceedings of the 2007 Georgia Water Resources Conference. Athens: University of Georgia, Georgia, March 2007. |
| [29] | Georgia Statistics System. (2013). The Georgia County Guide, Athens: University of Georgia Retrieved 28th of January 2013 From http: llwww.georgiastats.uga.edu /NEW%20 Watershed %20 Pages/Lower%20Savannah/Low. |
 Abstract
 Reference
 Full-Text PDF
 Full-text HTML