Luciana M. Cardoso, Fernando B. Mainier, José A. P. Itabirano
Universidade Federal Fluminense, Niterói, Brazil
Correspondence to: Fernando B. Mainier, Universidade Federal Fluminense, Niterói, Brazil.
| Email: |  |
Copyright © 2014 Scientific & Academic Publishing. All Rights Reserved.
Abstract
This work uses the methodology of cathodic stripping voltammetry with a mercury drop electrode to separately and simultaneously quantify cyanide (CN-) of other species present in industrial effluents such as toxic metals (Cd2+, Zn2+), sulfides (S2-) and thiocyanate (SCN-). Voltammetry is a technique for electroanalytical study of the relationship between current and potential during the electrolysis of a chemical species, thus providing measures of direct quantification of analytes, which justifies the use of the technique to monitor these species. This technique has been used to determine the residual cyanide in effluents after treatment in the electrolytic cell laboratory developed with in situ generation of chlorine (Cl2), under alkaline conditions, aiming at the destruction of cyanide in carbon dioxide (CO2) and nitrogen (N2), non-toxic products. The results presented in laboratory assays have been quite satisfactory. Therefore, this technique can be used to quantify the amount of cyanide in industrial effluents.
Keywords:
Cyanide, Contaminations, Voltammetry, Electrolytic removal, Effluent
Cite this paper: Luciana M. Cardoso, Fernando B. Mainier, José A. P. Itabirano, Analysis Voltammetry of Cyanide and Process Electrolytic Removal of Cyanide in Effluents, American Journal of Environmental Engineering, Vol. 4 No. 6, 2014, pp. 182-188. doi: 10.5923/j.ajee.20140406.07.
1. Introduction
1.1. Voltammetry
Voltammetric analysis was developed from polarography, which is a particular kind of voltammetry using a mercury drop electrode. Polarography was discovered by Jaroslav Heyrovsky in the early 1920s and earned him the Nobel Prize in Chemistry in 1959. In the mid-60s, classic voltammetry underwent modifications that significantly increased the sensitivity and selectivity of the method, together with the development of low-cost commercial instruments. These facts increased the application of polarographic methods for the determination of different species of pharmacological interest, both environmental and biological.The decline of polarography, in the mid-70s, was because of the large amount of mercury generated, with environmental consequences, and the development of faster and more convenient methods, such as spectroscopic and other voltammetric techniques that do not use the leaky mercury electrode [1].The voltammetric techniques are a group of electro-analytical methods in which information about the analytic solution is obtained through current measures as a function of applied potential, where the potential and the resulting current are recorded simultaneously [2].Currently the equipment has a cell consisting of three electrodes immersed in a solution containing the analyte and also an excess of unreactive electrolyte called a supporting electrolyte. One of the three electrodes is the microelectrode or working electrode, whose potential varies linearly with time. Its dimensions are kept small to increase the tendency to become polarized (Figure 1).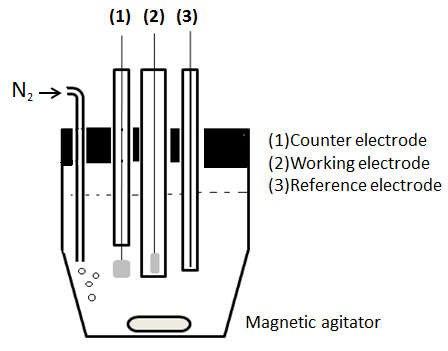 | Figure 1. Schematic diagram of a cell for voltammetric measurements |
The measurements are usually carried out in a medium that consists of solvent containing a supporting electrolyte. The choice of the solvent is dictated primarily by the solubility of the analyte and its redox activity, and chemical reactivity.The working electrode most widely used in voltammetry is still mercury. It consists of a mercury reservoir connected to a glass capillary tube with a length ranging from 5.0 cm to 20.0 cm. The mercury is forced to pass by gravity through a pipe whose inside diameter ranges from 0.2 to 0.5 mm, producing a constant flow of identical droplets with diameters ranging from 0.2 to 1.0 mm [1, 3].The curve of current versus potential is called a voltammogram. This curve is obtained during electrolysis of species in an electrochemical cell that consists of two electrodes: one of them being a microelectrode and the other a relatively larger surface electrode (a reference electrode).The potential is applied between two electrodes doing a scan, that is, with a constant speed as a function of time. The measures are obtained under conditions that stimulate the polarization of a working electrode. As the area of the two electrodes is different, the microelectrode if the largest surface while polarizes. Under these conditions, the potential remains constant. The voltammetry is based on measuring the current that develops in an electrochemical cell under conditions of complete concentration polarization. In the voltammetric analysis, the minimum consumption of the analytical solution occurs. Mercury is a very attractive choice of electrode because it has a high hydrogen overvoltage that greatly extends the cathodic potential window and is highly reproducible compared to solid electrode materials.In the hanging mercury drop electrode (HDME) process the drop of mercury is formed and remains motionless on the tip of the capillary, so the voltammogram is registered on the basis of that single drop [2]. The most appropriate range of mercury electrode (Figure 2) is in the region of cathodic potential, which can vary from -2.1 V to + 0.25 V vs. Ag/AgCl electrode (saturated with KCl 3.0 M), depending on the medium used.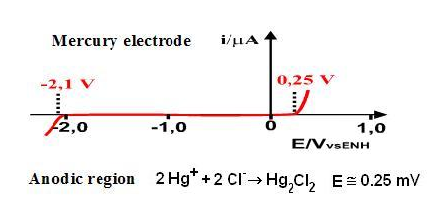 | Figure 2. Electrode potential range of Hg |
The present study uses differential pulse (DP) voltammetry of cathodic redissolution. In all processes of redissolution, the analyte is initially deposited on the electrode from a solution under agitation. After the deposition stage, electrolysis and agitation are discontinued for a period of time and the analyte is determined. Having completed the second stage, the analysis, the analyte is redissolved from the working electrode surface, which gives the technique its name redissolution [4].In redissolution, the working electrode cathode behaves like an anode during the deposition step and as a cathode during the second stage of redissolution [1]. The presence of dissolved oxygen (O2) in a solution interferes with the determination of other species, so it is necessary to remove the dissolved oxygen via a direct current of nitrogen (N2), so avoiding the possible formation of hydrogen peroxide (H2O2).The data treatment usually performed in voltammetry for quantitative analysis consists in measuring the peak current. The currents obtained are then related to the concentrations of the standard solutions of the electroactive species and concentration of species in the sample of interest. For the quantitative analysis, the standard addition method was used. This method is used in order to minimize the matrix effect. In the case of a complex matrix, there are species that affect the properties of the substance to be determined.
1.2. Cyanide
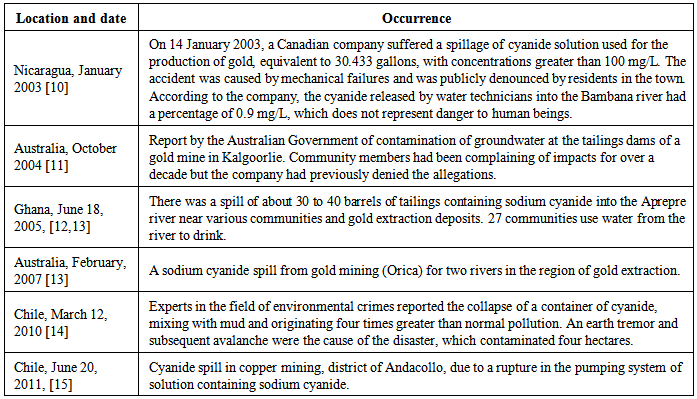
Cyanide is, a deadly substance that exists in water as hydrocyanic acid (HCN), a weak acid with ionization constant (Ka) of 6.0 x10⁻¹⁰ [2]. The cyanide ion (CN-) has a strong affinity with various metal ions, such as Fe2+, forming relatively less toxic substances such as ferricyanide, [Fe (CN)64-]. The cyanide ion (CN-) is a very stable species that does not easily decompose in the environment.HCN vapours are very toxic, and were used at a certain time in the gas chambers and during World War I as a lethal gas [5]. Sodium cyanide (NaCN) is used in industry, specifically in mineral processing operations, pickling and electrolytic baths. In oil refineries and steel mills, the cyanide ion (CN-) is also one of the main pollutants in effluents from coke ovens and their treatments [6-8].HCN as a salt is highly poisonous since a dose of only 60 mg -90 mg is enough to kill a human being. HCN levels around 0.03% in the atmosphere are toxic. Legislation allows the disposal of CN- to Brazilian municipal sewers in the order of 5 mg/L – 10 mg/L although levels less than 0.2 mg/L are considered fatal to many species of fish [2]. A standard of 50 mg/L weak acid dissociable cyanide is generally accepted to be a safe level for water accessible to wildlife or migratory birds. Methods of risk assessment, reflecting the trend to predict, plan and be alert to industrial risks, would be more effective if it were possible to predict all possible events and more stringent assumptions and criteria of analysis were established. Industrial accidents that provide more significant learning are extremely traumatic for workers and the environment, especially when there are fatal victims, and also affect drastically the populations that inhabit the surrounding industrial facilities [9].Aiming to give a view of this situation, Table 1 below summarises a series of accidents that occurred, contaminating the environment, as reported by the media over the past ten years.Table 1. Cyanide spills to the environment
 |
| |
|
2. Removal of Cyanide by Electrolytic Process
The removal process of cyanide uses an electrolytic cell consisting of two platinum inert electrodes (anode and cathode) inserted into two glass tubes, in contact with the electrolyte (sodium chloride solution, 0.1 mole/L), under the action of an external source of direct current, producing, respectively, chlorine (Cl2) and hydrogen (H2), as shown in Figure 3 and the electrochemical reactions [16, 17]:Anodic reaction: 2 Cl- - 2e- → Cl2Cathodic reaction: 2 H2O + 2 e- → H2 + 2 OH- Cyanide destruction is evaluated by placing a certain volume of cyanide solution in an electrolytic cell with the production of chlorine activated for certain duration. The destruction of cyanide can be explained by the following reactions.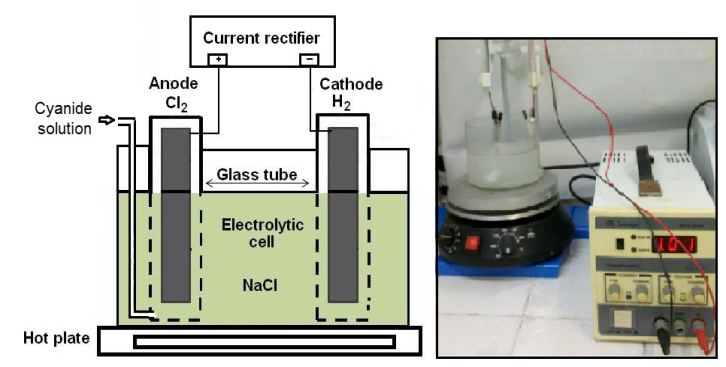 | Figure 3. Electrolytic cell for removal of cyanide in solution |
The reaction proceeds via the formation of a chemical intermediate called sodium cyanate (NaCNO), which in a second step reacts with chlorine (Cl2), releasing the gases carbon dioxide (CO2) and nitrogen (N2):NaCN + Cl2 + 2 NaOH → NaCNO + 2 NaCl + H2O2NaCNO +3 Cl2 + 4NaOH → 6 NaCl + 2CO2 + N2 +2H2OAlternatively, there is direct destruction of sodium cyanide where the formation of sodium hypochlorite (NaOCl) is generated in the reaction medium:Cl2 + 2 NaOH → NaOCl + NaCl + H2ONaOCl + NaCN → NaCNO + NaCl2NaCNO +3NaOCl + H2O →3NaCl +2NaOH +2CO2 +N2
3. Materials and Methods
3.1. Voltammetry Analysis
The equipment for voltammetric analysis (VA-797, Metrohm) shown in Figure 4 was used in the present study. The equipment works with three electrodes combined: the working electrode (mercury multimode), reference electrode (Ag/AgCl-KCl 3.0 mole/L) and auxiliary platinum electrode.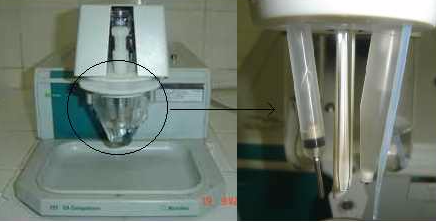 | Figure 4. Equipment for voltammetric analysis (VA-797, Metrohm) |
The electrodes and the glassware used were decontaminated with diluted nitric acid and then washed with ultrapure water. In the preparation of standard solution, ultrapure water produced by the Simplicity system was used. The standard preparation of cyanide (CN-) was carried out with NaOH solution 0.1mole/L in order to retain the analytes. The support electrolyte 0.1 mole/L of KNO3 was used to minimize the possibility of loss of analyte during the analysis.To a cell containing 10 mL of 0.10 mole/L KNO3 (support electrolyte), 1 mL volume of the sample to be analyzed was added with the aid of a pipette. The cell was closed and immediately purged with nitrogen (N2) to remove dissolved oxygen present in the solution.The instrumental parameters used in the equipment VA 797 are listed in Table 2.| Table 2. Instrumental parameters |
| | Working electrode | HMDE | | Stirring speed | 2000 | | Method | Differential Pulse (DP) | | Purge time | 300 s | | Waiting time | 15 s | | Pulse amplitude, | 0.05 V | | Initial potential | -0.90 mV | | Final (end) potential | 0.40 mV | | Voltage/sep. | mV |
|
|
3.2. Removal of Cyanide by Electrolytic Process
The study proposes the use of standard solutions of sodium cyanide (NaCN) at concentrations of 100, 300, 600 and 1000 mg/L of CN-, treated in an electrolytic cell developed with in situ generation of chlorine (Cl2) in an alkaline medium aimed at the destruction of cyanide into carbon dioxide (CO2) and nitrogen (N2). The electrolytic cell is equipped with a source of electromotive force of 15 V. The current intensity ranged from 1.0 to 1.2 and the removal time was 2 hours. The cell and platinum electrodes are shown in Figure 3.The preparation of standard solutions of cyanide (CN-) should be performed in NaOH solution 0, 1mole/L in order to retain the analytes. The same was done in the preparation of the electrolyte, 0.1 mole/L NaCl, minimizing the possibility of loss of analyte during the removal process of species CN-.In both solutions ultrapure water from the Simplicity system was used. Electrolysis was performed by adding 1000 mL NaCl electrolyte and 500 mL of the standard solution of NaCN to the studied electrochemical cell under constant stirring, using the instrumental parameters listed in Table 2. The residual content of cyanide was monitored, for voltammetry analysis, during treatment in the electrolytic cell.
4. Results and Discussion
The development of the work began with a preliminary study to build a commercial pattern of species cyanide (CN-) in order to verify the behavior of the analyte and the instrumental parameters based on the principles of the methodology developed in voltammetry determinations [2], as well as the determination of the detection limit (DL).Later began the study of the NaCN and electrolyte solutions (NaCl) used in the process of removing the species cyanide (CN-), added in different concentrations to the electrochemical cell to represent their contamination in industrial effluents. The process efficiency was monitored, for voltammetry analysis, after 1 and 2 hours of removal.
4.1. Analysis of Cyanide Standard Solution (Commercial Standard)
The study of standard CN- recovery analyte was obtained from a 100 mg/L standard solution of CN-, with a characteristic peak at -0.3 V and limits of detection as shown in Figure 5.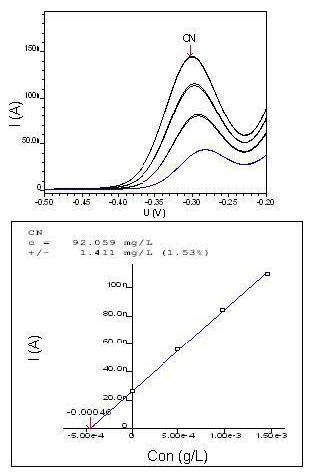 | Figure 5. Graphic of voltammetry and CN- curve of 100 mg/L |
Limit of detection Ten individual determinations were made of the concentration of CN- (20 mg/L) using as the sample volume the smallest possible volume of standards allowing a sign above 2.0 nA, the value above which the equipment registers the graphic of voltammetry with discernible resolution and low current noise interference. The five best recovery analyses were selected to allow us to establish the limit of detection (LD), i.e., the lowest concentration detected by equipment, as shown in Table 3 and Figure 6 below. The LD of cyanide is in the order of 82.854 (µg/L).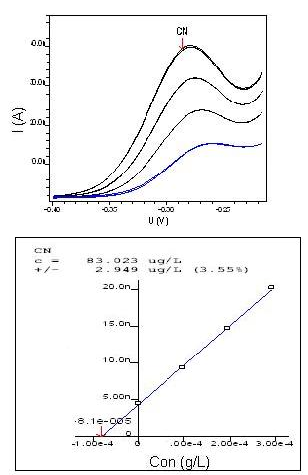 | Figure 6. Limit of detection of CN- in 20 mg/L |
| Table 3. Limit of detection (LD) |
| | Species | Measures | Average (μg/L) | | 1nd | 2 nd | 3 nd | 4 nd | 5 nd | | CN- | 78.51 | 84.68 | 84.56 | 83.02 | 83.40 | 82.85 |
|
|
4.2. Analysis of the Solutions Used in the Removal Process
Solutions of sodium cyanide (NaCN)Analyses were performed on NaCN solutions to ensure the concentration of CN-submitted subsequently to the removal process. The following recovery analyses of 100, 300, 600 and 1000 mg/L of CN– were obtained, as shown in Table 4 and Figure 7 below.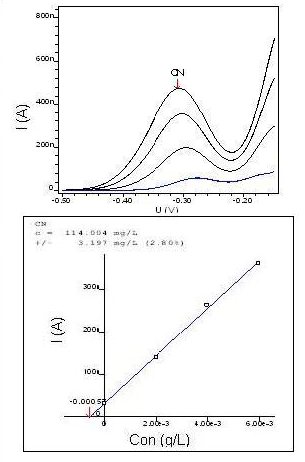 | Figure 7. Graphic of voltammetry and NaCN standard curve of 100 mg/L of CN- |
| Table 4. Voltammetry analysis of NaCN solutions |
| | Concentration (mg/L) | 100 | 300 | 600 | 1000 | | Recovery (mg/L) | 114 | 323 | 613 | 1059 |
|
|
Electrolyte consisting of 0.1 mole/L In order to ensure that the electrolyte consisting of 0.1 mole/L sodium chloride used in the removal process was totally free of cyanide (CN-), a voltammetry analysis was carried out as shown in Figure 8. The analysis showed that the concentration of cyanide (CN-) is zero.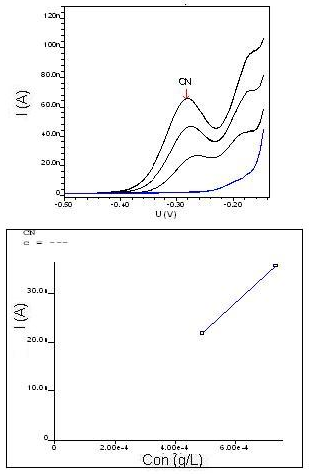 | Figure 8. Graphic of voltammetry and NaCl standard curve of 0.1 mole/L |
4.3. Cyanide Analysis during the Process of Removing Chemical with Chlorine (Cl2) Produced in the Electrolytic Cell
In the removal process, for the study of each solution 1000 mL of the electrolyte (0.1 mole/L NaCl) and 500 mL of NaCN was added to the electrochemical cell for the purpose of subjecting them to the same dilution factor.The cyanide content was monitored prior to the commencement of proceedings under the following conditions: (t = 0), after t = 1h and t = 2h, obtaining the following results shown in Table 5.| Table 5. Determination of the residual concentration of CN- in electrochemical cell after destruction of the sodium cyanide |
| | Initial concentration of NaCN | Reaction time in the electrochemical cell | Reduction of initial concentration of NaCN (%), t=2h | | t = 0 | t = 1 h | t = 2 h | | 100 mg/L | 46 mg/L | < LD | < LD | 100% | | 300 mg/L | 136 mg/L | 11 mg/L | < LD | 100% | | 600 mg/L | 281 mg/L | 207 mg/L | 154 mg/L | 45,2% | | 1000 mg/L | 409 mg/L | 347 mg/L | 240 mg/L | 41,3% |
|
|
5. Conclusions
The voltammetry analysis technique allows the detection and quantification of species CN-. The study of the standards of analyses provided satisfactory results, ensuring the accuracy and reliability of the technique of differential pulse voltammetry of cathodic redissolution, efficiently applied to the analysis of trace constituents.The limit of detection (LD) obtained in this study is satisfactory, in the range of concentration of µg/L, and can be easily reproduced if complying with all the conditions of the analysis, mainly the accuracy in the preparation of standard solutions and the care required to prevent loss of analytes for the determination.The process of removing cyanide with the in situ production of chlorine (Cl2) in an electrolytic cell for a period of 2 hours presented satisfactory results for solutions with concentrations of up to 300 mg/L of CN-, showing results below the limit of detection, i.e., a reduction of 100% of the transformation of cyanide into non-toxic gases (CO2 and N2).For higher concentrations of sodium cyanide in the removal process, the yield was about 40%. It is possible to increase the yield of the removal process in the electrolytic cell by increasing the intensity of current and the area of contact of the electrodes. A further study will search for an accurate time, proportional to the residual amount of cyanide to be treated.Finally, spillage and generation of cyanides in industrial processes are always activities of risk to man and the environment. Independent of the removal processes adopted by those waste-generating activities, they should assume their responsibilities and adopt measures to minimize or avoid the environmental impacts associated with these activities, with the main objective of cooperating with and participating in sustainable development.
References
| [1] | F. J. Holler, D. A. Skoog, and S. R. Crouch, Principles of instrumental analysis. Belmont: Thomson, 2007. |
| [2] | J. A. P. Itabirano, M. A. M. Oliveira, M. F. Guerrante and C. P. Souza, Studies on simultaneous determination of interference of cyanide, thiocyanate and sulphide through voltametric analysis, LPQ/UFF, Chemical Management /Cenpes/Petrobras, Rio de Janeiro, Brazil, 2005.(in Portuguese). |
| [3] | A. F. Safavi, N. Maleki and H. R. Shahbaazi, Indirect determination of cyanide ion and hydrogen cyanide by adsorptive stripping voltammetry at a mercury electrode, Analytica Chimica Acta, 503(2), 2004, 213-221. |
| [4] | A. P. Brown and F. C. Anson, Cyclic and differential pulse voltammetric behavior of reactants confined to the electrode surface. Analytical Chemistry, 49(11), 1977, 1589-1595. |
| [5] | M. Passagli, Forensic toxicology, theory and practice, Millennium Publisher: Campinas, São Paulo, Brazil, 2011. (in Portuguese) |
| [6] | X. Dai, A. Simons and P. Breuer, A review of copper cyanide recovery technologies for the cyanidation of copper containing gold ores. Minerals Engineering, 25(1), 2012, 1-13. |
| [7] | C. Li, H. Li, M. Wang, X. Yang and X. Hao, Life cycle assessment of different gold extraction processes. Energy Technology 2014: Carbon Dioxide Management and Other Technologies, 2013. |
| [8] | Mainier, F. B., L. P. Monteiro, L. H. Fernandes, and M. A. Oliveira, Restrictions on the use of cadmium coating in industries. Journal of Science and Technology, 3(2), 2011, 176-180. |
| [9] | F. B. Mainier, R. J. Mainier and V. L. Silva Cardoso, Clean technology and industrial safety: a right of society. International Journal of Multidisciplinary Science and Engineering, 4(5), 2013. |
| [10] | Nicaragua: Canadian mining company accused of cyanide spill, http://www.wrm.org.uy, accessed in 21/April/2014.(in Spanish). |
| [11] | Cyanide incidences, http://www.rainforestinfo.org.au/gold/, accessed 21/April/2014. |
| [12] | Cyanide spillage at BGL again, http://www.ghanaweb.com/, accessed 19/April/ 2014. |
| [13] | F. A. Lemos, Electrolytic recovery of copper, gold and silver in Gold Mining Effluent. Doctoral thesis, COPPE/UFRJ, Rio de Janeiro, Brazil, 2008. (in Portuguese). |
| [14] | Spill of cyanide, http://www.noalamina.org/,accessed 19 April 2014. (in Spanish). |
| [15] | Spill of cyanide MDA in 20 June 2011,http://cma-andacollo.blogspot.com), accessed 21/April/2014. (in Spanish). |
| [16] | F. B. Mainier, L. P. C. Monteiro, A. C. M. Rocha and R. J. Mainier, Industrial electrochemical: a new teaching approach, American Journal of Engineering Research, 2(8), 2013, 58-64. |
| [17] | T. F. O’Brien, T. F. Bommaraju and F. Hine, Handbook of Chlor-Alkali Technology: Volume I: Fundamentals. Springer, 2005. |
 Abstract
 Reference
 Full-Text PDF
 Full-text HTML