Endalu Lemma, Habtom Tekilu
Department of Chemical Engineering, University of Wachemo (WCU), Hosanna, Ethiopia
Correspondence to: Endalu Lemma, Department of Chemical Engineering, University of Wachemo (WCU), Hosanna, Ethiopia.
| Email: |  |
Copyright © 2014 Scientific & Academic Publishing. All Rights Reserved.
Abstract
The aim of this paper was to assess the amount of municipal solid waste generated in Hosanna town located in southern Ethiopia. Analysis was carried out to calculate amount of solid waste generated daily and annually per person per capita. Mixed questionnaries survey and direct waste analysis at source basis were used for data collection. Representative samples were selected from hotels, bar and restaurant, cafes, offices, abattoir, correctional facilities, educational facilities, and conventional household in each ‘kebeles’. Eleven millions of kilogram of waste was generated per year throughout the town, of which 82% garbage, 7% paper, 5% plastic, 3% ‘Chat’ stalk, 2% glass, and 1% others. Wastes from construction, industries, and unconventional units were not included. Empirical formulas-through observation and calculation were developed to calculate waste generation multipliers and to estimate composition variation within time. Despite the fact that the major problem of solid waste management was linked to administration, the study shows that characterization and waste disposal also make a substantial contribution to the problem. The generations estimated will be twenty-one million of kilograms of waste by twenty-twenty three. Therefore, an area 106,158m2 of sanitary landfill with service life of ten year will be required for the disposal.
Keywords:
Municipal solid waste characterization, Site selection, Disposal, Sanitary landfill
Cite this paper: Endalu Lemma, Habtom Tekilu, Characterization and Disposal of Municipal Solid Waste, Case Study, Hosanna Town, American Journal of Environmental Engineering, Vol. 4 No. 6, 2014, pp. 162-168. doi: 10.5923/j.ajee.20140406.04.
1. Introduction
Solid waste disposal (SWD) is an integral and final part of the solid waste management (SWM) process that targets discards solid wastes (SW) which are by-products of human and animal activities. Municipal solid waste management depends on both the characteristics of the site and the characteristics of the MSW itself: gross composition, moisture content, particle size, chemical composition, and density. Gross composition may be the most important characteristic affecting MSW disposal, or the recovery of materials and energy from refuse [1]. Accurate data, concerning estimates of present and future production and composition of different type of waste, is essential for long term efficient and economical waste management planning. Accurate waste arising data are also required to meet regional and national legal and policy obligation. Until now, in Hosanna, there were no data recorded, both on composition and on quantity of waste, poor handling and poor application of engineering based technologies, which were crucial for proper management of solid wastes.Hosanna municipality has not yet develops its centre of hierarchy, there were no technology based waste management, and no specific basis of strategy to encourage movement up the hierarchy and there-by no incremental levels of waste reduction, re-use and recycling.Therefore, compilation of accurate data on characterization of waste is an important element for development of specific strategy and ultimate disposal.
2. Materials and Methodology
2.1. Materials
1) Moveable balancing/Bouquet2) Waste collecting materials
2.2. Methodology
1) Sampling method: Strata Sampling 2) Door to door data collection by using questionnaire survey (weighing waste by portable scale, kg)3) Weighing plastic bag and plastic bottle on lab scale 4) Waste composition estimation by direct waste analysis and questionnaire survey5) Total waste arising estimation by arithmetic average of the data/sample mean6) Empirical formulas-through observation and calculation, development 7) Primary design calculation and sitting.
2.2.1. Data Collection
Data is collected door to door through out the comminty in each ‘kebeles’. Waste composition and quantity is estimated by mixed questionnaires survey and direct waste analysis method at selected sample source basis/generator. To mitigate against possible errors in estimating, a dual approach to collection of data is recommended, by estimating waste arising from the source and also from the waste management facilities which receive the waste [2]. In this paper, the first method was applied. Waste generation is measured at source basis/generator by using protable scales. Data collection on waste characterization and composition were carried out on the April and since every truckload cannot be weighed, statistacal methods was used to estimate the total quantity from sample generator.
3. Solid Waste Generated and It’s Characteristic’s
3.1. Estimating Waste Arising
Statistical data on the quantification of waste are usually by weight, although sometimes it may be more appropriate to report the data as volume [3]. Analysis of the composition of waste may also be based on the source of the waste; for example household waste might be analyzed in terms of material types, such as garbage, ‘chat’ stalk, plastic, glass, paper or by-product types, such as, glass containers, tins, magazines, etc. A large number of samples are taken for statistical accuracy. However, for a large waste source population, like household, this may not be possible and therefore representative samples, with their consequent errors, are used.
3.1.1. Waste arising by ‘kebeles’
Sample mean were applied for the estimation of amount of MSW generated in kg in each ‘kebeles’ from the sample observed.  | (1) |
Where Sample means (kg/generator/day)
 amount of waste generated, in type, from each generator.n= number of sample (generator) takenTotal amount of MSW generated in each ‘kebeles’ is calculated by using the mathematical relation (Eq. 2):
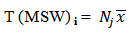 | (2) |
Where i = waste type. T (MSW) i = Total “i” MSW generated from each ‘kebeles’j = generator  total number of “j” generator in each ‘kebeles’.It has been estimated that 11 million of kilograms of waste are generated per year throughout the town, based on data collected and analyzed from each ‘kebeles’. Garbage (food, garden), plastic, ‘chat’ stalk, ‘enset’/false banana, paper and glass are the main categories of waste generated. Garbage waste is the largest single categories of waste generated. Figure.1 shows the total waste arising in kilogram per day in the town through each ‘kebeles’ and Fig. 2 shows the distribution of generation per capita per year.
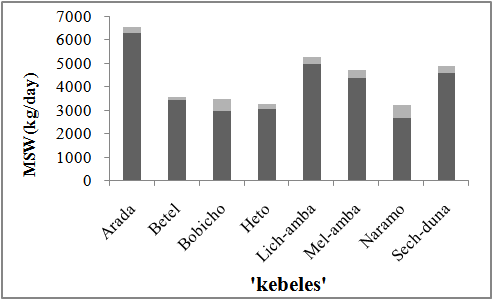 | Figure 1. Total waste generated in kg/day in each ‘kebeles’ |
 | Figure 2. MSW generated per capita (kg/person. yr) in each ‘kebeles’ |
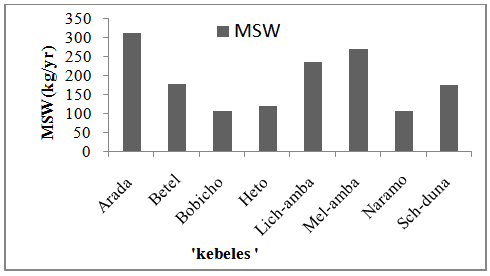
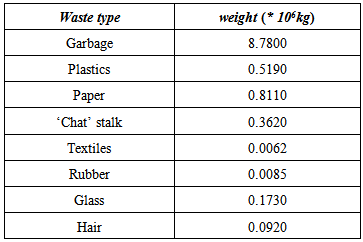
Difficulties arise in direct comparison of waste generation data due to different classification system. For example, in some ‘kebele’ (society) total waste includes materials, which, in other society, are not defined as waste at all. Table 1 shows waste composition estimates by both mixed direct waste analysis and survey questionnaire. Table 1. Waste Composition Estimates by Direct Waste Analysis and Survey Questionnaire (weight %), Hosanna Town
 |
| |
|
The waste data from the producers of the waste should be matched against the waste received at the waste treatment and disposal facilities, to ensure accuracy of the survey data.
3.2. Waste Generation Multipliers
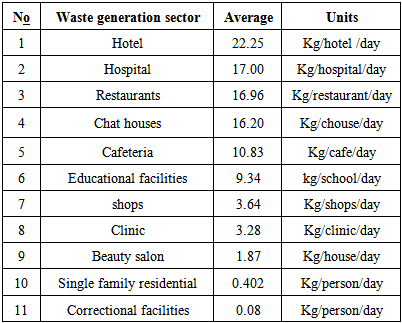
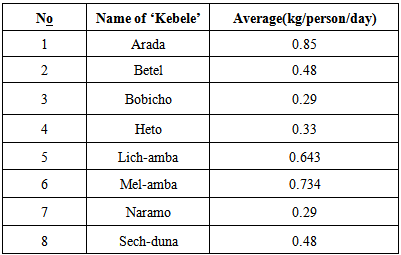
Waste generation multipliers are used for estimating waste from all the generation sources of waste, in the region and calculated by rate of generation per generator. Table 2 and Table 3 shows Hosanna waste generation rates by type of generator and size of population in each ‘kebeles’ respectively.Table 2. Typical Hosanna MSW Generation Rates by type of Generator
 |
| |
|
Table 3. Typical Hosanna MSW Generation Rates based on Population Size, in each ‘Kebele’
 |
| |
|
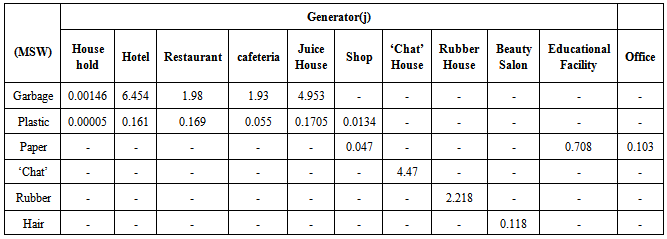
The above waste generation multipliers (Table 2 and Table 3) only tell us the total waste generation rate from the generator and did not indicate generation multipliers of each waste composition from specific generator/basis. Amount of waste generated, in type, from specific generator are depend on the population dynamics, generator size, family size, economic level, seasonal variation, etc .... In turn, this affects the generation multipliers of each MSW generated from specific generator. The generation multipliers of each waste from specific generator can be calculated from average mean of waste generated and total number generator dwells in each ‘kebeles’ by the following empirical means – that is gained by observation: | (3) |
Where  average sample mean of ‘i’ type of waste generated from ‘j’ generator
  waste generation multipliers constant of ‘i’ type of waste generated from ‘j’ generator.Nj = total number of ‘j’ generator Waste generation multipliers constant,
  for each type of waste generated from specific generator can be calculated from mathematical relation (Eq.3). Based on data collected from each generator dwells in each ‘kebeles’ and analyzed, the value of
  for each type of waste from specific generator was calculated. Representative sample data collected in each ‘kebeles’ and the sample mean of this value used as the bases for the calculation and the value listed in Table 4.
Table 4. Typical Hosanna Waste Generation Multipliers (kij)
 |
| |
|
3.3. Waste Generation Estimation by Empirical Means
Data collection:To estimate specific amount of waste generated, in type, and to estimate rate of variation of composition it is necessary to estimate the rate at which the generator generate waste within the time interval. Extensive data collection is carried out through each generator and analysis where was carried out to calculate waste generated during time interval for how long and what type of?Based on studies carried out, the empirical formula(Eq.4) has been developed to calculate the change in composition of waste with time and amount of municipal solid waste generated during time interval of t, for the required cycle (weekly, monthly, semiannually, and annually).The conversion factor for the different type of generator was calculated by using the following equation: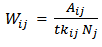 | (4) |
Where conversion factor/rate of “i” MSW generated from “j” generator during time t.
 rate of generation of “i” MSW generated from “j” generator during time t
 For how long (days) “j” generator generates “i” MSWi = type of waste/MSW j = generator Time t may be the duration for how long data was collected to know
  from the sample generator, and
  The conversion factor,
  tells as the rate of variation/change of composition of waste with time. The changes of percent composition of waste with time can be estimated and calculated as:% composition of ‘i’ type of MSW generated from ‘j’ generator (at time T)
  Where:
 total amount (kg) MSW generated from ‘j’ generator at time T.T= total time (in days) MSW generated for specified cycle.Total amount of ‘i’ type of municipal solid waste generated from specific ‘j’ generator during the required cycle can be calculated by:
 | (5) |
3.4. Waste Composition
The main compositional categories of typical Hosanna municipal solid waste are garbage (food, garden waste), paper, plastics, glass, textiles, and ‘chat’ stalk. Figure 5 show the percent distribution of the different categories of waste generated in the town. 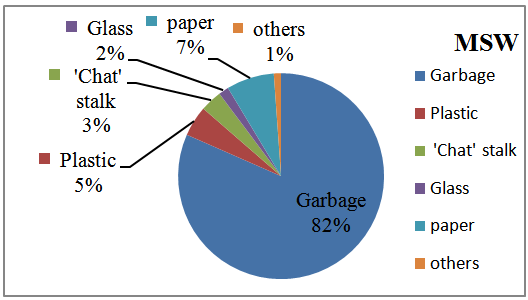 | Figure 3. Percent (wt %) distribution of MSW composition generated |
3.5. Waste Generation Prediction
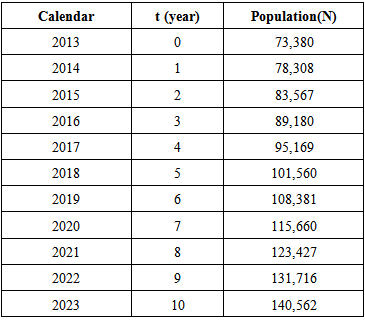
Waste is predicted based on the per capita solid waste generated were constant and population of the town growth exponentially. The rate of population growth at any given time can be written: | (6) |
Where:No = the starting populationN = the population after a certain time, t, has elapsedr = the rate of natural increases expressed as a percentage [birth rate (b) – death rate (d)]e = the constant 2.71828… (base of natural logarithms)The average birth rate and all age death rate in Urban - Hadiya zone, both sexes is 0.077 and 0.012 respectively [4]. Number of population from conventional units in Hosanna town is 73,380 [5]. Population growth rate is calculated for ten years (up to 2023) by using Eq.(6), assuming that birth rate and death rate is constant over the ten years.Table 5. Population Growth (projection) of the Town from conventional units
 |
| |
|
Rate of municipal solid waste (MSW) generated per person from conventional units is 0.41kg/capita. day (0.41 kg/person. days). Figure 4 shows total quantity of MSW generated over ten years (up to 2023) by Hosanna dwellers, assuming that both generation of waste and population dynamics were constant over the coming ten years.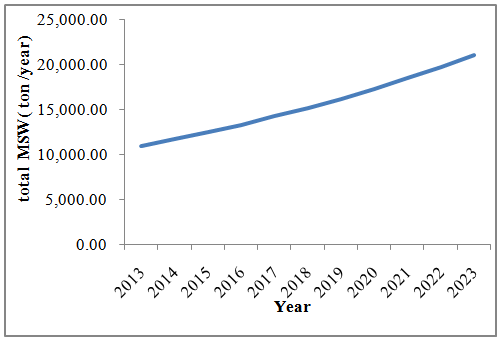 | Figure 4. Total quantity of MSW generated by Hosanna town dwellers (up to 2023) |
Note: Waste generation over ten years may not be constant due to change in social composition and life style. However, we assume that this generation rate is constant because of lack of data recorded both on composition and quantities of waste generated at least for the past ten years.As we can see from above figure, the plot shows as, the amount of MSW generated per capita per year is increasing, as time elapsed, as population growth increases exponentially. This prediction forecasted based on the waste generated by 2013, which was a constant (0.41kg/capita .day). But this generation rate might not be constant for the coming ten years and might be varies from year to year. Assumptions:Case1: Assuming that this generation rate per person per year is a constant (0.41kg/capita. day) over the coming ten years, like we have been assumed in the above prediction (Fig.4); then we calculate total amount of MSW generated per year over the coming ten years.Case2: Assuming that the generation rate is constant over each year, but varies from year to year; then we calculate total amount of MSW generated per year. Total amount of MSW generated per capita per year can be expressed by mathematical relationship: | (7) |
Where: total amount of MSW generated per year (kg/year)
  total number of generator dwells the townx = amount of MSW generated in kilogram per capita per yearTotal number of generator
  varies from year to year, due to population dynamics. Mathematical expression:
 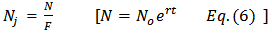 | (8) |
 | (9) |
Then, A can be calculated as follows: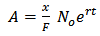 | (10) |
 | (11) |
Where
 The values of A and
  can be calculated through successive iteration by using Eq. (11). The iteration steps proceed as follows:1.
  can be calculated assuming that
  and r remains constant as time t elapsed.2. A can be calculated by using the values of
  where
where and r remains constant as time t elapsed.As we can see from Fig.5, there is a variation in amount of waste generated in above case one and case two, although it is significant. This variation might be due to inconsideration of factors which affect both the amount and composition of waste generated per person per capita.
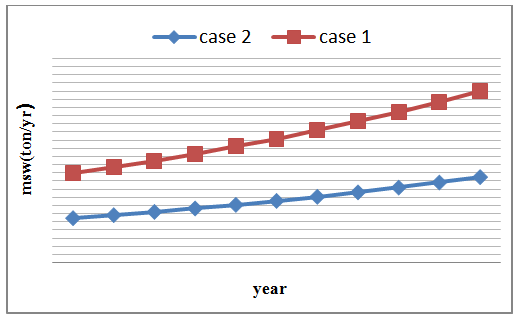 | Figure 5. Amount of MSW Generated in Assumption/Case1 and Case2 |
Figure 5 also tells us, rate of generation of waste per capita per year will not be constant over the coming ten years, and there will be rate of generation variation year to year. Rate of generation varying less for the first five years, and we can suggest that our first assumptions may be work for short period of time.
3.6. Disposal
Hosanna town has a population of 73,380 with an aerial extent of 38.66km2; produce MSW of 30.14 tons per day. The entire town with eight ‘kebeles’ is divided into three sub cities namely Addis city, Sech-duna, and Kofer-meda. The un-segregated MSW collected (16.8%) in different Sub city is being dumped on open places. At present, the entire town has less collection efficiency, and there are no conversion techniques used and the number of dumping sites in the town is one. The wastes are collected through open body single trucks, and are dumped on the recognized open dumping sites, i.e. unsanitary landfill, located nearby the town, at a distance of 5km. This site has a lot of problem in respect to sitting criteria, especially concerning to surrounding ecosystem. Topography of this site is not suitable for the disposal and thereby no barrier between this site and the surroundings. In addition to this, un-acceptance by nearby community due to bad odor and fear of scavengers elevates the sitting problem. Nearby residential has feared of attacked by scavengers, which was a dependent on waste for food. Refuse composition expressed either “as generated” or “as disposed,” since moisture transfer takes place during the disposal process and there by changes the weights of the various fractions of refuse. Table 6 shows typical components of average Hosanna refuseTable 6. Average Annual Composition of MSW in Hosanna as generated
 |
| |
|
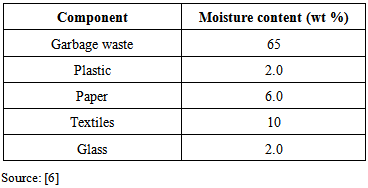
Table 7. Typical Moisture Content
 |
| |
|
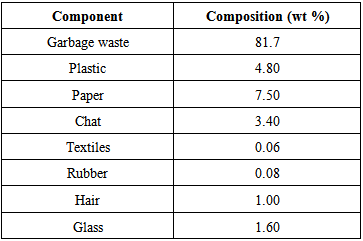
Table 8 shows composition in percentage weight of municipal solid waste of Hosanna townTable 8. Composition of MSW, Hosanna Town, Ethiopia
 |
| |
|
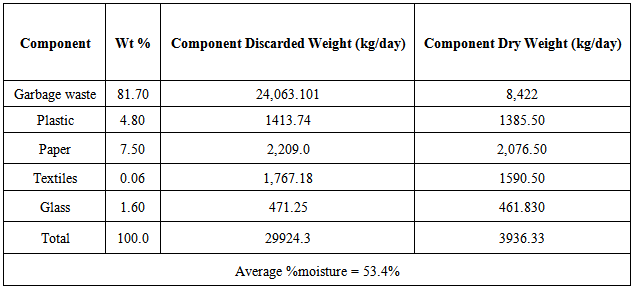
Based on the percentage of moisture content data provided on Table 7, and waste composition data, and total waste weight, Table 9 summarize the result for each waste component and average moisture content of the refuse.Table 9. Composition, Weight Percent, Component Discarded Weight, and Component Dry Weight for the Municipal Solid Waste from Hosanna Town, Ethiopia
 |
| |
|
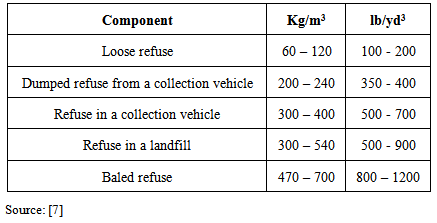
1) Design Calculation:The density of MSW varies depending up on location, season, humidity, and so on. Table 10 shows some typical of municipal solid waste densities, with might not be the same to Hosanna municipal solid waste densities. However, due to the lack of data recorded on densities of Hosanna refuse, we use this density of refuse for the calculation of primary area required for the disposal, sanitary landfill, which was good start for primary design. Table 10. Some Typical MSW Densities
 |
| |
|
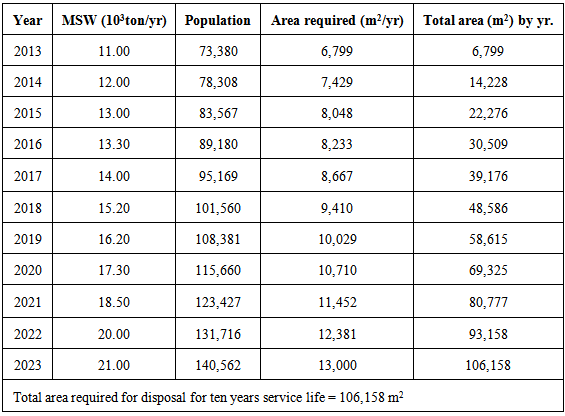
2) Required landfill Area:The required landfill area for Hosanna is calculated, from MSW generation rate on year basis, density of refuse in landfill, volume required and waste depth of compacted MSW.Table 11. Sanitary Landfill Area required for each Year and for Ten-year Service Life with an Allowance of 30% Employed
 |
| |
|
Density of refuse in a landfill, on an average is 420 kg/m3 (Table 10) and waste depth of compacted MSW = 5m (landfill sites with waste depths exceeding 5m tend to develop anaerobic conditions and greater quantities of landfill gas) [7].1. MSW generation = 0.41kg/capita. day2. Generation rate = 30,085.8 kg/day3. Volume required/day =  = 71.63m3/day4. Area required/yr = (71.63m3/day)*(365day/yr)/ (5m) = 5,230m2/yr5. Area required/day = 71.63m3/5m = 14.33m2/dayWith an allowance of 30% [8] is employed, area requirement becomes: 18.63m2/day and 6,799m2/yr.
4. Conclusions
Organic matter constitutes 92.5% of the municipal solid waste generated in Hosanna. Out of which ‘chat’ stalk constitute 3%, which cause major problem in logging the drainage and tipping additional pollution. The majority of wastes generated in Hosanna are left uncollected on the street, which is 83.2% and only the rest of these is collected and transported to open dumped disposal i.e. unsanitary landfill. The great majority of waste generated in Hosanna is mainly of domestic origin consisting of mostly garbage waste (food, garden waste), 82%, and other organic matter, 10.5%, which is easily degradable and relatively very low concentration of toxic materials. The generations will be twenty-one million of kilograms after ten years (by 2023), and an area 106,158m2 of sanitary landfill with service life of ten year is required for the disposal. Consequently, there is less of a need for an area of a sophisticated landfill, liner system of the type required for the waste generated from industrialized countries.
ACKNOWLEDGMENTS
We would like to say a lot of thanks to Hosanna Municipality, Sanitation and Beautification Office and to Mr. Tadesse Erso, Head of Sanitation and Beautification, Hosanna Municipal, for their joy-full devotion to successfully accomplishments of this paper. In addition, we like to say thanks to members of Wachemo University for their un-divided attention to this paper.
References
| [1] | Ruth F.Weiner and Robin A.Matthews, Updated edition of Environmental Engineering, previosly by J.Jeffrey Peirce and P. Aarne Vesilind, Environmental Engineering, 4th Ed. Butterworth-Heinemann:Elsevier Science, USA, pp.251-292, 2003. |
| [2] | Paul T. Williams, Waste Treatment and Disposal, 2nd Ed. The University of Leeds, UK: John Wiley and Sons Ltd, England, pp.62-126, 2005. |
| [3] | Paul T. Williams, Waste Treatment and Disposal, 2nd Ed. The University of Leeds, UK: John Wiley and Sons Ltd, England, pp. 62-126, 2005. |
| [4] | EFDR Central Statistical Agency. The 2007 population and housing census of Ethiopia results for SNNPR part III statistical report on population dynamics, Addis Ababa: Berhan and Selam printing press, Ethiopia, pp.112-119, 2010. |
| [5] | Addis City, Gofer-Meda, and Sech-duna Sub city Administration, Hosanna. Unpublished. 2013. |
| [6] | Joseph P. Reynolds, John S. Jeris, Louis Theodore, Hand Book of Chemical and Environmental Engineering Calculations, New York: A John Wiley and Sons, Inc., publication. |
| [7] | Ruth F.Weiner and Robin A.Matthews, Updated edition of Enviromnetal Engineering, previosly by J.Jeffrey Peirce and P. Aame Vesilind, Environmental engineering, 4th Ed. Butterworth-Heinemann: Elsevier Science, USA, pp.251-292, 2003. |
| [8] | Joseph P. Reynolds, John S. Jeris, Louis Theodore, Hand Book of Chemical and Environmental Engineering Calculations, New York: A John Wiley and Sons, Inc., publication |
| [9] | Paul T. Williams, Waste Treatment and Disposal, 2nd Ed. The University of Leeds, UK: John Wiley and Sons Ltd, England, pp.62-126, 2005. |
| [10] | Waste Framework Directive. Council Directive 75/442/EEC, OJL 194, 25.7.75, 1975. |
| [11] | Laurence D. Waste Regulation Law. Butterworth’s, London, 1999. |
| [12] | H.R. Sharma, Temesgen Abebe, Mengesha Admassu, Tadele Teshaye, Tadiwos Aseffa, Mustofa Emana, Municipal Solid Waste Management and Community awareness and involvement in management practice: an overview and a case study from Gondar town of Ethiopia, Inder Science publishers., Int. J. of Environmental and Waste Management., Vol.7, No3/4, pp. 294-304, 2011. |
| [13] | Diaz L.F. and Savage G.M. Developing Landfill. Waste Management World, International Solid Waste Association, Copenhagen, July-August, 2000. |
| [14] | Tchobanoglous G. and O’Leary P.R., Land filling, Handbook of Solid Waste Management, Kreith F. (Ed.). McGraw-Hill, Inc., New York, 1994. |
| [15] | Waste Management Planning. Principle and Practice. Department of the Environment, HMSO, 1995. |
| [16] | Yu C.-C. and Mclaren V.1995. Waste Management and Research, 13,343-361 |
| [17] | Kapil. P. Devang. Application of LCA approach to Evaluate Municipal Solid Waste Management options, Unpublished M.E. thesis, National Institute of Technology, Nagpur, India, 2006. |
| [18] | Dr. Kaliannan S. Model development on disposal of municipal solid waste through experimental studies. Modern Applied Science, 3, No 4: 182-190, 2009. |
 Abstract
 Reference
 Full-Text PDF
 Full-text HTML