-
Paper Information
- Paper Submission
-
Journal Information
- About This Journal
- Editorial Board
- Current Issue
- Archive
- Author Guidelines
- Contact Us
American Journal of Environmental Engineering
p-ISSN: 2166-4633 e-ISSN: 2166-465X
2014; 4(4): 80-83
doi:10.5923/j.ajee.20140404.03
Survey of Nitrate and Nitrite in Ground Water Sources of Shahre-kord, Iran
 Abstract
 Reference
 Full-Text PDF
 Full-text HTML
Abdolmajid Fadaei, Akram Najafi
Department of Environmental Health Engineering, School of Health, Shahrekord University of Medical Sciences, Shahrekord, 8813834435, Iran
Correspondence to: Abdolmajid Fadaei, Department of Environmental Health Engineering, School of Health, Shahrekord University of Medical Sciences, Shahrekord, 8813834435, Iran.
| Email: |  |
Copyright © 2014 Scientific & Academic Publishing. All Rights Reserved.
The aim of this study is surveyof nitrate and nitrite in ground water sources of Shahre-kord,Iran. 529water samples from ground water of Shahre-kord small province were randomly collected from 15 areas over a period of five years during all of the seasons. Nitrate and nitrite ions were analyzed by Spectrophotometer 2100 UV-Vis, at 549 and410 nm. The mean and standard deviation (5 years) of nitrite and nitrate content in groundwater samples were 0.016±0.015 to 0.048±0.030 mg/L and 9.78±4.1 to 46.12±13.63mg/L, respectively. It was concluded that nitrate contents in ground water sources for drinking water supply in Shahre-kord small province can be higher than standard level in some areas. The monitoring of water quality is one of the important tools for water resources control management.
Keywords: Ground Water, Nitrate, Nitrite
Cite this paper: Abdolmajid Fadaei, Akram Najafi, Survey of Nitrate and Nitrite in Ground Water Sources of Shahre-kord, Iran, American Journal of Environmental Engineering, Vol. 4 No. 4, 2014, pp. 80-83. doi: 10.5923/j.ajee.20140404.03.
Article Outline
1. Introduction
- Nitrate and nitrite are the most common chemical contaminant in the world’s groundwater aquifers. Nitrate is a colorless, odorless, and tasteless compound that is present in some groundwater in Iran. Nitrate is present widespread in the environment and the major sources of nitrate pollution in both developed and developing countries is crop fertilization (Gatseva et al., 2008).Common sources of nitrate include: Fertilizers and manure, animal feedlots, wastewater-disposal, industrial waste, and food processing waste, septic systems, and N-fixation from atmosphere by legumes, bacteria and lightning (Smith et al., 2005). Nitrate and nitrite have some hazards for human. Most important environmental problems caused by nitrate are eutrophication in water supplies and infectious disease (Loganathan et al., 2013) Toxic nitrate has a negative effect on the human's health, which could result in many diseases, such as birth defects, spontaneous abortion, increased infant mortality, diarrhea, abdominal pain, vomiting, diabetes, hypertension, respiratory tract infections, changes in the immune system, and methemoglobinemia (Azizullah et al., 2011; Ward et al ., 2011).The aim of the present study was thus to determine the concentrations of nitrate and nitrite in ground water sources of Shahre-kord small province, Iran and to compare the nitrate and nitrite contents with standards levels because there is no whole information available on nitrate and nitrate in ground water sources.
2. Materials and Methods
2.1. Study Area
- Charharmahal and Bakhtiari is one of the 30 provinces of Iran in the west south. The province of Charharmahal and Bakhtiari covers an area of 16,403 km² and it has a population of approximately 857,910 people. The Province Charharmahal and Bakhtiari has 6 small provinces.The major cities of Shahre-kord small province are Shahre-kord, Saman, Ben, Sureshjan, Hafshejan, Shahrekian, Shalamzar, Farrokhshahr, Gahru, Taqanak, Nafch, Sudejan, Chaleshtar, Mahdieh and Eshkaftak.
2.2. Sampling
- A total of 529 water samples from ground water of Shahre-kord small province were randomly collected from 15 areas (Shahre-kord, Saman, Ben, Sureshjan, Hafshejan, Shahrekian, Shalamzar, Farrokhshahr, Gahru, Taqanak, Nafch, Sudejan, Chaleshtar, Mahdieh and Eshkaftak) over a period of five years during all of the seasons. In this study, several samples were taken from the water resources (wells) and the city’s drinking water distribution network system (tap water) and in different months. All samples were collected in 500 ml polythene bottles and carried to the laboratory. Water samples were stored in 500 ml polythene bottles for up to 24 hours at 4ºC. Acidification with 1N HCl is designed to prevent interference from hydroxide or carbonate concentrations up to 1000mg CaCO3/L.
2.3. Analytical Measurements
- Nitrate and nitrite were measured using a Spectrophotometer 2100 UV-Vis, at 549 and 410 nm according to the standard methods for the examination of water and wastewater (APHA, AWWA, WPCF 1992). The SPSS software was used for statistical analysis with a significance determined at p<0.05.
3. Results and Discussion
3.1. Nitrate Concentration in Water Sources
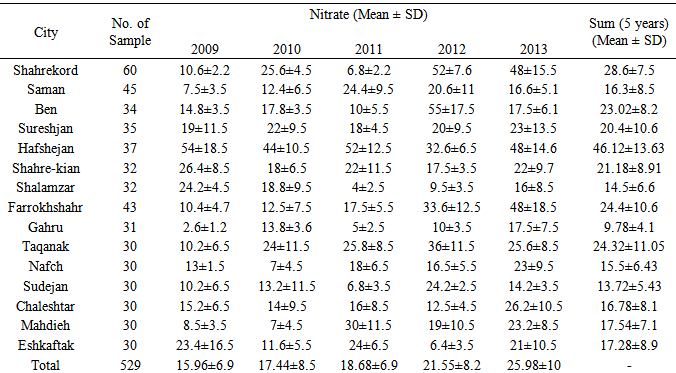
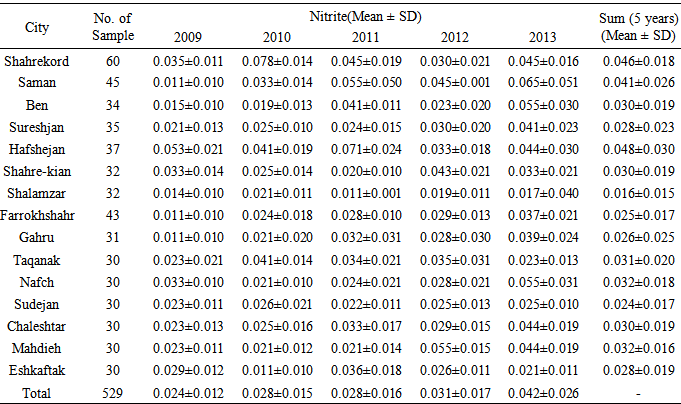
- Nitrate and nitrite concentrations obtained from this study are summarized in table 1 and 2. Water samples from Hafshejan city had high content of nitrate and nitrite. The highest content of nitrate was showed 80.5 mg L-1 in two samples in 2009 year. Also, nitrate content was low in water samples of Gahru city. Among the most collected water samples, Hafshejan city contained more nitrite about 0.071 mg/L, whereas the Shalamzar city contained lower nitrite about 0.001 mg/L. The mean and standard deviation (5 years) of nitrate content in groundwater samples were 28.6±7.5, 16.3±8.5, 23.02±8.2, 20.4±10.6, 46.12±13.63, 21.18±8.91, 14.5±6.6, 24.4±10.6, 9.78±4.1, 24.32±11.05, 15.5±6.43, 13.72±5.43, 16.78±8.1, 17.54±7.1, 17.28±8.9 mg/L for Shahre-kord, Saman, Ben, Sureshjan, Hafshejan, Shahrekian, Shalamzar, Farrokhshahr, Gahru, Taqanak, Nafch, Sudejan, Chaleshtar, Mahdieh and Eshkaftak, respectively.
|
|
3.2. Nitrite Concentration in Water Sources
- The mean and standard deviation (5 years) of nitrite content in groundwater samples were 0.046±0.018, 0.041±0.026, 0.030±0.019, 0.028±0.023, 0.048±0.030, 0.030±0.019, 0.016±0.015, 0.025±0.017, 0.026±0.025, 0.031±0.020, 0.032±0.018, 0.024±0.017, 0.030±0.019, 0.032±0.016, 0.028±0.019 mg/L for Shahre-kord, Saman, Ben, Sureshjan, Hafshejan, Shahrekian, Shalamzar, Farrokhshahr, Gahru, Taqanak, Nafch, Sudejan, Chaleshtar, Mahdieh and Eshkaftak, respectively. In general, the results obtained for the nitrate and nitrite indicate that the 15 areas are within the limits allowed by Iran and WHO Standard, It was concluded that nitrate contents in ground water sources for drinking water supply in Shahre-kord small province can be higher than standard level in some areas. The major sources of nitrate pollution in this research include: Application of nitrogen-rich fertilizers (ammonium- or nitrate-based) on farms is the main source of nitrate pollution and wells located in these areas are highly susceptible to nitrate contamination. Natural decomposition of organic compound an also result in the release of nitrate in soils, animal matter, domestic and industrial effluents. Irrigation activities can also increase leaching rates of nitrates (Agwu et al., 2013). In a survey of groundwater supplies in British Columbia Of over 12,000 samples analysed for nitrate-nitrogen concentration, 186or 1.5% had nitrate-nitrogen levels above the WHO drinking water guideline of 50 mg/L, and 7% of samples had concentrations of nitrate-nitrogen greater than or equal to 3 mg/L (Tredoux et al., 2009). In another survey in China concentrations of nitrate (NO3−) in groundwater in the study area varied from 50 to 130 mg/L (Tang et al., 2004). Also, in a survey of groundwater supplies in Osona, NE Spain, mean nitrate concentration ranged from 8 to 391 mg/L (Boy-Roura et al., 2013). In a survey of groundwater supplies in Nigeria nitrate recorded a mean value of 0.307mg/l. Min 0.004mg/l and Max is 1mg/L. The standard deviation is 0.433 these values are within the acceptable limits for drinking water. Normally, nitrate pollution is associated with septic systems and agricultural activity (Gordon et al., 2012). In a survey of drinking water in Golestan province, Iran concentrations of mean nitrite from 0.013±0.003 to 0.021±0.01 mg/Land nitrate from10.4±2.41 to 21.8±9.8 mg/L (Semnani et al., 2009). Jalali (2011) reported that nitrate in 95 groundwater samples of Toyserkan city, Hamedan Province, Iran have minimum, maximum and average 1 mg/L and 162 mg/L and 30 mg/L, respectively (Jalali, 2011).
4. Conclusions
- In present study, nitrite and nitrate levels in municipal water supplies of Shahre-kord small province are generally less than standard levels (3, 50 mg/L).It is suggested that agricultural best management practices such as water-saving irrigation and split application of N fertilizer should be adopted to protect the groundwater quality from N pollution. Avoid the spreading of waste on the surface of the ground; Make periodic analyzes of the level of nitrate and nitrite of the site. All drinking water sources should be tested at least every one or two years to assure that considerable growth in nitrate and nitrite are not occurring. Increasing public awareness about nitrite and nitrate contamination can help to improve public participation in water resources protection activity. Wastewater disposal is other source of groundwater pollution. Current septic system needs to be replaced with a sewer system to collect municipal and industrial wastewaters. Four methods such as ion exchange, reverse osmosis, chemical precipitation, and electrocoagulation are can be applied for removing nitrate from drinking water.
ACKNOWLEDGEMENTS
- This research has been supported by Shahrekord University of Medical Sciences.