El Sergany F. A. R. 1, El Fadly M. 2, El Nadi M. H. A. 3
1Associate Professor of Sanitary Eng., Civil Eng. Dept., Higher Technological Institute, 10th of Ramadan, Egypt
2Lecturer, Public authority of education and training, Kuwait
3Professor of Sanitary Eng., Public Works Dept., Faculty of Eng., ASU, Cairo, Egypt
Correspondence to: El Sergany F. A. R. , Associate Professor of Sanitary Eng., Civil Eng. Dept., Higher Technological Institute, 10th of Ramadan, Egypt.
| Email: |  |
Copyright © 2014 Scientific & Academic Publishing. All Rights Reserved.
Abstract
This study aims to study the suitability of using algae for brine water disposed from desalination as a new conceptual technique using algae ponds under the nature circumstances. A pilot unit consisted three parallel basins was erected outdoor in open area to be under natural climatic conditions. The algae were prepared in the lab using BG11 media to encourage its growth under saline water then put in the basins with 0.4 mg/lit/basin/run for algae rate and 0.1 lit/basin/run for BG11 rate. The basins had several concentrations of saline water from 80000 ppm up to 40000 ppm with several runs to get the TDS removal efficiency. The experimental work shows that the removal efficiency for TDS varied between 13 & 63 %. These variations were due to inlet TDS concentration, retention time in the basin and the climatic conditions (Temperature & sunlight period). The results achieved high removal efficiency for TDS and the results in the highest inlet concentration was inside the permissible limits for safe disposal to the sea.
Keywords:
Brine of Water Desalination, Biological desalination, Algae growth, Algae Ponds
Cite this paper: El Sergany F. A. R. , El Fadly M. , El Nadi M. H. A. , Brine Desalination by Using Algae Ponds Under Nature Conditions, American Journal of Environmental Engineering, Vol. 4 No. 4, 2014, pp. 75-79. doi: 10.5923/j.ajee.20140404.02.
1. Introduction
Several researches applied using several microorganisms to remove salts from water. Some artificial bacteria, which are still under research, were used for water desalination 3 years ago. In addition, researches from 5 years ago started application of some algae species under research manner to desalinate seawater with successful promising results.Algae are simple plants without roots, stems, and leaves, which contain chlorophyll. They are a heterogeneous group of organisms and vary in size from microscopic unicellular forms to seaweeds of many feet in length with many different shapes. Algae can grow in water, whether it is saline water in seas or fresh water in rivers and lakes and under different weathers from snow weather to hot climatic. They can grow wherever they could synthesize their components and food by photosynthesis [1].Scendesmus species growth successfully occurred in saline water as it absorbs salts and makes use of them in its metabolism. Chlorella and Scenedesmus are the most active Algae in stabilization ponds, because they can survive and commonly exhibit extremely wide range of salt tolerance in their habitat [2].Micro-algae have a high capacity for inorganic nutrient uptake and can survive and grow in mass culture in outdoor solar bioreactors. Unicellular green algae such as Chlorella and Scendesmus have been widely used in wastewater treatment because they often colonize the ponds naturally, and they have fast growth rates and high nutrient uptake capabilities. However, one of the major drawbacks of using micro-algae in wastewater treatment is the harvesting of biomass [3].Green algae was used for treatment of industrial waste water from natural gas production fields of 1500 m3 daily flow, which contains salinity up to 25000 ppm and oil content up to 100 ppm. The effluent could be re-used in irrigation of crops with a flow enough for about 60 fed./day. While the produced algae 1.5 ton/day was useful as a by-product for usage in medical industry, pigments for industry, functional food, bio-fertilizers, and animal or fish fodders [4]. Another algae application in stabilization ponds for industrial wastewater treatment of high salinity and oil content occurred through a pilot plant, which located in the site of N/D field in Abu-Mady north of Egypt. Several runs were made to ensure the results. The influent loads varied between 35000 & 10900 ppm for TDS, 250 & 65 ppm for Oil, 212 & 59ppm for BOD & 344 & 88ppm for COD. The effluent concentrations after 7 days retention time in the pond were ranged between 2750 & 2120 ppm for TDS, 2 & 0.5ppm for Oil, 7,4 ppm for BOD & 16 & 12 ppm for COD. These removal efficiencies proved the suitability of algae application for saline industrial wastewater treatment [5].Desalination based on the use of algae in the removal of salts from saline water, and water production for use in different purposes is a new concept and it has been used and tested in previous researches in industrial wastewater treatment. The researches stated that using the algae reduced the cost to the minimum while maintained the efficiency with no reduction. The achieved results were promising and good in the desalination of seawater and were successful. Continuing the process made the removal efficiency reach up to 95% until the rates are relatively affordable for possible use in different purposes. This opens the door to a new direction that may succeed in solving the problem of water desalination with cost reduction to the minimum possible [6].A study was made to assess the removal efficiencies of different nutrients in saline water by the means of the green algae Scenedesmus species. Total dissolved solids, Sodium, Chloride, and Phosphate removal efficiencies measured in the output of the reactor after 14 days reached around 97%. While the removal efficiencies of both Nitrate and Sulfate reached around 93% and all the parameters in the effluent were inside the permissible limits for potable water except the appear of some enzymes due to algae decay. This shows the success of this system to produce suitable potable water from seawater [7].In March 2011, another study was made. The objective of this study was to assess the removal efficiencies of different nutrients in saline water by the means of the green algae Scenedesmus species through a continuous flow treatment system. The saline water used was from Red Sea, Ismailia Governorate, and had a TDS of 40000 ppm. Algae were added to two consecutive reactors for a retention time of 7 days for each reactor. The consecutive 7 days retention time for each reactor helped preventing the enzymes formations in the basins. The experiment in the continuous flow was repeated for 4 runs and the average values were taken into consideration. Analysis of growth media was daily determined. Total dissolved solids, Sodium, Chloride, and Phosphate removal efficiencies measured in the output of the second reactor reached around 97%. Moreover, the removal efficiencies of both Nitrate and Sulfate reached around 93% [8, 9].
2. Materials & Methods
A new system for decreasing the high salinity of brine water disposed from the desalination plants before its disposal to the sea was applied by using Algae for a natural, environment friendly and economic solution. The Scendesmus algae species was the choice for operation process, thanks to its natural feature of growing very well in almost any mineral medium. The application was successfully worked under suitable conditions inside the lab as illustrated by El Nadi [5, 6, 9], El Sergany [5, 6], Saad [7] & Badawy [8]. In this study, the system was built outside the lab to meet the normal nature conditions.The pilot plant located in open-air area in the environmental pilots Lab in Ain Shams university engineering faculty. The pilot plant consists of three storage tanks, three basins and it was equipped with manual algae separators units. Figure (1) illustrates the pilot photo.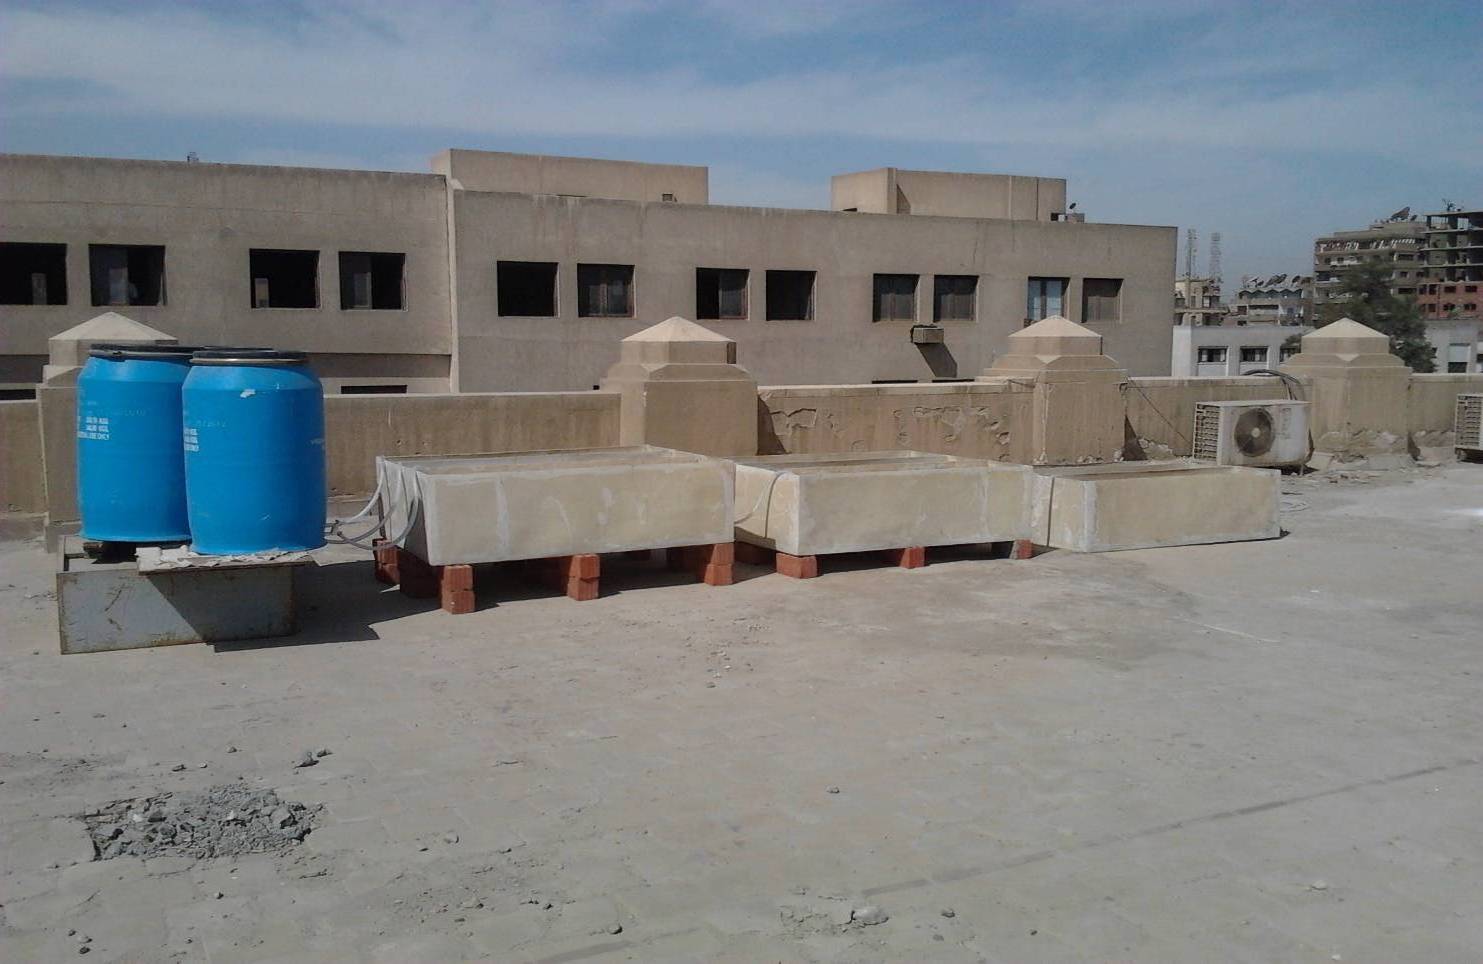 | Figure 1. Photo of the applied Pilot for algae Ponds |
The pilot plant operated from August 2013 until November 2013 to obtain the system suitability under variable climatic conditions. It consisted of three runs, each with three different TDS concentrations for the three basins. Several concentrations of artificial saline water 80000, 75000, 70000, 65000, 60000, 55000, 50000, 45000 & 40000 ppm were applied three in each run. The feeding media for algae BG-11 solution was added to give algae enough nutrition with rate 0.1 lit/basin/run. Scendesmus algae were added by rate 0.4 lit/basin/run to treat the saline water for a retention time up to 7 days in each basin. Desalinated water came out as the effluent of the basin. Table (1) shows the chemical composition of BG-11 nutrient solutions.| Table (1). Chemical composition of BG-11 nutrient solutions |
| | Chemical | BG-11(g/l) | | NaNO3 | 1.5 | | K2HPO4.3H2O | 0.04 | | Na2CO3 | 0.02 | | MgSO4.7H2O | 0.075 | | CaCl2.2H2O | 0.036 | | EDTA-Na2 | 0.001 | | Fe(NH3)2Citrate | 0.006 | | Citric acid | 0.006 |
|
|
Samples were taken each day from each basin. The sample volume was 50 ml. Water samples were collected at 9:00 AM each morning periodically. They were analysed to investigate water quality during the examination period. The measured parameters were: Total dissolved solids (TDS), Air Temperature, Humidity, Sunlight period & Algae growth rate.
3. Results
The first run started with high salts concentrations. The feeding tanks had concentrations of 80000, 75000 and 70000 mg/l. The run was applied for 7 days for the three parallel basins. The second run worked with feeding concentrations 65000, 60000& 55000 mg/l. Moreover, the third run applied the lower concentrations from 50000, 45000 & 40000 mg/l. The process was repeated for four months to take the effect of climatic changes. The study measured the TDS concentrations at each basin effluent in addition to the climatic conditions during the run operation days. Tables (2), (3), (4), (5), (6), (7), (8) & (9) illustrate the results of the measured data during the first, second, third & fourth month's runs.| Table (2). Air climatic conditions during First Month Runs |
| | Run | Date | Air Climatic Conditions | | Temperature °C | Humidity % | Sun Light Period (hr) | | Day | Night | | Run 1 | 1/8/13 | 37 | 22 | 54 | 16.00 | | 2/8/13 | 38 | 22 | 42 | 16.02 | | 3/8/13 | 39 | 27 | 62 | 16.05 | | 4/8/13 | 41 | 30 | 59 | 16.07 | | 5/8/13 | 39 | 29 | 60 | 16.10 | | 6/8/13 | 40 | 31 | 59 | 16.12 | | 7/8/13 | 38 | 29 | 64 | 16.15 | | Run 2 | 11/8/13 | 37 | 32 | 54 | 16.18 | | 12/8/13 | 38 | 32 | 42 | 16.20 | | 13/8/13 | 40 | 29 | 62 | 16.22 | | 14/8/13 | 41 | 30 | 59 | 16.25 | | 15/8/13 | 39 | 29 | 60 | 16.28 | | 16/8/13 | 40 | 31 | 59 | 16.30 | | 17/8/13 | 39 | 29 | 64 | 16.28 | | Run 3 | 21/8/13 | 39 | 32 | 54 | 16.20 | | 22/8/13 | 39 | 32 | 42 | 16.18 | | 23/8/13 | 39 | 29 | 62 | 16.16 | | 24/8/13 | 41 | 30 | 59 | 16.14 | | 25/8/13 | 41 | 33 | 60 | 16.11 | | 26/8/13 | 40 | 31 | 59 | 16.09 | | 27/8/13 | 39 | 29 | 64 | 16.07 |
|
|
4. Discussions
From tables (2, 3, 4 & 5) it can be seen that the algae role for removing salts from brine water was highly noticeable. In general, the decrease in brine salinity is varied between 13-15% after first day, raised to 25-27.7% after the second day and gradually increased to 36-38.3 % after the third day and became 46 - 49% after the forth day then 54- 57% after the fifth day then finally reached 62-63% after the sixth day.The variations in each day happened due to the effect of the nature conditions of temperature, humidity and sunlight period differences during the study period between August & November. The algae activity for desalination was higher in the hot climate more than cold one with small differences. In general, the variations were not too big to result in big differences. | Table (3). TDS measured during First Month Runs |
| | Run | Date | TDS mg/l | | Left Basin | Middle Basin | Right Basin | |
| Run 1 | 1/8/13 | 80000 | 75000 | 70000 | | 2/8/13 | 68100 | 63800 | 59520 | | 3/8/13 | 57790 | 54250 | 50580 | | 4/8/13 | 49300 | 46060 | 42990 | | 5/8/13 | 41000 | 39200 | 36550 | | 6/8/13 | 34500 | 31370 | 28100 | | 7/8/13 | 28170 | 25450 | 22500 | | Run 2 | 11/8/13 | 65000 | 60000 | 55000 | | 12/8/13 | 55250 | 51100 | 46900 | | 13/8/13 | 46980 | 43390 | 39840 | | 14/8/13 | 39990 | 36900 | 33880 | | 15/8/13 | 32980 | 30400 | 27800 | | 16/8/13 | 25900 | 23700 | 20600 | | 17/8/13 | 19540 | 16660 | 13900 | | Run 3 | 21/8/13 | 50000 | 45000 | 40000 | | 22/8/13 | 42600 | 38500 | 33010 | | 23/8/13 | 36400 | 32700 | 27970 | | 24/8/13 | 29000 | 25800 | 21220 | | 25/8/13 | 22280 | 17700 | 12740 | | 26/8/13 | 16300 | 12100 | 7620 | | 27/8/13 | 10050 | 8320 | 6630 |
|
|
| Table (4). Air climatic conditions during Second Month Runs |
| | Run | Date | Air Climatic Conditions | | Temperature °C | Humidity % | Sun Light Period (hr) | | Day | Night | | Run 1 | 1/9/13 | 37 | 22 | 54 | 16.00 | | 2/9/13 | 36 | 22 | 55 | 15.58 | | 3/9/13 | 36 | 27 | 65 | 15.55 | | 4/9/13 | 35 | 23 | 65 | 15.53 | | 5/9/13 | 35 | 24 | 70 | 15.50 | | 6/9/13 | 35 | 22 | 59 | 15.48 | | 7/9/13 | 35 | 24 | 54 | 15.46 | | Run 2 | 11/9/13 | 36 | 22 | 54 | 15.40 | | 12/9/13 | 35 | 22 | 42 | 15.38 | | 13/9/13 | 34 | 22 | 62 | 15.35 | | 14/9/13 | 34 | 22 | 59 | 15.33 | | 15/9/13 | 34 | 22 | 60 | 15.31 | | 16/9/13 | 33 | 21 | 59 | 15.28 | | 17/9/13 | 33 | 22 | 64 | 15.26 | | Run 3 | 21/9/13 | 33 | 22 | 54 | 15.20 | | 22/9/13 | 33 | 22 | 42 | 15.18 | | 23/9/13 | 32 | 21 | 62 | 15.16 | | 24/9/13 | 31 | 20 | 59 | 15.14 | | 25/9/13 | 31 | 21 | 60 | 15.11 | | 26/9/13 | 30 | 21 | 59 | 15.09 | | 27/9/13 | 30 | 21 | 64 | 15.07 |
|
|
| Table (5). TDS measured during Second Month Runs |
| | Run | Date | TDS mg/l | | Left Basin | Middle Basin | Right Basin | |
| Run 1 | 1/9/13 | 80000 | 75000 | 70000 | | 2/9/13 | 68300 | 64100 | 59980 | | 3/9/13 | 58390 | 54950 | 50890 | | 4/9/13 | 49980 | 46430 | 43590 | | 5/9/13 | 41900 | 39990 | 37050 | | 6/9/13 | 35700 | 32270 | 28810 | | 7/9/13 | 29270 | 26460 | 23510 | | Run 2 | 11/9/13 | 65000 | 60000 | 55000 | | 12/9/13 | 55960 | 51740 | 47500 | | 13/9/13 | 47480 | 44090 | 40760 | | 14/9/13 | 40390 | 37600 | 34480 | | 15/9/13 | 34280 | 31100 | 28700 | | 16/9/13 | 27000 | 24400 | 21400 | | 17/9/13 | 20640 | 17660 | 14900 | | Run 3 | 21/9/13 | 50000 | 45000 | 40000 | | 22/9/13 | 42480 | 38400 | 33180 | | 23/9/13 | 35400 | 31700 | 28070 | | 24/9/13 | 28400 | 25100 | 21870 | | 25/9/13 | 21180 | 18100 | 13040 | | 26/9/13 | 17300 | 12900 | 8120 | | 27/9/13 | 11050 | 9320 | 7120 |
|
|
| Table (6). Air climatic conditions during Third Month Runs |
| | Run | Date | Air Climatic Conditions | | Temperature °C | Humidity % | Sun Light Period (hr) | | Day | Night | | Run 1 | 1/10/13 | 30 | 22 | 54 | 15.00 | | 2/10/13 | 31 | 22 | 55 | 14.57 | | 3/10/13 | 31 | 21 | 56 | 14.55 | | 4/10/13 | 31 | 20 | 57 | 14.53 | | 5/10/13 | 31 | 21 | 56 | 14.51 | | 6/10/13 | 30 | 21 | 56 | 14.49 | | 7/10/13 | 31 | 21 | 55 | 14.47 | | Run 2 | 11/10/13 | 30 | 21 | 56 | 14.45 | | 12/10/13 | 30 | 22 | 55 | 14.42 | | 13/10/13 | 29 | 21 | 56 | 14.40 | | 14/10/13 | 29 | 20 | 57 | 14.37 | | 15/10/13 | 29 | 21 | 56 | 14.35 | | 16/10/13 | 28 | 21 | 57 | 14.33 | | 17/10/13 | 28 | 21 | 55 | 14.31 | | Run 3 | 21/10/13 | 28 | 20 | 54 | 14.28 | | 22/10/13 | 27 | 21 | 57 | 14.26 | | 23/10/13 | 27 | 21 | 57 | 14.24 | | 24/10/13 | 27 | 20 | 56 | 14.21 | | 25/10/13 | 28 | 19 | 56 | 14.19 | | 26/10/13 | 27 | 20 | 55 | 14.16 | | 27/10/13 | 27 | 19 | 54 | 14.14 |
|
|
| Table (7). TDS measured during Third Month Runs |
| | Run | Date | TDS mg/l | | Left Basin | Middle Basin | Right Basin | |
| Run 1 | 1/10/13 | 80000 | 75000 | 70000 | | 2/10/13 | 68970 | 64800 | 60780 | | 3/10/13 | 58890 | 55350 | 51290 | | 4/10/13 | 50480 | 46830 | 43990 | | 5/10/13 | 42500 | 40100 | 37450 | | 6/10/13 | 36000 | 32670 | 29210 | | 7/10/13 | 29670 | 26860 | 23910 | | Run 2 | 11/10/13 | 65000 | 60000 | 55000 | | 12/10/13 | 56360 | 52140 | 47880 | | 13/10/13 | 47850 | 44440 | 41060 | | 14/10/13 | 41090 | 37990 | 34880 | | 15/10/13 | 34780 | 31600 | 29100 | | 16/10/13 | 27700 | 24900 | 21900 | | 17/10/13 | 21340 | 18160 | 15600 | | Run 3 | 21/10/13 | 50000 | 45000 | 40000 | | 22/10/13 | 42880 | 38700 | 33480 | | 23/10/13 | 35700 | 31900 | 28270 | | 24/10/13 | 28900 | 25600 | 22120 | | 25/10/13 | 21780 | 18700 | 13540 | | 26/10/13 | 18300 | 13900 | 8720 | | 27/10/13 | 11950 | 9920 | 7630 |
|
|
| Table (8). Air climatic conditions during Fourth Month Runs |
| | Run | Date | Air Climatic Conditions | | Temperature °C | Humidity % | Sun Light Period (hr) | | Day | Night | | Run 1 | 1/11/13 | 27 | 18 | 54 | 14.10 | | 2/11/13 | 28 | 18 | 54 | 14.08 | | 3/11/13 | 27 | 17 | 54 | 14.05 | | 4/11/13 | 27 | 17 | 54 | 14.03 | | 5/11/13 | 26 | 18 | 55 | 14.01 | | 6/11/13 | 26 | 17 | 55 | 13.58 | | 7/11/13 | 25 | 17 | 55 | 13.56 | | Run 2 | 11/11/13 | 25 | 17 | 55 | 13.54 | | 12/11/13 | 26 | 17 | 55 | 13.52 | | 13/11/13 | 25 | 16 | 55 | 13.50 | | 14/11/13 | 25 | 16 | 56 | 13.48 | | 15/11/13 | 24 | 16 | 55 | 13.46 | | 16/11/13 | 24 | 16 | 55 | 13.43 | | 17/11/13 | 24 | 15 | 56 | 13.40 | | Run 3 | 21/11/13 | 24 | 17 | 54 | 13.38 | | 22/11/13 | 23 | 17 | 54 | 13.36 | | 23/11/13 | 23 | 17 | 54 | 13.33 | | 24/11/13 | 22 | 16 | 54 | 13.30 | | 25/11/13 | 22 | 16 | 54 | 13.28 | | 26/11/13 | 21 | 16 | 54 | 13.26 | | 27/11/13 | 21 | 15 | 54 | 13.23 |
|
|
| Table (9). TDS measured during Fourth Month Runs |
| | Run | Date | TDS mg/l | | Left Basin | Middle Basin | Right Basin | |
| Run 1 | 1/11/13 | 80000 | 75000 | 70000 | | 2/11/13 | 69670 | 65500 | 61680 | | 3/11/13 | 59690 | 55950 | 51790 | | 4/11/13 | 50980 | 47330 | 44690 | | 5/11/13 | 43100 | 40600 | 38050 | | 6/11/13 | 36700 | 33470 | 29810 | | 7/11/13 | 30250 | 27560 | 24810 | | Run 2 | 11/11/13 | 65000 | 60000 | 55000 | | 12/11/13 | 56960 | 52840 | 48480 | | 13/11/13 | 48450 | 44990 | 41760 | | 14/11/13 | 41890 | 38690 | 35580 | | 15/11/13 | 35480 | 32400 | 29800 | | 16/11/13 | 28500 | 25700 | 22600 | | 17/11/13 | 22040 | 18990 | 16500 | | Run 3 | 21/11/13 | 50000 | 45000 | 40000 | | 22/11/13 | 43680 | 39500 | 34580 | | 23/11/13 | 36270 | 32500 | 28870 | | 24/11/13 | 29700 | 26150 | 22920 | | 25/11/13 | 22680 | 19400 | 14540 | | 26/11/13 | 19370 | 14700 | 9710 | | 27/11/13 | 12880 | 10890 | 8630 |
|
|
The results show that the effect of influent TDS concentration on the TDS removal by algae looks high. The increase of salinity in water increases the algae activity for TDS consuming under the same conditions of nutrient media quantity and algae quantity. The results show that the algae capability to consume salinity increases with the availability of this salinity.From these results, it can be seen that a pond with water depth between 30-60 cm and retention time of one or two days, can be enough to return the brine salinity to the ordinary seawater source salinity. In addition, these proposed ponds could help in removing the brine water high temperature in all the thermal desalination plants.
5. Conclusions
Generally, results encourage the use of green algae for brine water treatment by desalination and decreasing its temperature. This put an easy environmental and economic solution for environmental problems occurred by brine water in desalination plants. The study had shown the following specific conclusions:-1. Scendesmus species growth was successfully obtained in saline water as it uptakes salts and make use of them in its metabolism.2. The system achieves high removals for salinity between 13% (for one day) to 63 % (for six days).3. The effectiveness of the system increases as the starting total dissolved solids content increases. 4. The effect of the nature conditions of temperature, sunlight period was noticeable by about 2 % difference in removal efficiency between summer and winter.5. The advantages of the proposed system are low cost, easy construction with low operation & maintenance cost, and no energy requirements in addition to environmental protection from brine effects.6. The system gives low pollution to surrounding environment, with maximum benefit of by-products, besides it solves the problem of getting rid of the waste products.
References
| [1] | Pelczar, M.J. and Reid, R.D., "The Algae",: Mc-graw - Hill Book Company, N.Y. , USA 11065. |
| [2] | Gimmler. "The Metabolic Response of the Halotolerant Green Alga Dunalella parva to Hypertonic Shocks". Gottingen: Ber. Deutsch. Bot. Ges. Bd., Vol. 104, 110101. |
| [3] | G, Laliberte, et al., "Effect of Phosphorus Addition on Nutrient Removal from Wastewater with the Cyanobacterium Phprmidium bohneri". s.l.: Bioresource Technol, Vol. 510. 227-233,110107. |
| [4] | Ibrahim, M.S., "Reuse and Recycle of Wastewater in Natural Gas Industry.", PhD Thesis, Inst. Of Environmental Studies & Researchs, ASU, Cairo, Egypt, 2005. |
| [5] | El Nadi, M. H., El Sergany, F.A. R & Ibrahim, M.S.M., "Use of Algae for Wastewater Treatment In Natural Gas Industry.", ASU, Faculty of Engineering Scientific Bulliton, Vol.1.,16107-16105, Cairo, Egypt, September 2009. |
| [6] | El Nadi, M. H., El Sergany, F.A. GH. R "Water Desalination by Algea", .ASU Journal of Civil Engineering Vol. 2., pp 105-114, September 2010 |
| [7] | El Nadi, M.H. A., Waheb, I.S. A. , Saad, S. A.H.A., "Using Continuous Flow Algae Ponds for Water Desalination ", El Azhar Univ., Faculty of Eng., CERM of civil Eng., vol. 33, No. 4, December, 2011. |
| [8] | Badawy M.A., El Nadi, M.H. & Nasr, N.A.H.," Biological Desalination Technique by Algae Application", Ain Shams Univ., Institute for Environmental Studies and Research, Journal of Environmental Science, vol. 17, No. 4, December, 2011. |
| [9] | El Nadi, M.H., Nasr, N.A.H., El Hosseiny, O.M. & Badawy M.A., "Algae Application for biological desalination.", 2nd International Conference & Exhibition, Sustainable water supply & sanitation, (SWSSC2012), holding company for water and wastewater, Cairo, Egypt, December. 2012. |
 Abstract
 Reference
 Full-Text PDF
 Full-text HTML