-
Paper Information
- Previous Paper
- Paper Submission
-
Journal Information
- About This Journal
- Editorial Board
- Current Issue
- Archive
- Author Guidelines
- Contact Us
American Journal of Environmental Engineering
p-ISSN: 2166-4633 e-ISSN: 2166-465X
2014; 4(2): 32-40
doi:10.5923/j.ajee.20140402.03
Interferometric SAR and Geospatial Techniques Used for Subsidence Study in the Rafsanjan Plain
 Abstract
 Reference
 Full-Text PDF
 Full-text HTML
Maryam Dehghani1, Mohammad Rastegarfar2, Roghieh Akbar Ashrafi3, Neda Ghazipour4, Hamed Reza Khorramrooz5
1Dept. of Civil and Environment Engineering, School of Engineering, Shiraz University
2Technical Institute of Surveying and Mapping of National Geographic Organization, Tehran
3Geological Survey of Iran (GSI)
4Dépt. de Minéralogie, Université de Genéve
5Department of GIS, faculty of Geodesy and Geomatics Engineering, KNT University of Technology, Tehran
Correspondence to: Mohammad Rastegarfar, Technical Institute of Surveying and Mapping of National Geographic Organization, Tehran.
| Email: |  |
Copyright © 2014 Scientific & Academic Publishing. All Rights Reserved.
Land subsidence caused by overexploitation of groundwater is a phenomenon that has different devastating effects on environment, infrastructures, buildings, and etc. In this paper the subsidence is modeled by using the water level information of various piezometric wells distributed in the study area, vegetation coverage, and the soil type in Rafsanjan plain located in Kerman province. Also by using the AHP multiple attribute decision making model and use it for each index according to the severity of effect on subsidence, the weights are given and then the information layers were prepared in Geospatial Information System (GIS) using different datasets such as satellite images. The prepared information layers are then integrated assigning a specific weight to each one. In order to evaluate the modeling results, Interferometric Synthetic Aperture Radar (InSAR) as a powerful tool for measuring the ground deformation at high spatial resolution is applied. InSAR technique is a very powerful method to measure the ground surface deformation, displacement, topography and etc by combining radar images which are acquired in different times. An interferogram calculated by subtracting the phase of two radar images contains different phase contribution mainly due to the topography. Therefore, a Digital Elevation Model (DEM) is used for removing the topography effects. There are some limitations in using InSAR technique, but the most important one in the case study area is temporal decorrelation which is the changes of scattering behaviors between 2 radar acquisition times. In his paper 3 ENVISAT ASAR images acquired in 2005 are used to obtain the surface displacement map. The final map produced by modeling is compared with InSAR derived displacement map. The high compatibility of the subsidence model and displacement map extracted from InSAR indicates that weighting of the subsidence factors and their integration are accurately performed.
Keywords: Subsidence, Interferometry, GIS, AHP, Radar images
Cite this paper: Maryam Dehghani, Mohammad Rastegarfar, Roghieh Akbar Ashrafi, Neda Ghazipour, Hamed Reza Khorramrooz, Interferometric SAR and Geospatial Techniques Used for Subsidence Study in the Rafsanjan Plain, American Journal of Environmental Engineering, Vol. 4 No. 2, 2014, pp. 32-40. doi: 10.5923/j.ajee.20140402.03.
Article Outline
1. Introduction
- Land subsidence is a remarkable phenomenon that seems to have attracted many experts and scholars. It is so important that UNESCO has introduced it as a designated topic for research [Gens, 1998]. According to the Geological Institute of America, this phenomenon is the collapse or subsidence of land surface downward, with little movement in horizontal orientation, that isn't limited in terms of the extent and severity. Important factors involved in this phenomenon, are melting of ices, movement of Earth's crust, earthquakes, volcanic activities and lava out of the ground or industrial and mining activities such as extraction of underground resources include water discharges from aquifers, extraction oil and so on.One of the reasons for changes in volume of water aquifers is the water with drawls through the wells that excessive increase of water with drawls leads to increase effective stress in the aquifer, furthermore the water loss hydro due to reduction of water levels in aquifers, cause the subsidence phenomenon occurs [Quilin, 2004]. This phenomenon follows effects. Cracks in the land and buildings, upset the balance and channel slope and waterways, and eventually other material losses are among its effects. Land subsidence is a problem facing many countries, and Iran is no exception in this category. Kerman province is one of the provinces where this phenomenon occurred in and uneven decline in groundwater levels in this area, especially in Rafsanjan plain due to indiscriminate use of water for agriculture and irrigation pistachio has made groundwater level in the past 20 years more than 20 meters down and eventually occurs subsides between 5 to 15 centimeters each year [Luigi, 2005]. Critical activities has been done in order to build water storage facilities as well as water transfer systems in Iran which still is not enough and still reliance on groundwater resources and it remains very important factor [Berardino et.al, 2002]. Several studies have been conducted to examine this phenomenon in Rafsanjan plain which because of 3 reasons, its results is unacceptable for the research studies:1- It did not conduct in accordance with the present technology and there is lack of appropriate data.2- The antecedence data is less than the current data.3- The main theme of those studies wasn’t land subsidence but they have discussed on examination of the amount of water in the wells.In this paper land subsidence in Rafsanjan plain has been discussed. The main objectives of this paper are zoning of land subsidence and identify potential areas with high subsidence event. Thus, it has been used of different parameters of geology and hydrogeology affecting on the occurrence of this phenomenon. On the basis of influence degree of each, these data were combined in geospatial information systems (GIS). In the second part, in order to measure the accuracy of the extracted regions which have subsidence potential, Interferometric Synthetic Aperture Radar (InSAR) technique is used. InSAR technique is a method that uses the phase data of two radar images that are taken at different times from the same area and will estimate earth’s surface displacement during this period [Zebker, 1986]. This method will be able to map the surface displacement in a wide continuous coverage by high spatial resolution and with an accuracy of less than 1 cm. Since InSAR technique has been used to measure the earth’s surface displacement caused by subsidence [Dehghani, et. al. 2010, Crosetto, et. al., 2002 and Chang and Wang, 2004].If the time interval between two radar images was so extent that changes the characteristics of the earth’s surface dispersion due to lack of time correlation, we would not be able to use this method [Zebker, 1992]. In this section, the InSAR displacement map of Rafsanjan plain which using short time intervals images to prevent temporal decorrelation is compared to zoning map. By comparison the results of two above methods can realize the accuracy of zoning land subsidence and attributed weight to each data layer.
2. Materials and Methods
- In this part of paper, the zoning of land subsidence is examined in Rafsanjan plain area in terms of subsidence potential and talent. But first we should present data and information layers that are used. Several factors are involved in creation of this important phenomenon that independently has particular effects and has been analyzed by weight assigned to each layer. The vegetation of the area, which is divided into several categories are one of available information layers that its map was produced by the Forest and Rangeland and Watershed Organization and were used for zoning. Also in order to complete the mentioned layer this information were obtained of +ETM images of LANDSAT7 satellite. The final information layer was collected by combining the information layers of vegetation available maps in Forests and Rangeland Organization with vegetation maps derived from satellite imagery +ETM. Full output layer contains vegetation, including forests, farms and fields that are shown in the figure below.
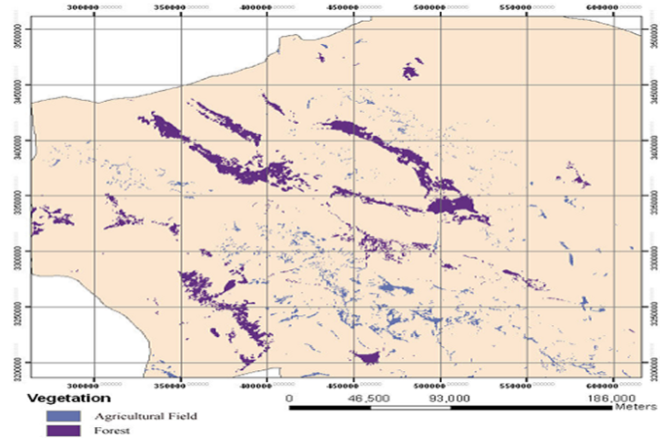 | Figure 1. Vegetation layer produced from LANDSAT 7 satellite data and maps of Forest and Rangeland and Watershed Org |
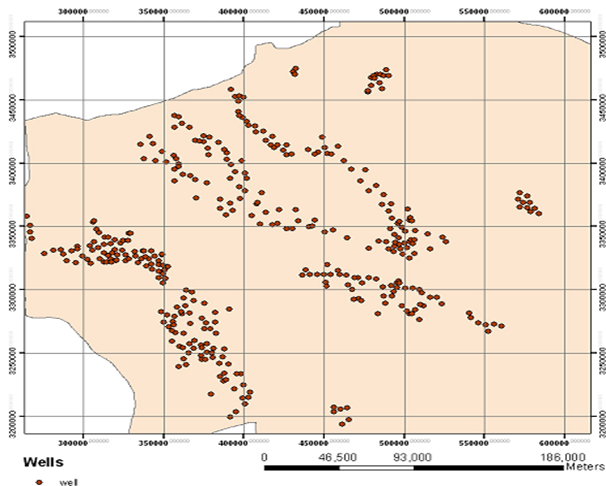 | Figure 2. Location of Pizometric water wells in the area |
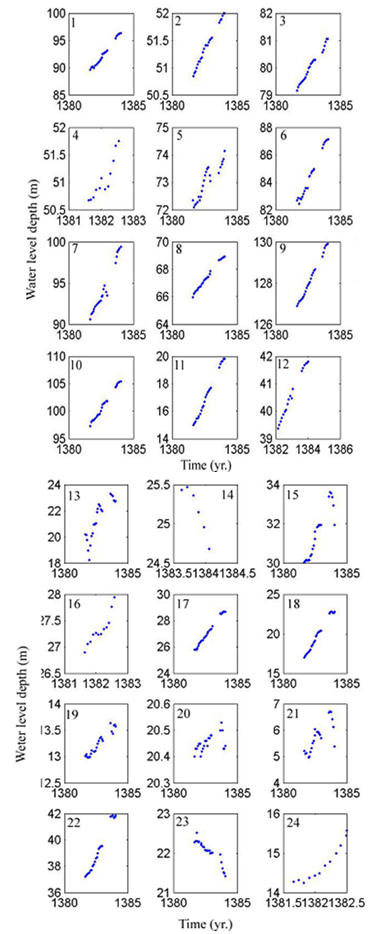 | Figure 3. Time series of the depth of the water level in some wells located in the area |
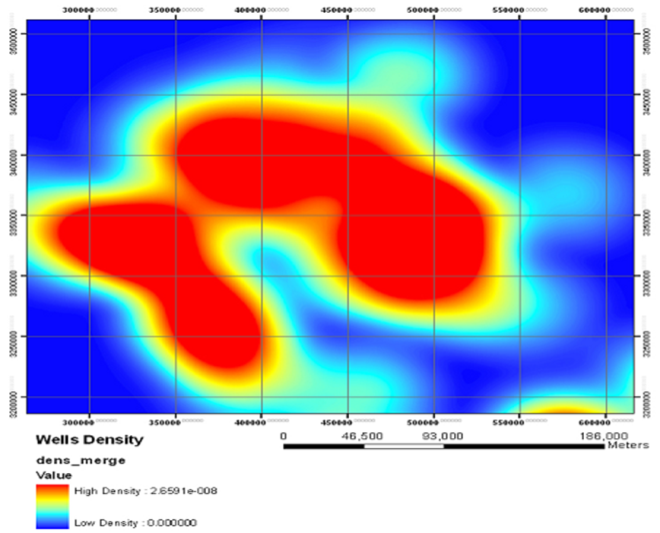 | Figure 4. Map of assembly wells in the region |
|
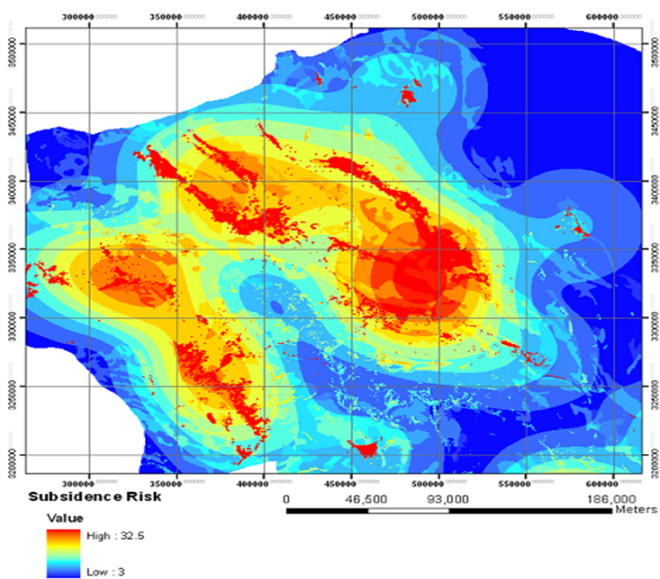 | Figure 5. Result of combining layers in Weighted Sum Method |
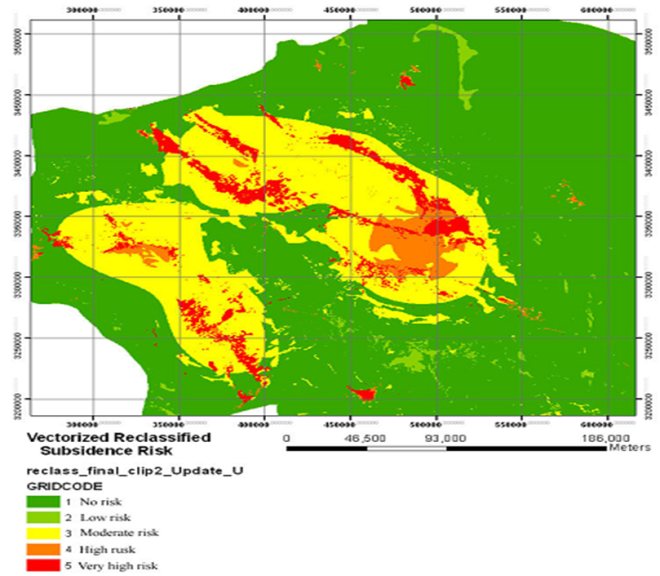 | Figure 6. The result of re-classification of the output layer in Weighted Sum Method |
3. Assessment and Results
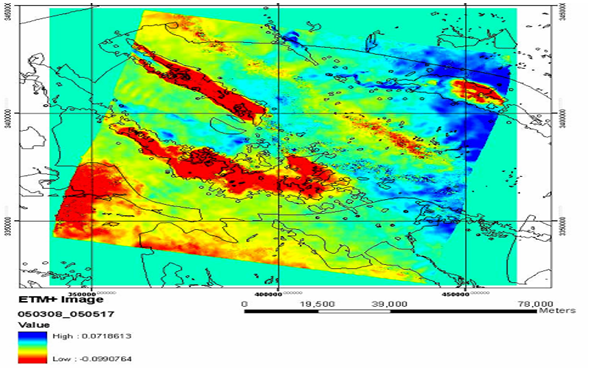
- The GIS system analyzes existing data layers, to determine the level and range of subsidence rates by InSAR technique. The proposed radar data that prepared in a certain time interval were purchased from the Europe Space Agency (ESA). These data were provided from 3 radar images of Track 205 by useable format in InSAR processing called SLC format. Processing the above 3 video data by assistance of software Gamma were produced 3 interferograms.
|
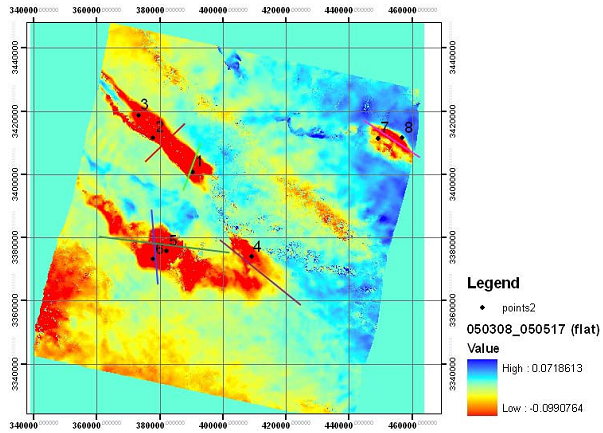 | Figure 7. Interferogram 1 that has been removed its orbital error |
 | Figure 8. Interferogram 1 and the vector layer in GIS modeling environment |
4. Conclusions
- Zoning and land subsidence rates in this study, were studied and measured through two different methods. Way in which the available data layers of important factors affected in land subsidence with associated weights were used in determining the range of subsidence by GIS software and also another approach using InSAR techniques to measure the range and rate of land subsidence. Finally, after reviewing the plans of each of the methods we determined that high correspondence of the maps indicate the correct way of combining layers of information and assign a weight to each of them. However, InSAR techniques are the exact method for accurately monitoring the displacement, deformation and land subsidence that can be measured less than 1 CM.
5. Appreciation and Thanks
- At the end, we appreciate and thank of the European Space Agency (ESA) to give ENVISAT ASAR radar images and orbital data and sensor calibration requirements for the study and also we thank and appreciated of management of Geological Survey of Iran (GSI).
References
| [1] | Gens, R. "quality assessment of SAR Interferometric data", PhD thesis of ITC, 1998. |
| [2] | Luigi, T. "Mapping regional land displacements in Venice by an integrated mpnitoring system", ELSEVIER, Remote Sensing of Environment 98(2005) 403-413, 2005. |
| [3] | Paolo Berardino, Gianfranco Fornaro, Riccardo Lanari, Eugenio Sansosti, "A New Algorithm for Surface Deformation Monitoring Based on small Baseline Differentional SAR Interferograms", IEEE TRANSACTIONS ON GEOSIENCE AND REMOTE SENSING, VOL. 40, NO.11, NOVAMBER 2002. |
| [4] | Quilin, Tan. "Study on Radar differentional Interferometry technology and application to Mani Earthquacke using ERS1/2 SAR data": ISPRS Conference, 2004http://www.isprs.org/istanbul2004/comm7/papers/143.pdf. |
| [5] | Zebker, H.A. "Topography mapping from interferometric synthetice aperture radar observations". Journal of Geophysical Research-B5, 91, 4993-4999, 1986. |
| [6] | Zebker, H.A. "Decorrelation in interferometric echoes", IEEE Transaction on Geoscience and Remote Sensing, 30, 950-959, 1992. |
| [7] | Crosetto, M., Tscherning, C.C., Crippa, B. & Castillo, M. (2002). "Subsidence monitoring using SAR interferometry: reduction of the atmospheric effects using stochastic filtering", Geophysi. Res. Lett., 29(9), 26.1– 26.4. |
| [8] | Dehghani, M., Valadan Zouj, M., Entezam, I., Saatchi, S., Shemshaki, A. (2010). "Interferometric Measurements of Ground Surface Subsidence induced by Overexploitation of Groundwater". Journal of Applied Remote Sensing. Volume 37 (1), 147-156. |
| [9] | Chang, C.P, Wang, CT, "Land surface deformation corresponding to seasnol ground water fluctuation, determaining by SAR interferometry in Taiwan", ELSEVIER, Mathematics and Computer in Simulation 67(2004) 351-359, 2004. |