-
Paper Information
- Next Paper
- Paper Submission
-
Journal Information
- About This Journal
- Editorial Board
- Current Issue
- Archive
- Author Guidelines
- Contact Us
American Journal of Environmental Engineering
p-ISSN: 2166-4633 e-ISSN: 2166-465X
2014; 4(2): 25-31
doi:10.5923/j.ajee.20140402.02
Assessment of Climate Change Impact on the Hydrology of Geba Catchment, Northern Ethiopia
 Abstract
 Reference
 Full-Text PDF
 Full-text HTML
Samuale Tesfaye, Antony Joseph Raj, Girmay Geberesamuel
Department of Land Resources Management and Environmental Protection, College of Dryland Agriculture and Natural Resources, P.O. Box 231, Mekelle University, Mekelle, Ethiopia
Correspondence to: Antony Joseph Raj, Department of Land Resources Management and Environmental Protection, College of Dryland Agriculture and Natural Resources, P.O. Box 231, Mekelle University, Mekelle, Ethiopia.
| Email: |  |
Copyright © 2014 Scientific & Academic Publishing. All Rights Reserved.
The study was carried out to investigate the sensitivity of selected hydrologic response (surface runoff) to climate change in the Geba catchment, Tekez Basin, Ethiopia. Statistical Down Scaling Model (SDSM) was employed to transform the Global Circulation Model (GCM) output in daily meteorological variables appropriate for hydrological impact studies. SDSM 4.1 was used to down scale the HadCM3 GCM that employed for the A2a (Medium- High Emissions) and B2a (Medium-Low Emission) scenarios. The WetSpass, a physical based water balance model was used to estimate runoff under a changed climate. Downscaled meteorological variables are minimum temperature, maximum temperature and precipitation and were used as input to the WetSpass (Water and Energy Transfer between Soil, Plants and Atmosphere, under quasi Steady State) hydrological model. The model was calibrated (R2=0.73) using ten year period (1991-2000), validated (R2=0.67) with the next eight year period (2001-2008), and applied for different climate scenarios. The scenarios developed for the years 2010-2099 showed that both the minimum and maximum temperature show an increasing trend while the result of downscaled precipitation reveals that precipitation does not show a systematic increase or decrease in all future time horizons for both A2a and B2a scenarios. The average annual minimum temperature will increase by 1.1℃ in 2020s. In 2050s, the increment will be 2.1℃ and 1.6℃ for A2 and B2 scenario respectively. For the 2080s periods, the average annual minimum temperature will increase by 3.9℃ and 2.8℃ for A2 and B2 scenario respectively. The general warming simulated by all GCMs under A2a and B2a scenario would result in a substantial decrease in annual runoff over the Geba catchment. But it indicates that there will be high seasonal and monthly variation of runoff compared to the annual variation. In the main rainy season (June-September), the runoff volume will reduce by 12.9% and 11.1% for A2 and B2 scenarios respectively in 2080s.
Keywords: Climate Change Impact, Geba Catchment, SDSM, GCM, WetSpass, Runoff Volume
Cite this paper: Samuale Tesfaye, Antony Joseph Raj, Girmay Geberesamuel, Assessment of Climate Change Impact on the Hydrology of Geba Catchment, Northern Ethiopia, American Journal of Environmental Engineering, Vol. 4 No. 2, 2014, pp. 25-31. doi: 10.5923/j.ajee.20140402.02.
Article Outline
1. Introduction
- Earth’s average temperature has risen drastically over the past century and is projected to rise further over the next hundred years. Global average temperature has increased by 0.6 ± 0.2℃ in the past 100 years and global average precipitation has increased slightly [1]. According to Intergovernmental Panel on Climate Change (IPCC), climate change in usage refers to a change in the state of the climate that can be identified (e.g. using statistical tests) by changes in the mean and/or the variability of its properties and that persists for an extended period, typically decades or longer. According to the Stern Review, without action, the overall costs of climate change will be equivalent to losing at least 5 per cent of global gross domestic product (GDP) each year, now and forever. A wider range of risks and impacts could increase this to 20 per cent of GDP or more. The Review proposes that one percent of global GDP per annum is required to be invested in order to avoid the worst effects of climate change [2]. Climate change is projected to further adversely affect key development challenges, including providing clean water, energy services and food; maintaining a healthy environment; and conserving ecological systems and their biodiversity and associated ecological goods and services. The Millennium Ecosystem Assessment [3] assessed the consequences of ecosystem change for human well-being and has reported that water availability and quality are projected to decrease in many arid and semiarid regions (with high certainty).One of the most significant impacts of climate change is likely to be on the hydrological system, and hence on river flow and regional water resources. This would be particularly true in arid and semiarid areas of Africa where water resources are very sensitive to climate variability, particularly rainfall. Developing countries, such as Ethiopia, will be more vulnerable to climate change mainly because of the larger dependency of their economy on agriculture which is very sensitive to climatic variations. The impact of climate change on water resources is so integrated into different sectors, such as agriculture, health, urbanization, fisheries, etc. and it has motivated many researchers to conduct studies using different approaches.Many studies have been performed to analyze the impacts of climate change on water resources of Ethiopia [4-8]. However, most previous studies have focused mainly on the changes in mean annual runoff volume. Nevertheless climate change can affect various aspects of water resources, e.g., spatial and temporal distribution of rainfall, quality and quantity, temperature, groundwater recharge, etc. Besides the studies are often limited in space, time and scope. Therefore, a better thoughtful of the local dimensions of vulnerability is essential to develop appropriate adaptation measures that will mitigate the adverse consequences and will help for future decision criteria for water allocation, structure design, etc. Water resources operations should be revised with the changes in climate driven variables. The present research study was carried out to investigate the sensitivity of selected hydrologic response (surface runoff) to climate change in Geba catchment with the following objectives: 1) to develop and evaluate climate scenario data of temperature and precipitation from 2010 to 2099, and 2) to quantify the possible effects of climate change on surface runoff (2020s, 2050s and 2080s) of the study area.
2. Materials and Methods
2.1. Study Area
- The study area Geba catchment (Figure 1), located in Tigray region, northern Ethiopia, extends from 38o37’48’’ to 39o47’24’’ East and from 13o18’00’’ to 14o15’00’’ North. It covers an area of 5128 km2 with an elevation range of 945 to 3298m above mean sea level. The highest point is situated in the North east of the catchment.
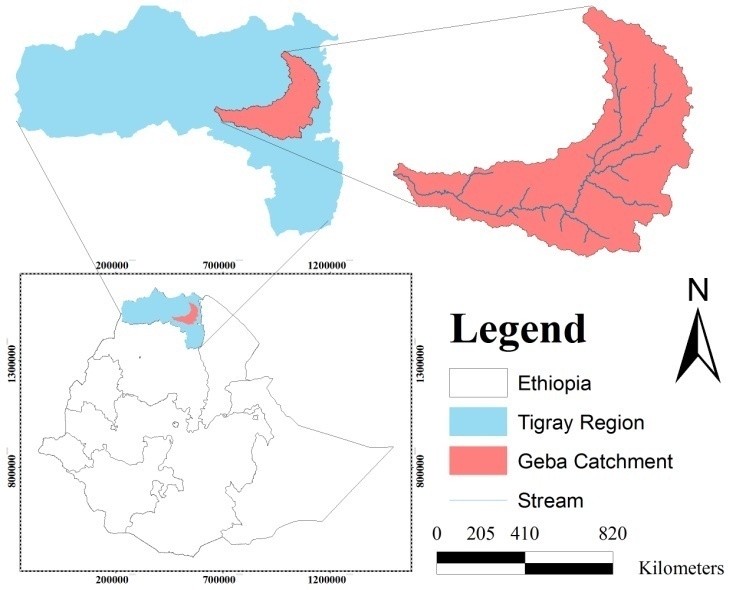 | Figure 1. Map of Study Area: Geba Catchment, Tigray Region, Northern Ethiopia |
2.2. Data Organization
- The Geba catchment was divided into three subcatchments: Upper Geba (3298-1697 m.a.s.l), Middle Geba (1697 - 1292 m.a.s.l), and Lower Geba (1292 – 945 m.a.s.l) based on its elevation for a better understanding of water distributions and other land characteristics (e.g. land use). However, the climate impact assessment was done over the whole of the basin area. Station based meteorological data were organized and averaged for the catchment. Mean monthly temperature and monthly total rainfall were found from 6 and 8 stations respectively, within the basin, for the period 1994-2009. Similarly other basic meteorological data such as temporal averages of potential evapotranspiration (2 stations) and Wind speed (3 stations) were obtained from the National Meteorological Services Agency and IUC-Mekelle University archive. For stations with missing data, monthly mean and median values were used for temperature and rainfall respectively [7].Observed mean monthly river discharge for 7 stations (Suluh, Genfel, Agula, Illala, Dolo Quiha, Gheba at Mekelle and Ayinalem) of Geba catchment was used as the basic hydrological data (obtained from Ministry of Water Resources). Missing data in stream flow were filled using the ordinary least squares (OLS) and the Maintenance of Variance Extension Type 1 (MOVE.1) methods [9]. This method has been applied for record extension, because it preserves or maintains the variance of the observed record. The MOVE.1 equation is given as:
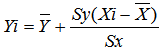 Where, Xi is the known logarithm of the stream flow at station X Yi is the logarithm of the stream flow value to be calculated at station Y
  are the means of logarithm of stream flow at stations X and Y respectivelySx and Sy are the standard deviation of logarithm of stream flow at stations X and Y respectively
 2.3. Methodology
- Statistical Down Scaling Model (SDSM), the well recognized statistical downscaling tool which is applied widely in climate impact studies, was employed to transform the Global Circulation Model (GCM) output in daily meteorological variables appropriate for hydrological impact studies. SDSM 4.1 was used to downscale the HadCM3 GCM that employed for the A2a (Medium- High Emissions) and B2a (Medium-Low Emission) scenarios. It constructs the future periods climate scenario for 90 years based on the mean of 20 ensembles where further analysis was done based on three 30-year periods centered on the 2020s (2010-2039), 2050s (2040-2069) and 2080s (2070-2099). Model calibration was carried out based on the selected predictor variables which have high explained variance from the group that were derived from the NCEP dataset. Station based meteorological data were organized and averaged for the catchment for the period 1994-2009 that representing the current climate condition. The first 8 years of data (1994-2002) were considered during calibrating the regression model while the remaining 7 years (2003-2009) were used to validate the model. Some of the SDSM setup parameters for bias correction and variance inflation were adjusted during calibration to obtain a good statistical agreement between the observed and simulated climate variables.Flow was simulated using WetSpass (Water and Energy Transfer between Soil, Plants and Atmosphere, under quasi Steady State) a physically based water balance model. For model development, datasets of discharge for the period 1992-2008 were used. Flow calibration was carried out over the period of 1992-2000 and the validation also undertaken over the period of 2001-2008. Subsequently the simulation of river flows was carried out using the downscaled precipitation and temperature and using evapotranspiration as input to hydrological model. The evapotranspiration was computed based on the downscaled minimum and maximum temperature for each time horizon. Other characteristics of the catchment like land use, soil texture, groundwater depth, and wind speed, have been taken as constant to compute the difference from future scenarios of river flow from the base year. Consequently the hydrological model was used to identify possible trends of non-overlapping 30 years 2020s (2010-2039), 2050s (2040-2069) and 2080s (2070-2099) in the simulated river flow. The present condition in the hydrological model is represented by taking the average of the longest possible records available in study area (1992-2008).
3. Results and Discussion
3.1. Downscaling with SDSM
- The generated future scenarios of minimum temperature and maximum temperature generally showed an increasing trend from the base period values (Figure 23, (a) and (b)). The average annual minimum temperature will increase by 1.1℃ in 2020s. In 2050s, the increment will be 2.1℃ and 1.6℃ for A2 and B2 scenarios respectively. For the 2080s periods, the average annual minimum temperature will increase by 3.9℃ and 2.8℃ for A2 and B2 scenarios respectively. The increment for the A2 scenario is greater than the B2 scenario since the A2 scenario represents a medium high scenario which produces more CO2 concentration than the B2 scenario which represents a medium low scenario.The downscaled maximum temperature scenario also indicates that it will rise by 0.7℃ in 2020s. In 2050s, the increment will be 1.5℃ and 1℃ for A2 and B2 scenarios respectively. In 2080s, the annual maximum temperature will increase by 2.6℃ and 1.8℃ for A2 and B2 scenarios respectively. As shown from Figure 3, the increment in maximum temperature is less than the minimum temperature.The average monthly and annual precipitation (Figure 3, (a) & (b)) in the catchment generally shows a decreasing trend in the beginning of the rainy season (May and June) and increasing trend towards the end of the rainy reason (September and October) for both A2 & B2 scenarios in all future time horizons. By 2080s, the rainfall will experience a decrease of 20% and 10% in June from the baseline period for A2 and B2 scenarios respectively, whereas September rainfall will increase by 7.7% and 6.1% for A2 and B2 scenarios respectively. The rainfall will also indicate a reduction in July and August from the baseline period for the A2 scenario in all future time horizons, however there is also indication of increment in some of the future time horizon for the B2 scenario. In the main rainy season (June-September), the rainfall exhibits a relative decrease from the baseline period for the A2 scenario in all future time horizons, whereas the B2 scenario indicates a decrease in 2020s and a slight increment in 2050s and 2080s. The mean annual rainfall variation is not significant as compared to the monthly variation. The mean annual rainfall indicates a decrease in 2020s followed by a slight increase in 2050s and 2080s. With reference to this study, rainfall will also experience a reduction in June-August for most part of the future time horizons, however the rainfall variation in December- February is not significant because these are the driest months which contribute less than 1.5% of the annual rainfall in the study area.Malhi and Wright [10] have reported that a large part of the recent increase in temperature records reflects a rise in minimum temperatures, whereas maximum temperatures may remain stable or actually decrease, especially during the summer season. Hence, systems limited by maximum temperature may not have shown any corresponding changes in productivity. Tropical forest regions show temperature increases averaging 0.26 ± 0.05℃ since the mid-1970s. Overall precipitation appears to have declined in tropical rainforest regions at a rate of 1.0 ± 0.8 per cent per decade since 1960. This pan-tropical decreasing trend in land surface measurements of rainfall is primarily driven by a strong and significant decline in rainfall in the northern African tropics (3-4 per cent per decade). Rainfall only declined marginally in tropical Asia and showed no significant trend in Amazonia [10].
3.2. Hydrological Impact of Future Climate Change Scenario
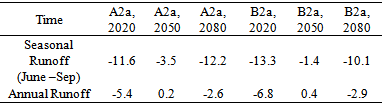
- The coefficient of determination during calibration and validation were found to be 0.82 and 0.79 respectively. Nash-Sutcliffe simulation efficiency was found to be 0.73 during calibration and 0.67 during validation. In general, Figure 4 shows that the validation results confirm the model performance is reasonably good in simulating flows for periods outside the calibration period. Simulation results for three future time horizons are summarized in Table 1 and Figure 5. The variation in mean annual runoff is moderate (Table 1). The mean annual runoff will reduce by 2.6% and 2.9% in 2080s for the A2 and B2 scenarios respectively. However, there is significant variation in the seasonal and monthly flow. In the main rainy season (June-Sep), the runoff will reduce by 12.2% and 10.1% in 2080s for A2 and B2 scenarios respectively. Whereas in winter season (October to May), it shows somewhat increments for both A2 and B2 scenarios in all future time horizons. This might be contributed by the increase of average rainfall from the downscaling scenario for the season.
|
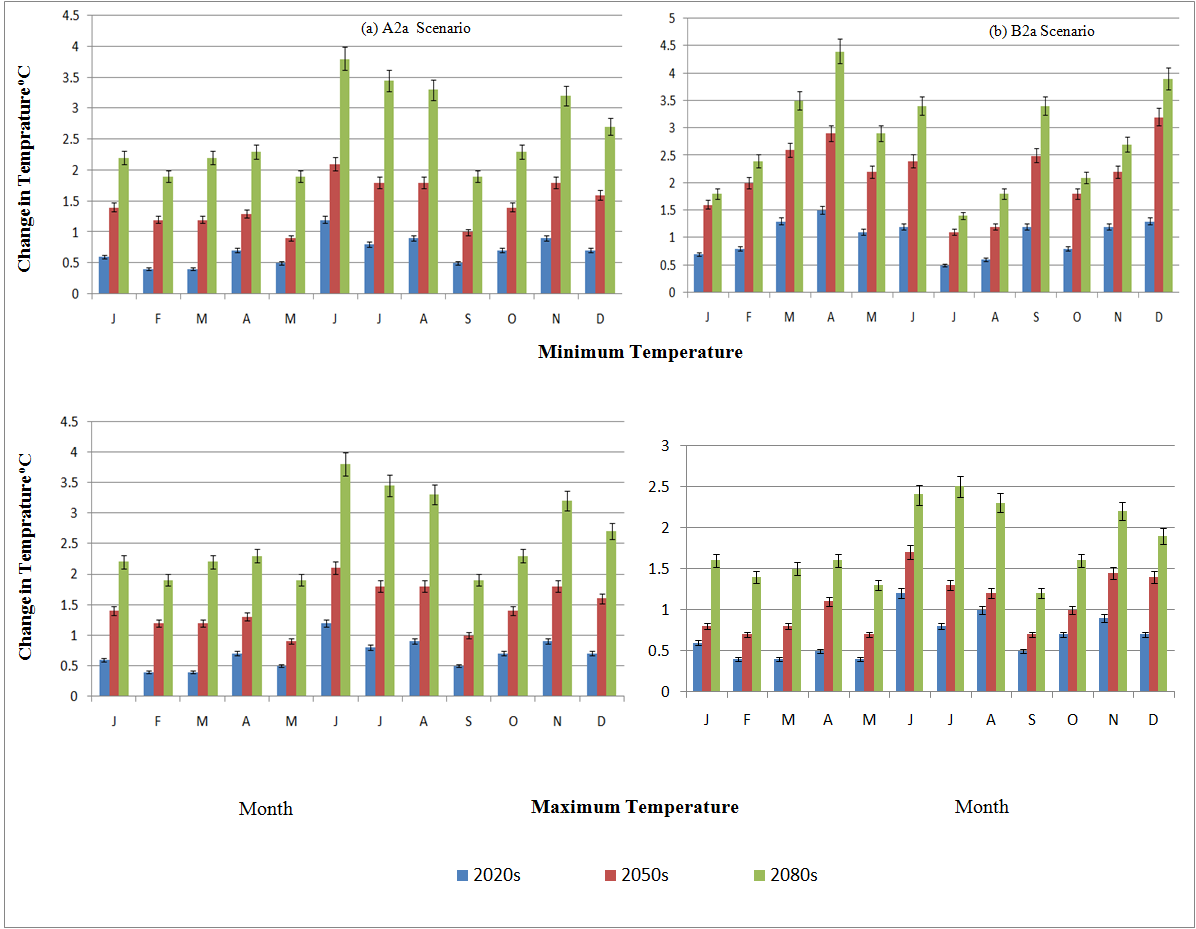 | Figure 2. Change of Downscaled Monthly Temperature with Error Bar (Vertical line) for the Period 2010-2099 |
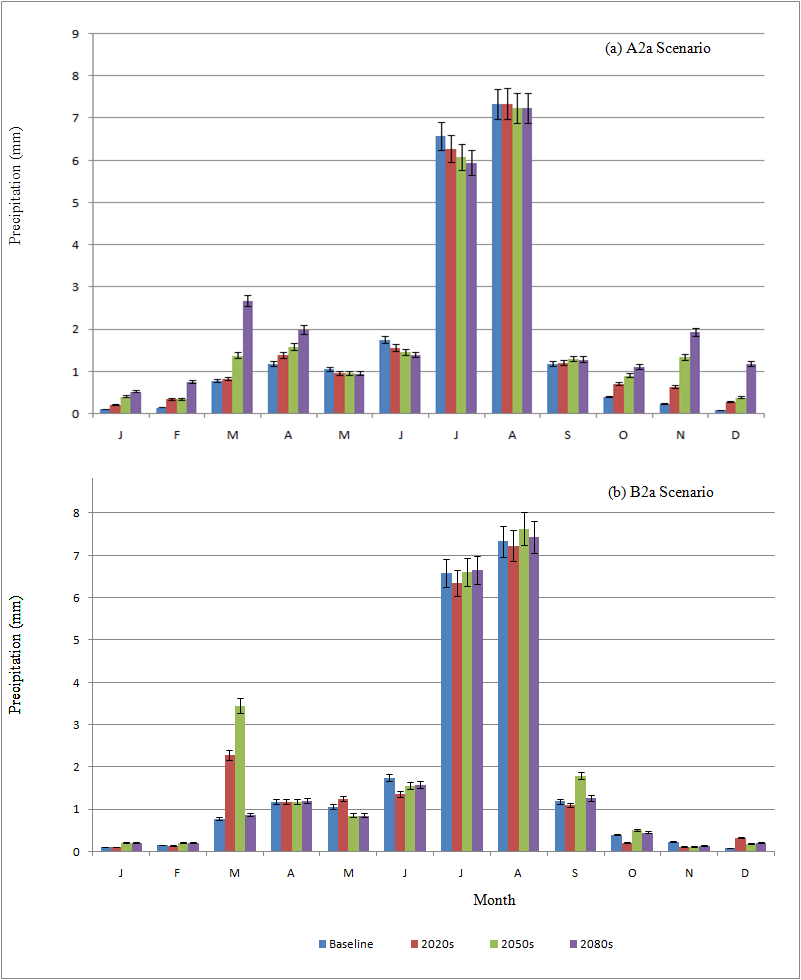 | Figure 3. Mean Daily Precipitation with Error Bar (Vertical line) Downscaled from HadCM3 A2a and B2a |
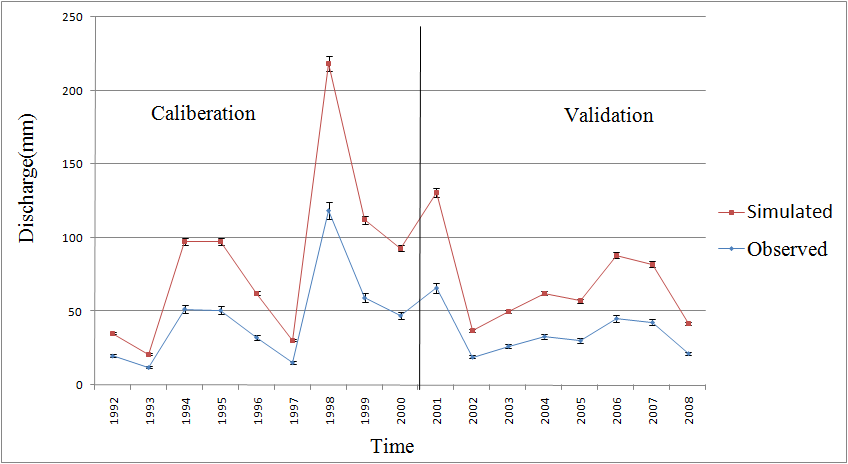 | Figure 4. Seasonal (June to September) Observed and Simulated Hydrograph with Error Bar (Vertical line) during Calibration and Validation Period |
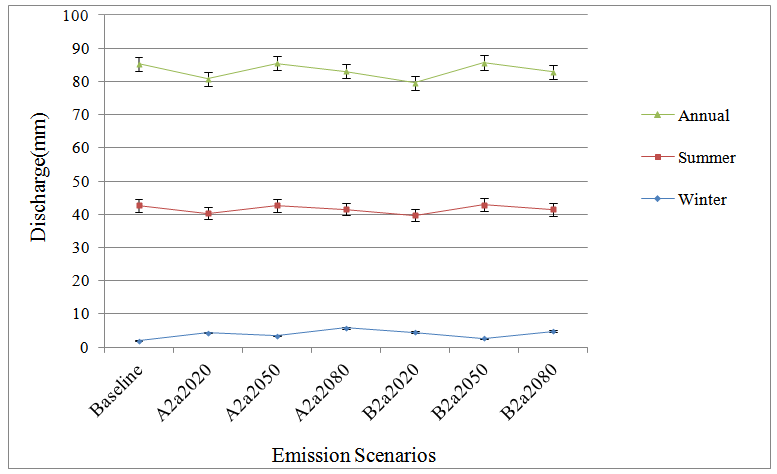 | Figure 5. Simulation Results of Mean Flow with Error Bar (Vertical line) for A2a and B2a Scenarios |
4. Conclusions
- The scenarios developed for the years 2010-2099 indicate that both the minimum and maximum temperature show an increasing trend. The result of downscaled precipitation reveals that precipitation does not show a systematic increase or decrease in all future time horizons for both A2a and B2a scenarios. From this impact assessment study, it can be concluded that the general warming simulated by all GCMs under A2a and B2a scenarios would result in a substantial decrease in annual runoff over the Geba catchment. But it indicates that there will be high seasonal and monthly variation of runoff compared to the annual variation. In the main rainy season (June-September), the runoff volume will reduce by 12.9% and 11.1% for A2 and B2 scenarios respectively in 2080s. Results of climate change assessment are highly dependent on the input data and uncertainty of the models. Hence this work would be considered as general indication and it has to be extended in the future by including different GCMs and emission scenarios.
ACKNOWLEDGEMENTS
- This work was funded by Research and Publication Office (RPO) of Mekelle University as a part of the recurrent budget (Government of Ethiopia). Support from the Mekelle University is gratefully acknowledged. Our heartfelt appreciation and thanks are extended to the farmers, District and Kebele administrators who live in Geba catchment for their kindness and time devotedness during the field work and interviews.