Alaa Nabil El-Hazek1, 2
1Department of Civil Engineering, Faculty of Engineering, Al-Baha University, Al-Baha, 65522, Kingdom of Saudi Arabia
2On leave from Department of Civil Engineering, Faculty of Engineering at Shobra, Banha University, Cairo, 11689, Egypt
Correspondence to: Alaa Nabil El-Hazek, Department of Civil Engineering, Faculty of Engineering, Al-Baha University, Al-Baha, 65522, Kingdom of Saudi Arabia.
| Email: |  |
Copyright © 2014 Scientific & Academic Publishing. All Rights Reserved.
Abstract
Water storage for later use is essential for Kingdom of Saudi Arabia, as there are no natural surface water resources. The main natural water resources in Kingdom of Saudi Arabia are ground water and rain water falling only in some provinces. Water is stored mainly by dams. Al-Baha province is located on the western south of Kingdom of Saudi Arabia. Water resources and uses in Kingdom of Saudi Arabia and Al-Baha are reviewed. Data are collected for fourteen dams that were constructed for water storage during the period from 2008 to 2012. The data is tabulated ascending according to the water storage. The purposes and types of the dams storing water in Al-Baha province are reviewed. The cost (in Saudi Riyal) is plotted versus the water storage (in m3) for these dams. Then regression analyses are done employing micro soft excel software. Optimum water storage is accomplished reasonably for the values less than 4 million m3, regardless type of the dam. It is obvious that the value of water storage of 4 million m3 is significant with respect to the associated cost. Type of the dam has to be taken into consideration for optimum water storage for the values more than 4 million m3. Optimum water storage for earth fill dams is achieved. For concrete dams, the value of 4 million m3 for water storage is significant. Optimum water storage is fixed for both less than and more than that significant value of 4 million m3. For all cases, equations are obtained to predict the cost of the required dam for optimum water storage.
Keywords:
Optimum, Water Storage, Dams, Al-Baha, Saudi Arabia
Cite this paper: Alaa Nabil El-Hazek, Optimum Water Storage in Al-Baha, Kingdom of Saudi Arabia, American Journal of Environmental Engineering, Vol. 4 No. 2, 2014, pp. 19-24. doi: 10.5923/j.ajee.20140402.01.
1. Introduction
Climate variability is likely to make rain fed agriculture more difficult. Storing water can help overcoming dry spells that would cause crops failure. Water storage for later use is essential for Kingdom of Saudi Arabia, KSA, as there are no natural surface water resources. KSA, west of Asia, is classified among arid regions. It has neither rivers nor lakes. The main water resources in KSA are ground water and rain water falling only in some provinces. Rain ranges between 110 mm/year and 300 mm/year on the western south provinces. The flowing rain water is estimated to be 4,644 million m3/year, 60% of them occur on the western south provinces, [1]. A small part of this water feeds the ground water reservoirs, while the other part flows to the Red Sea, west of KSA.Water resources in KSA in the year 2009 were 18,507 million m3, [2], and will be reduced to 16,307 million m3 in the year 2014, [1]. These various resources are summarized as percentage ratios of the total amount and are shown in figure 1. 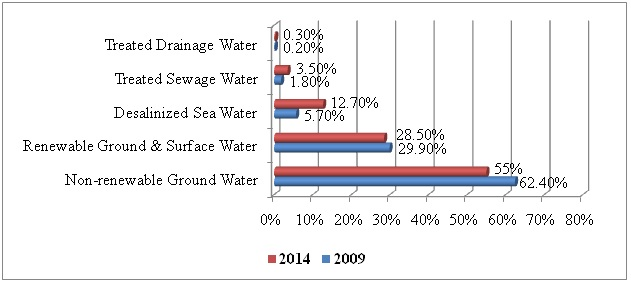 | Figure 1. Water Resources in KSA |
Uses of water in KSA are set to be equal to the available water resources, [1, 2]. These different uses are summarized as percentage ratios of the total amount and are represented in figure 2.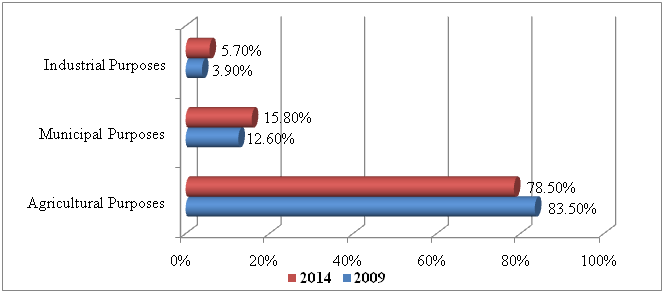 | Figure 2. Uses of Water in KSA |
2. Storing Water in KSA
Storing water defines locations where water is stored for later use. These range from natural water stores, such as groundwater aquifers, soil water and natural wetlands to small artificial ponds, tanks and reservoirs behind major dams.Dams as a tool for storing water are widely constructed in different provinces of KSA for irrigation purposes, recharge wells downstream the dams, potable water supply, and protection against dangerous floods.The total amount of stored water in KSA is 1,354 million m3 in the year 2009 through 302 dams in all provinces, [2]. The types of dams in KSA are concrete, earth fill or rock fill and underground dams.
3. Storing Water in AL-Baha Province
Al-Baha province is located on the western south of KSA. It contains six governorates in addition to Al-Baha city with a total population of about 412,000 capita in 2010 and the smallest area among the provinces of KSA.Water budget for Al-Baha province was 155 million m3 in the year 2009, [2], and will be reduced to 143 million m3 in the year 2014, [1]. These amounts of water represent only 0.84% and 0.88% of the total water budget of KSA. Figure 3 illustrates uses of water in Al-Baha province for the years 2009 and 2014.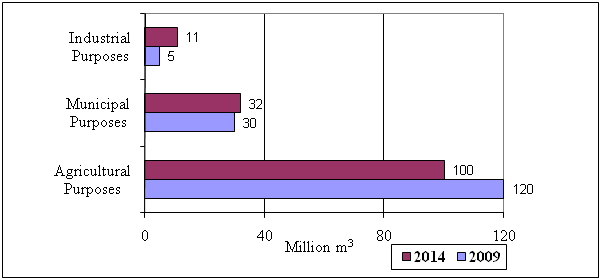 | Figure 3. Uses of Water in Al-Baha Province |
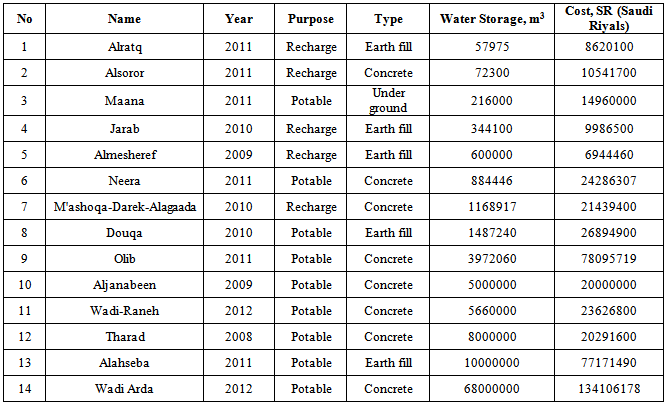
Data are collected for fourteen dams that were constructed in Al-Baha province during the period from 2008 to 2012, [3]. The data is tabulated ascending according to the water storage capacity, as shown in table 1, appendix A. Taking into consideration inflation rate that refers to a general rise in prices measured against a standard level of purchasing power, the average inflation rate from 2003 until 2012 in Saudi Arabia was 3.8%, [4]. So the cost of dams gathered will not be changed greatly.It is noted that the purposes and types of these dams are the same as all over KSA. However, the purposes and types of the fourteen dams are illustrated as percentage ratios in figures 4 and 5 respectively.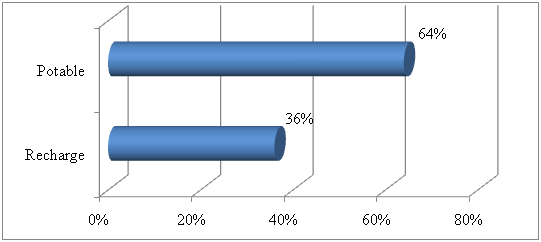 | Figure 4. Purposes of Dams in Al-Baha Province, KSA |
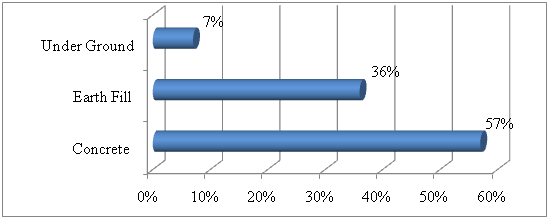 | Figure 5. Types of Dams in Al-Baha Province, KSA |
4. Analysis
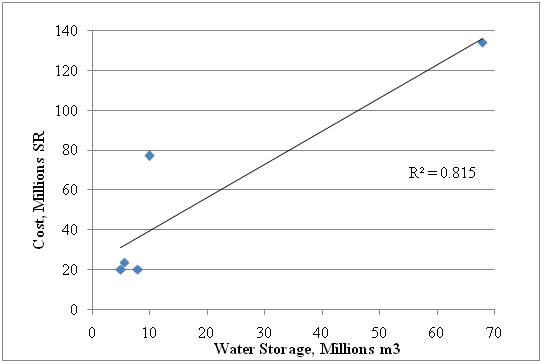
The cost (in Saudi Riyal) is plotted versus the water storage (in m3) for all the fourteen dams as shown in figure 6.It is noticed that the first thirteen dams have water storage up to 10 million m3, while the fourteenth dam has big water storage of 68 million m3. So, the cost versus the water storage for only the first thirteen dams is plotted in figure 7 in order to investigate the data.From figures 6 and 7, it is seen that the cost is oscillating with general increasing trend versus the water storage. It is obvious that the value of water storage of 4 million m3 is significant with respect to the associated cost. After this value, the cost decreases against the water storage. Then the cost is oscillating again with general increasing trend versus the water storage.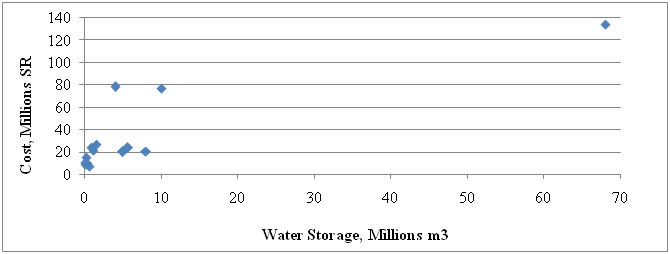 | Figure 6. Cost versus Water Storage for all Fourteen Dams |
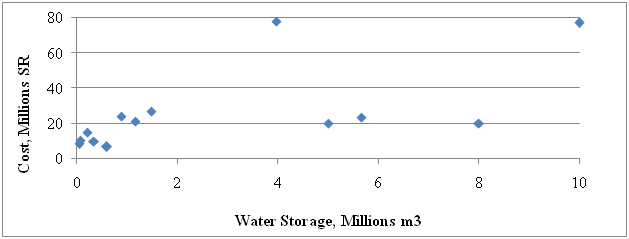 | Figure 7. Cost versus Water Storage for the first Thirteen Dams |
The fourteen dams are divided into two groups of dams. The first group includes the dams with water storage less than 4 million m3. This group contains the first nine dams. The second group includes the dams with water storage more than 4 million m3. This group contains the other five dams.For each group of dams, the cost is plotted versus the water storage, as illustrated in figures 8 and 9 respectively. Then regression analyses are done employing micro soft excel software. Also equations are obtained to predict the cost of the required dams for storing water.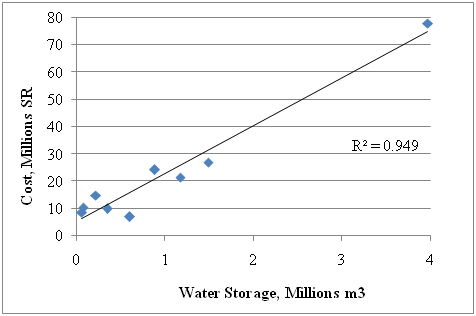 | Figure 8. Optimum Water Storage Less than 4 million m3 for all Dams |
 | Figure 9. Optimum Water Storage More than 4 million m3 for all Dams |
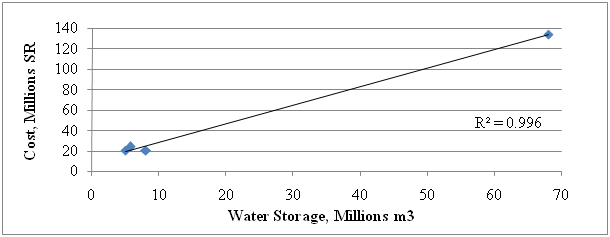
Due to the oscillating trends of the cost for less than or more than the value 4 million m3 of water storage, types of the dams are introduced into consideration. From table 1, appendix A, and figure 5, there are 1 under ground dam, 5 earth fill dams, and 8 concrete dams. The underground is excluded as it is only one dam.For the earth fill dams the cost is plotted versus the water storage, as shown in figure 10. Then regression analyses are done employing micro soft excel software. Equations are obtained to predict the cost of the required earth fill dams for storing water.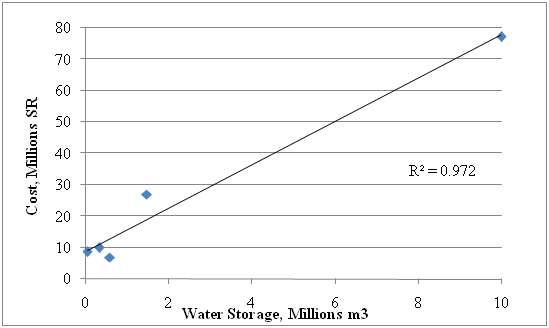 | Figure 10. Optimum Water Storage for Earth Fill Dams |
Similarly the cost of the concrete dams is plotted versus the water storage, as shown in figure 11.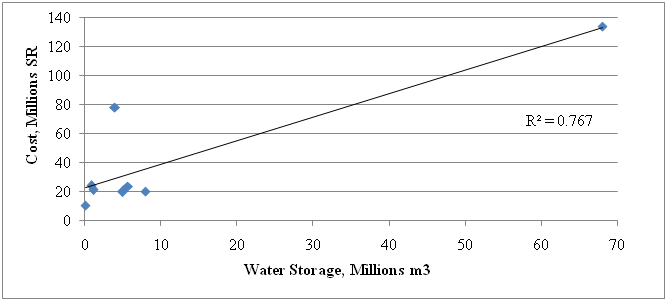 | Figure 11. Optimum Water Storage for all Concrete Dams |
The significant value of water storage of 4 million m3 appears again obviously. So the eight concrete dams are classified into two sub-groups.The first sub-group includes the first four dams with water storage less than 4 million m3, as illustrated in figure 12. The second sub-group includes the other four dams with water storage more than 4 million m3, as illustrated in figure 13. 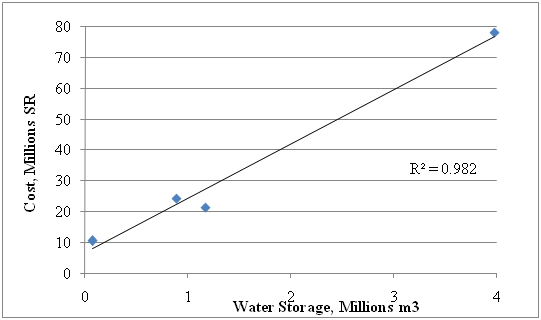 | Figure 12. Optimum Water Storage for Less than 4 million m3 for Concrete Dams |
 | Figure 13. Optimum Water Storage for More than 4 million m3 for Concrete Dams |
Then regression analyses are done employing micro soft excel software. Also equations are obtained to predict the cost of the required concrete dams for storing water.
5. Discussion of Results
The cost against the water storage for all the fourteen dams is illustrated before in figure 6. The trend line obtained from the linear regression analysis is shown in figure 14.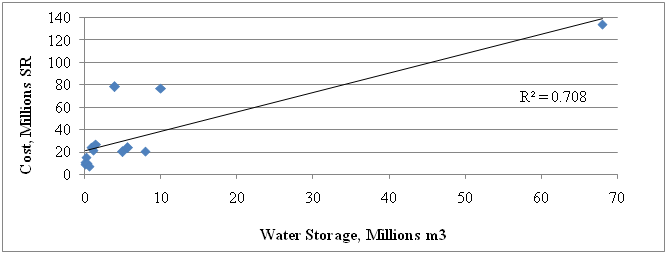 | Figure 14. Optimum Water Storage for all Fourteen Dams |
The obtained equation is: | (1) |
For all the obtained equations:C: The optimum cost (in Saudi Riyal).WS: Water storage (in m3). Although the value of obtained correlation factor R2 is not high, this equation may be used roughly to predict the cost of the required dam for storing water.It can be seen that there is a gap between the two last values for water storage. There is no data covering this gap. Excluding the last dam, it is found by regression analysis that R2 became only 0.38 instead of that shown on figure 14 for all dams. So considering only the first thirteen dams is not useful.Figure 8 concerning all dams of water storage less than 4 million m3 includes the trend line obtained from the linear regression analysis.The obtained equation is: | (2) |
This equation can be used effectively to predict the cost of the required dam for storing water less than 4 million m3 for all types of dams.Figure 9 concerning all dams of water storage more than 4 million m3 includes the trend line obtained from the linear regression analysis. Due to the medium value of R2, polynomial regression is performed employing micro soft excel software, as illustrated in figure 15.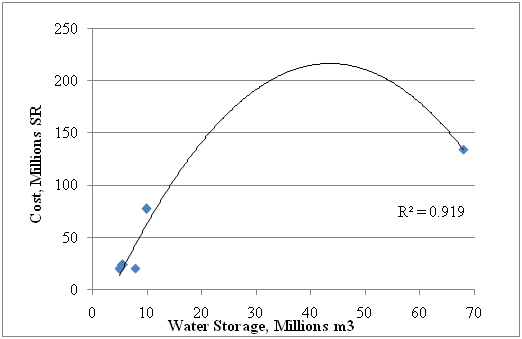 | Figure 15. Optimum Water Storage for More than 4 million m3 for all Types of Dams |
The obtained equation is: | (3) |
This equation can be used to predict the cost of the required dam for storing water more than 4 million m3 for all types of dams.Also from figure 15 representing polynomial regression it can be seen that the value 40 million m3 of water storage is significant. The cost increases versus water storage till this value after which the cost decreases. For example it can be viewed that the cost 150 million SR is required for both 21 million and 65 million m3 of water storage. Figure 10 concerning all earth fill dams includes the trend line obtained from the linear regression analysis.The obtained equation is: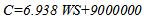 | (4) |
This equation can be used effectively to predict the cost of the required earth fill dam for storing water.Figure 11 concerning all concrete dams includes the trend line obtained from the linear regression analysis.The obtained equation is: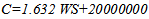 | (5) |
Although the value of obtained R2 is not high, this equation may be used roughly to predict the cost of the required concrete dam for storing water. Figure 12 includes the trend line obtained from the linear regression analysis concerning concrete dams of water storage less than 4 million m3.The obtained equation is: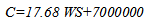 | (6) |
This equation can be used effectively to predict the cost of the required concrete dam for storing water less than 4 million m3. Figure 13 includes the trend line obtained from the linear regression analysis concerning concrete dams of water storage more than 4 million m3.The obtained equation is: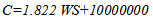 | (7) |
This equation can be used effectively to predict the cost of the required concrete dam for storing water more than 4 million m3.
6. Conclusions and Recommendations
Optimum water storage for all types of dams can be accomplished reasonably for the value less than 4 million m3 employing equation 2. Otherwise the type of the dam has to be taken into consideration for optimum water storage.Optimum water storage for earth fill dams is achieved. Equation 4 can be employed to predict the cost of the required earth fill dam for storing water.Optimum water storage for concrete dams is attained. The value of 4 million m3 for water storage is significant. Equations 6 and 7 can be employed to predict the cost of the required concrete dam for storing water less than and more than 4 million m3 respectively.It is recommended to study more cases for dams with different water storage values especially the range between 10 and 70 million m3. It is recommended also to apply this study to more cases for other different dams with different water storage values in KSA.
Appendix A
Table 1. Data for Dams, Al-Baha Province
 |
| |
|
References
| [1] | Ninth Development Plan, 2009 – 2014, Ministry of Planning, Kingdom of Saudi Arabia. |
| [2] | Eighth Development Plan, 2004 – 2009, Ministry of Planning, Kingdom of Saudi Arabia. |
| [3] | Dams under Construction in Al-Baha, Water Studies Department, Ministry of Water and Electricity, Kingdom of Saudi Arabia, 2011. |
| [4] | World Economic and Financial Surveys, Tensions from the Two-Speed Recovery: Unemployment, Commodities, and Capital Flows, April 2011. World Economic Outlook (WEO), International Monetary Fund (IMF) Home Page, http://www.imf.org/external/pubs/ft/weo/2011/01/-61k–HTML. (Website) |
 Abstract
 Reference
 Full-Text PDF
 Full-text HTML