-
Paper Information
- Next Paper
- Paper Submission
-
Journal Information
- About This Journal
- Editorial Board
- Current Issue
- Archive
- Author Guidelines
- Contact Us
American Journal of Environmental Engineering
p-ISSN: 2166-4633 e-ISSN: 2166-465X
2013; 3(5): 213-224
doi:10.5923/j.ajee.20130305.03
Effect of the Hydrodynamic Characteristics on IAF and Miaf Techniques of Oily Wastewater
 Abstract
 Reference
 Full-Text PDF
 Full-text HTML
Thamer. J. Mohammed, Shahad. S. Mohammed
Chemical Engineering Dept./University of Technology, Chemical and Petrochemical Engineering Dept. / University of Anbar
Correspondence to: Shahad. S. Mohammed, Chemical Engineering Dept./University of Technology, Chemical and Petrochemical Engineering Dept. / University of Anbar.
| Email: |  |
Copyright © 2012 Scientific & Academic Publishing. All Rights Reserved.
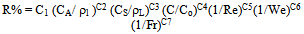
The aim of the present work is to select the most efficient systems of physical-chemical treatments by the flotation technique for treating oily wastewater. The flotation technique is applied an Induced Air Flotation (IAF), then applied Modified Induced Air Flotation (MIAF) and made comparisons between them. The experimental work was carried out using a flotation bubble column of Perspex glass (10cm I.D, 150cm height). Two different types of gas distributors namely perspex perforated plate and the second one is a porous ceramic plate. A high speed camera was used to measure the bubble rise velocity and bubble size. The variables that affect the removal efficiency (R%) of oil from wastewater is hydrodynamic characteristics, such as gas velocities (0.00636-0.0636) meter per second (m/sec), oil concentration, surfactant concentration (SLS, Camper) and the addition of alum, pH values, speed of stirrer, have been studied. The study showed that the removal efficiency of oil, COD and BOD were related to the additive dose of Alum and SLS. It was found that the flotation rate increases when using alum and surfactant together, the fastest removal rate was obtained when pH 4.3 and also, when a stirrer speed 200 rpm was used, the removal efficiency was about 98%(residual oil <10 ppm) when the initial oil concentration was 800 ppm. The interfacial area (a) obtained experimentally from the bubble hydrodynamic parameters and the velocity gradient (G), have been proven to be important parameters for for controlling the flotation process efficiency. The experimental results of the removal efficiency are represented in two and three dimensional graphs. An empirical correlation for gas hold up using MIAF has been developed. And general correlation for the removal efficiency (R %) using dimensionless groups was found to be: R% = 1.67 (CA/ ρl )145.7 (CS/ρL)161 (C/Co)0.0624(1/Re)1.48(1/We)1.54 (1/Fr)1.096.
Keywords: Hydrodynamic, Oily, Flotation, Surfactant, MIAF, Interfacial Area, Velocity Gradient
Cite this paper: Thamer. J. Mohammed, Shahad. S. Mohammed, Effect of the Hydrodynamic Characteristics on IAF and Miaf Techniques of Oily Wastewater, American Journal of Environmental Engineering, Vol. 3 No. 5, 2013, pp. 213-224. doi: 10.5923/j.ajee.20130305.03.
Article Outline
1. Introduction
- Oil contaminated wastewater has been recognized as one of the most concerned pollution sources. This kind of wastewater comes from a variety of sources such as crude oil production, oil refinery, compressor, condensates, lubricant and cooling agents and car washing. The oily wastewater is considered as hazardous industrial wastewater because it contains toxic substances such as phenols, petroleum, hydrocarbons, and poly aromatic hydrocarbons; therefore the treatment of oily wastewater is particularly difficult, especially when oil is found in low concentration in the water phase[1,2].The type of oil-water mixture may be classified as oil and present, as free oil (droplet size ≥150µm), grease, dispersed oil (20-150µm), emulsified oil or dissolved oil (droplet size <20 µm)[3,4]. A wastewater with an oil-water mixture where the oil is said to be soluble is a liquid where oil is not present in the form of droplets the oil particle size would be typically less than
 [5]. Soluble oil requires the use of ion-exchange technology[6]. Carbon adsorption or membrane filtration treatment is very effective to remove emulsified oil[7]. Non-emulsified dispersed oil can be removed by gravity separation, e.g. hydro cyclones, gravity filter or sedimentation or flotation where oily droplets larger than
  are removed by flotation techniques[6]. Flotation is an alternative as it has high efficiency as well as low operating cos[8]. Flotation separation is a process used in many industries to separate one constituent from another[9]. The use of flotation has a great potential owing to high throughput and efficiency of modern equipment[10]. The general process of flotation separation can be divided into two types, dispersed and dissolved air flotation[9].Aneak and Wirach[12], was studied the effect of pH by acid adjustment (HCl & H2SO4) and using a coagulant (FeCl3) aid in combination with pH control on greases and oil removal in wastewater from bio diesel process. They concluded that the pH should be low to enhance oil removal efficiency, and the use of coagulant (FeCl3) in combination with pH adjustment may be more practical and the oil removal efficiency 97% at the pH (4-7) and the efficiency could be enhance by using cationic polymer as a coagulant aid. Lima and Silva[13] studied the use of an anionic surfactant in the recovery process of organic compounds present in oily effluents from petroleum industry a separation process using gaseous bubbles formed by the passage of a gaseous stream through a liquid column, surfactant concentration from(0.045-4.545)g/l at a fix flow rate (500)cm3/min. They found that the efficiency was around 80% when concentration of surfactant is (0.09) g/l.Shanmugam and Saravann[14], studied the effect of various parameters like superficial gas velocity and speed of stirrer (N) on fractional gas hold up in bubble column of 0.14m ID and 2m height. They concluded that fractional gas hold up increased with increasing superficial gas velocity and speed of the stirrer. The aim of this paper is to investigate the possibility and efficiency of flotation treatment process of oily wastewater in North Oil Company, and to study the effect of different parameters of hydrodynamic characteristic in flotation bubble column on removal efficiency of oil. It is also to study the effects of various variables on the removal efficiency such as, oil concentration, different type of surfactant concentration, pH and addition of alum as a coagulant flocculent, and finally to show the effect of interfacial area and velocity gradient on the removal efficiency.
2. Materials and Methods
- The experiment apparatus is shown schematically in Fig. (1), The experiments were performed into a cylindrical Perspex glass column with the dimensions (10 cm I.D and 150 cm in height) and operated in a semi- batch mode (Batch wastewater, continuous air). Oily water with different concentration (30, 100 and 800 ppm) was poured gently at the top of the column. The drop oil sizes distribution were found by using microscope and the mean drop diameter was found to be equal
 the inner column had (3) sample ports arranged axially the first one (10) cm above the bottom of the column and the other two taps arranged at interval of 50 cm and these taps were glued by means of super glue and also (2) pressure taps located along the column and arranged at interval of (35 )cm.The pressure taps were connected to manometer by plastic tube of (10) mm inside diameter to measure the local gas hold up. At the bottom of the column distributor type porous in 120m was used. The bubble size was measured by using high speed camera 9.1 mega pixel, 20X optical zoom, and it connected to PC (Laptop type Acer) in order to analyzed the images by computer programming. Moreover the bubble characteristics is determined as the same method by Painmanaku and Saataravet[15] and Shahad[16]. The analysis of sample was carried out by using (UV type 1100) and the oil was extracted by carbon tetra chloride.The materials which is used in this work are:• Surfactant sodium laurel sulfate (SLS) was used as anionic emulsifier, its molecular weight is equal to 288.38 gm/mole and its purity is 90%.• Aluminum sulfate (Alum) Commercial alum was used in the experiments, it is a white dry powder, has a formula of (Al2 (SO4)3.18H2O) and molecular weight of (594.4 gm/mole).
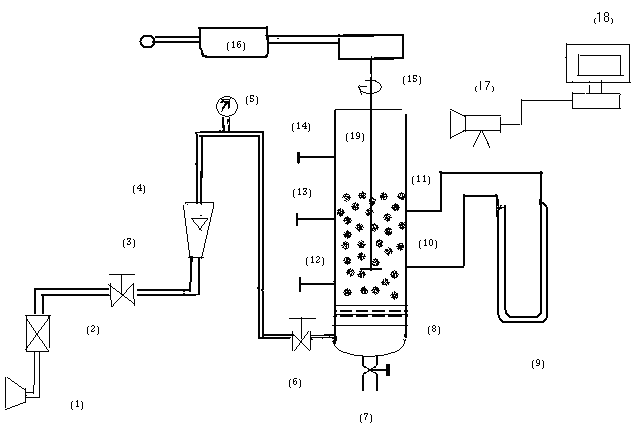 | Figure 1. Schematic diagram for the experimental apparatus; 1-air compressor, 2-filter, 3-neede valve, 4-rotameter, 5-pressure gage, 6-check valve, 7-drain valve, 8-distributor, 9-manometer, 10&11-pressure taps, 12,13&14-sampling valve, 15-stirrer, 16-motors, 17-camera, 18-PC, 19-flotation column |
3. Results and Discussion
3.1. Bubble Diameter
- The relationship of the bubble diameter at the center in the axial direction of the column at different superficial gas velocities (0.00636 to 0.0636 meter per second (m/s)) was shown in Fig.2, it can be seen from this figure that increasing gas velocity resulted in an increasing in bubble diameter. The effect of addition of surfactant on bubble diameters was shown in Fig.3. Examining Fig.4, it can be seen that the bubble diameters decreased with increasing the concentration of sodium laurel sulfate (SLS). This phenomenon can be explained by the addition of surfactant to the water which hinders bubbles coalescence by accumulating at the gas-liquid interface and orienting their hydrophilic group into the liquid film surrounding the gas bubble and thus creating repulsive electric force when two bubbles come close to each other[17].
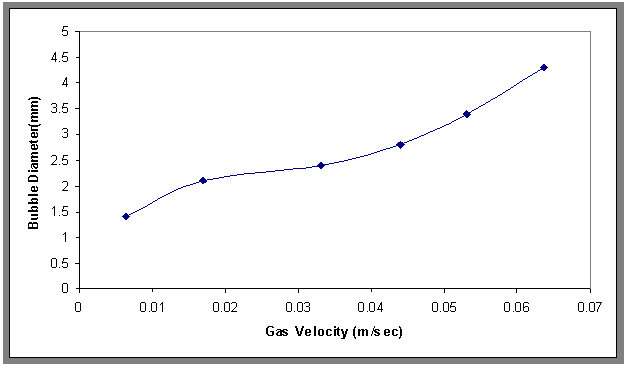 | Figure 2. Effect of superficial gas velocity on bubble diameter, H=70 cm, and Co= 30 ppm |
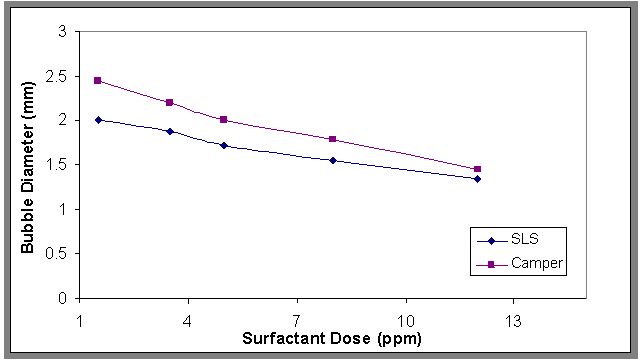 | Figure 3. Effect of adding surfactant on the bubble diameter Q=0.0113(m3/min), H=70 cm, and Co=100 ppm |
3.2. Gas Hold-up
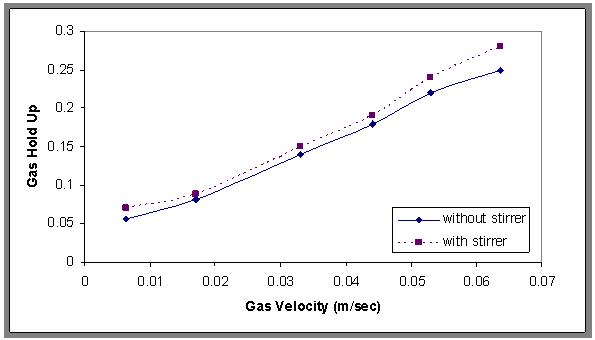
- Gas hold-up was measured by the visual observation of liquid level. The relationship between gas hold-up and flow rates of gas were plotted in Fig.4, this figure showed increasing in gas hold up with increasing flow rates of gas. These results indicated that the flotation column work at bubbly region because maximum value resulted about 0.3 this notice by Abdullah et al.[18]. And also this figure showed that the reading in gas hold up with and with out surfactant and it can be concluded the gas hold up increase when adding surfactant, this results agreement with lima and Silva[13].
3.3. Effect of pH
- The effect of pH on the removal of emulsified oil by bubble column was shown in Fig.5. Plotting the removal efficiency (R %) versus time at different values of pH. From this figure it can be seen that (R%) increases suddenly at the beginning of the run then the ratio began to increase slowly with time and it was found that the highest removal achieved when the pH of the emulsion was about 4.3. This result was similar to Aneak and Wirach[12]. The effect of pH on the removal efficiency and by adding alum in different dose are plotted in Fig.6. This figure shows that the collection efficiency at pH=4 .3 is the highest value and alum dose 560 ppm.
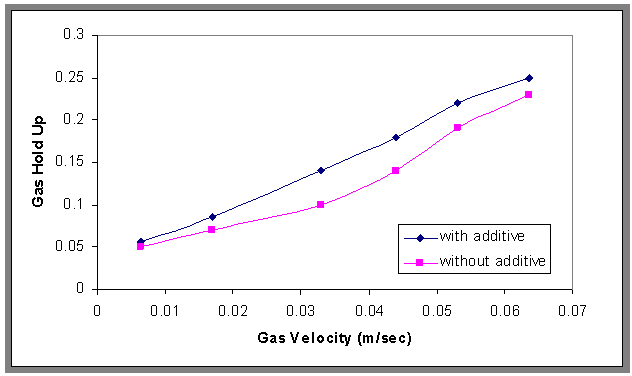 | Figure 4. Effect of different gas velocity and surfactant on gas hold-up, H=70 cm, and Co=30 ppm |
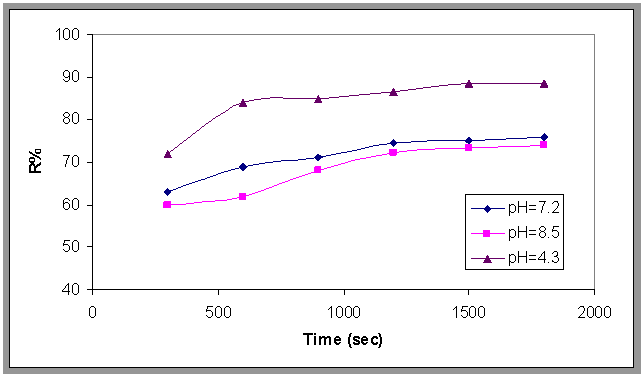 | Figure 5. Effect of pH on the oil removal, Q=0.0113 m3/min, H=70 cm and Co=800 ppm |
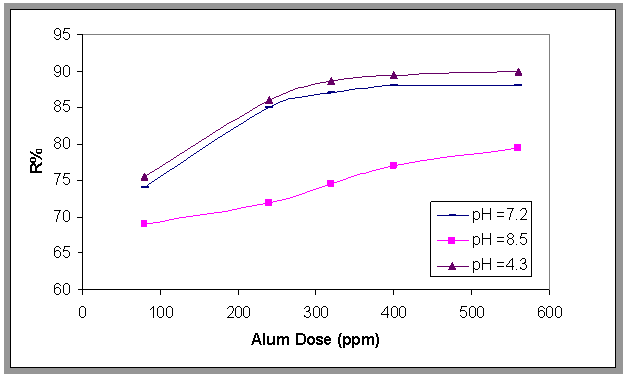 | Figure 6. Effect of adding Alum dose on the oil removal efficiency, H=70 cm, at different pH, and Co=800 ppm , t=1500 s |
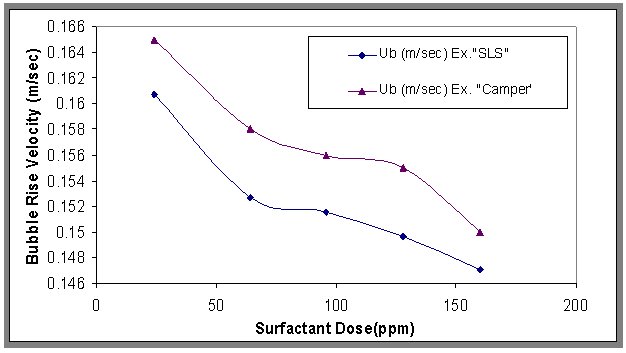 | Figure 7. Effect of surfactant concentration on bubble rise velocity, H=70cm and Co= 800ppm |
3.4. Bubble Rise Velocity
- The results of bubble rise velocities at different concentrations of surfactant for Co=800 ppm are shown in Fig.7. It can be seen that the bubble rise velocity decreased with adding surfactants. This decrease is explained on the basis of surface tension gradient present on the bubble surface[19]. And also the large bubbles have a small drag force, and also depend on stock's equation, therefore the rise velocity increased, while the relationship between bubble rise velocity and different gas velocities was plotted in Fig.8. From this figure, it can be noticed that the bubble rise velocity increased with increasing gas velocities, and also shows the rise velocity of pure water was higher than oily wastewater, because the contaminants affect mass transfer via hydrodynamic and molecular effects, and the contaminants decrease the mobility of the interface so the rise velocity decreased[20].
3.5. Effect of the Initial Oil Concentration
- The removal rate of oil at various initial oil concentrations (30 to 800 ppm) was studied and it was found that the removal rate increases with increasing initial oil concentration that because when the concentration of oil increased the contact of air bubble and oil droplet was increased. This is shown in Figs.9 and 10, which show the relationship between removal efficiency (R%) with time of flotation at different concentrations (100-800ppm) of oily wastewater.
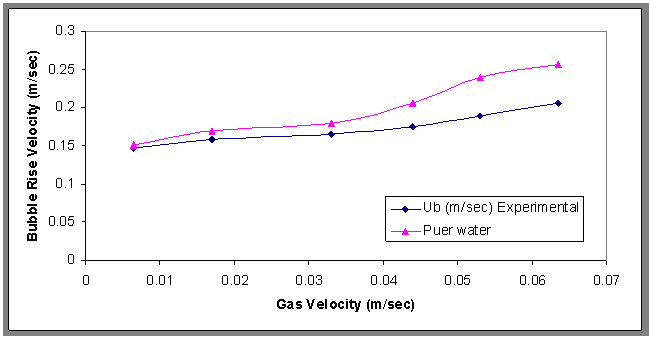 | Figure 8. Effect of different gas velocity on the bubble rise velocity, H=70cm, Co= 30 ppm |
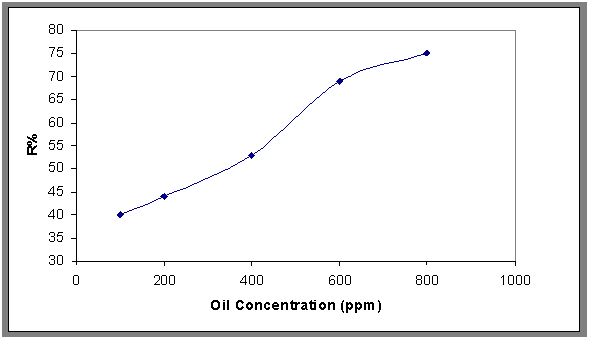 | Figure 9. Effect of the initial oil concentration on the removal efficiency, pH=7.2, Q= 0.0113 m3/min, t=1500 sec |
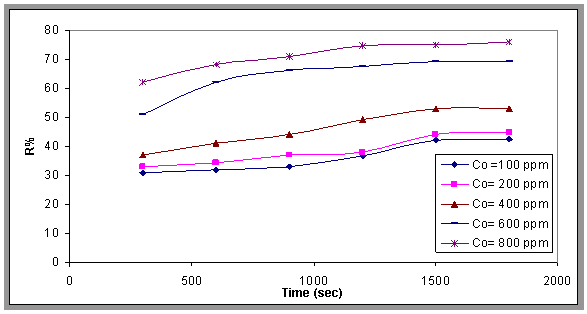 | Figure 10. Effect of the initial oil concentration on the removal efficiency, pH=7.2, Q= 0.0113 m3/min, as function of time |
3.6. Effect of Mixing
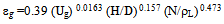
- The experimental results as induced air flotation (IAF) by porous distributor and chemical treatment process by adding Alum and Surfactant are modify by the flotation bubble column combined with agitator mixer has different speed and this system is called MIAF[15]. This process and the results were compared with the results obtained from IAF process.Figure 11. show the effect of different speeds of the stirrer (50-250) rpm(equivalent to 22.6-253sec-1) on the gas hold up, where the gas hold up increases when increasing the speed of the stirrer, and Fig.12 shows the comparison between the gas hold up with and without stirrer and found that the gas hold up with stirrer was higher than without stirrer. This may be due to the formation of larger gas bubbles where the stirrer plays a vital role in breaking of large bubbles; thereby increasing the gas hold up, this result is in agreement with Shanmugam[14] and Fig.13. show the effect of the mixing on the oil removal efficiency at different time. It can be noticed at the range (50-250) rpm that the removal efficiency increased slowly and the high removal efficiency can be obtained at 200 rpm and the removal efficiency decreased slowly compared with 200 at 250 rpm. The system is give higher R% than (IAF). This result can be explained that the size of oil droplets increases due to the sweep flocs coagulation from the presence of alum content and thus accelerates the separation flotation process. The correlation has been developed as shown in Eqn.6. for fractional gas hold up for stirred flotation column based on computer programming with statistical method.
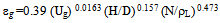 | (1) |
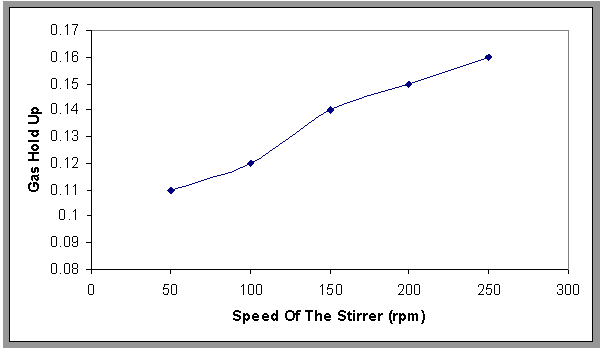 | Figure 11. Effect of the speed of the stirrer on the gas hold-up, H=70 cm, Co=800 ppm |
 | Figure 12. The comparison in gas hold up values, H=70 cm, Co=800 ppm |
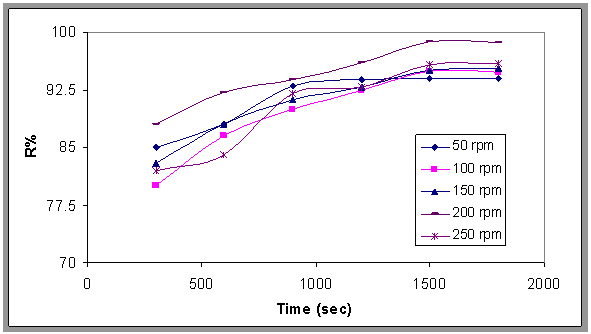 | Figure 13. Effect of the speed of the stirrer on the removal efficiency, pH=7.2, Q=0.0113 m^3/min, Co=800 ppm , 64 sls+240 alum |
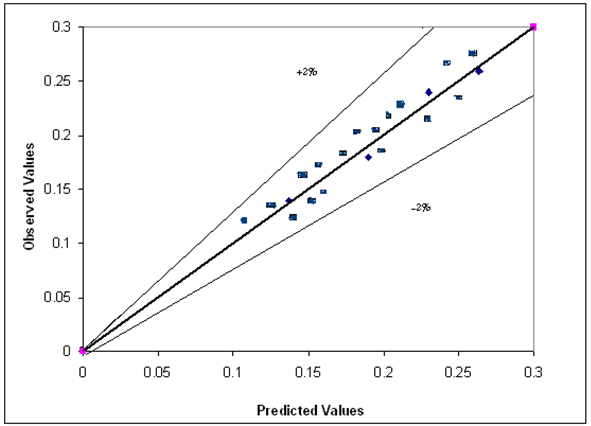 | Figure 14. Predicted versus observed gas hold up of Eqn.1 |
3.7. Effect of Interfacial Area and Velocity Gradient on the Removal Efficiency
- Figure 15 shows that the interfacial areas vary between (40.4and 112) 1/m for IAF and (65.3-143) l/m for MIAF, while gas velocities can alter between (0.00636 and 0.0636 m/sec). It can be noted that the obtained values are corresponded with the number of bubbles generated and thus the available bubble surface for the interacting with oil droplets presence in the liquid phase, therefore, these values of (a) roughly increase linearly with the gas flow rate injected into the flotation column, but the MIAF system give higher value of (a) than IAF. The small effect of alum concentrations on the interfacial areas has been again observed as shown previously in the results obtained with the variation or bubble sizes. Note that, the values of (a) are directly linked to the bubble diameters, bubble rising velocities and their formation frequencies, due to the variation of calculated velocity gradient (G) with gas flow rate as presented in Fig.16. The specific interfacial area (a) and velocity gradient can be expressed by the following equations (2) and (3) as respectively[16].
 | (2) |
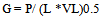 | (3) |
3.8. Dimensionless Groups for Removal Efficiency
- Experimental results for different parameters were correlated in the general dimensionless Eqn.4 that is
 | (4) |
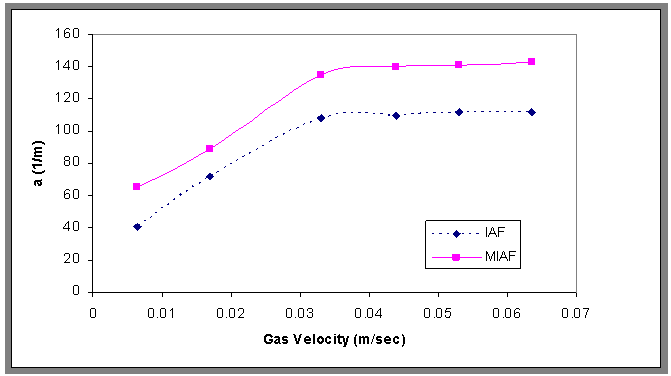 | Figure 15. Interfacial area versus gas velocity for the IAF and MIAF processes, Co=30 ppm , t=1500 sec, H=70 cm |
|

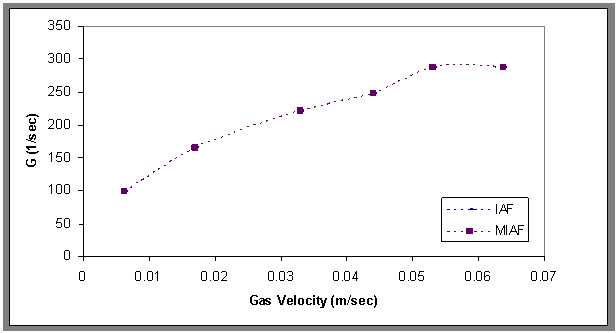 | Figure 16. Velocity gradient versus gas velocity for the IAF and MIAF processes, Co=30 ppm , t=1500 sec, H=70 cm |
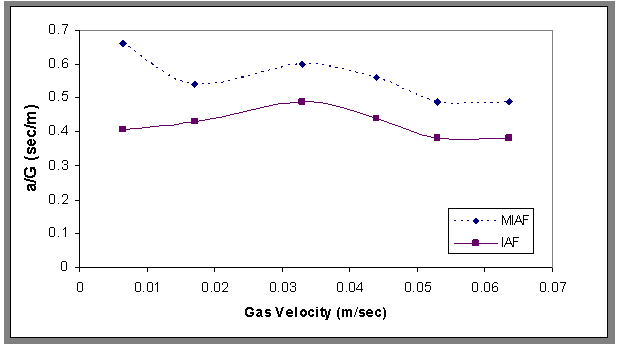 | Figure 17. Ratio of interfacial area to velocity gradient versus gas velocity for the IAF and MIAF processes, Co=30 ppm , t=1500 sec, H=70 cm |
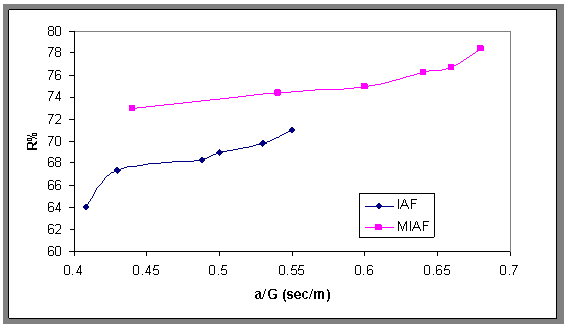 | Figure 18. Treatment efficiency versus ratio of interfacial area to velocity gradient for the IAF and MIAF processes |
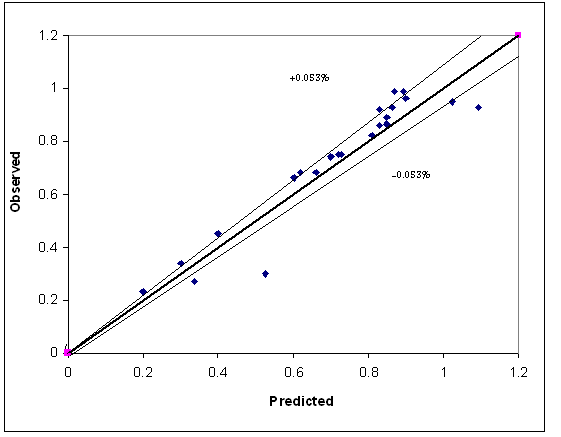 | Figure 19. Predicted versus observed removal efficiency |
 | Figure 20. Effect of the best condition of oil removal, Co=800ppm, Ug=0.025m/sec |
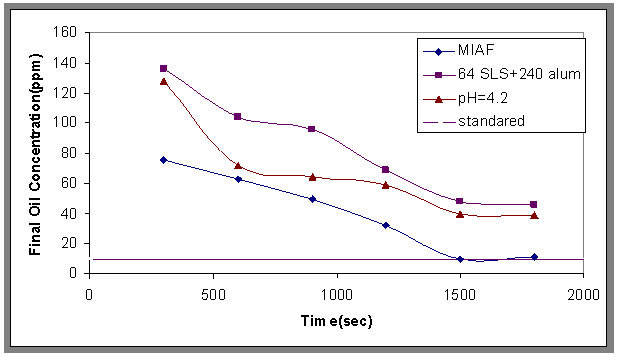
3.9. The Best Conditions
- As results, from the experimental work, the best conditions that give maximum removal of oil from wastewater, can be obtained when the concentration of surfactant is 64ppm, alum is 240ppm with pH 4.2 and by using a stirrer with 200 rpm. Then from Fig.20 the oil concentration in the treated water is nearest to the Iraqi regulation for the preservation of water sources (act No.B (2)-2001 amendment), where the standard final oil concentration was <10 ppm, COD <150 ppm and BOD<40 ppm[21].
4. Conclusions
- • Induced air flotation (IAF) and modified induced air flotation (MIAF) were applied and analyzed in term of treatment efficiency; the removal efficiency obtained by IAF processes was smaller than obtained in MIAF.• Bubble size increases with the increase in air flow rate, and the size of bubble decrease with adding surfactant.• Adding alum and (SLS) together has a high coagulant effect than adding them individually.• The best removal efficiency was found at pH 4.3.• The gas hold up increased with the increase of gas velocity and also increased when adding surfactant, when using the stirrer. The gas hold up was correlated according to the following equation:
 • A correlation for the removal efficiency was correlated and found acceptable values between the experiment and the observed value:R% = 1.67 (CA/ ρl )145.7 (CS/ρL)161 (C/Co)0.0624(1/Re)1.48(1/We)1.54 (1/Fr)1.096
Notation
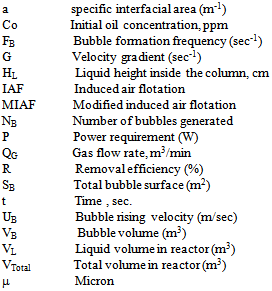
Greek Symbols
